Drug Information
Drug (ID: DG00049) and It's Reported Resistant Information
| Name |
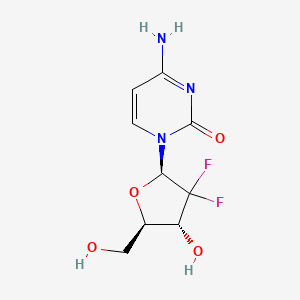
Gemcitabine
|
||||
|---|---|---|---|---|---|
| Synonyms |
Gemcitabine hydrochloride; DDFC; DFdC; DFdCyd; Folfugem; GEO; Gamcitabine; GemLip; Gemcel; Gemcin; Gemcitabina; Gemcitabinum; Gemtro; Gemzar; Zefei; Gemcitabine HCl; Gemcitabine stereoisomer; LY 188011; LY188011; Gemcitabina [INN-Spanish]; Gemcitabinum [INN-Latin]; Gemzar (TN); Gemzar (hydrochloride); Inno-D07001; LY-188011; Gemcitabine (USAN/INN)
Click to Show/Hide
|
||||
| Indication |
In total 1 Indication(s)
|
||||
| Structure |
|
||||
| Drug Resistance Disease(s) |
Disease(s) with Clinically Reported Resistance for This Drug
(8 diseases)
[2]
[1]
[4]
[5]
[6]
[8]
[11]
[12]
Disease(s) with Resistance Information Discovered by Cell Line Test for This Drug
(13 diseases)
[3]
[3]
[7]
[10]
[13]
[14]
[15]
[16]
[17]
[18]
[19]
[20]
[21]
|
||||
| Target | Ribonucleoside-diphosphate reductase M2 (RRM2) | RIR2_HUMAN | [1] | ||
| Click to Show/Hide the Molecular Information and External Link(s) of This Drug | |||||
| Formula |
C9H11F2N3O4
|
||||
| IsoSMILES |
C1=CN(C(=O)N=C1N)[C@H]2C([C@@H]([C@H](O2)CO)O)(F)F
|
||||
| InChI |
1S/C9H11F2N3O4/c10-9(11)6(16)4(3-15)18-7(9)14-2-1-5(12)13-8(14)17/h1-2,4,6-7,15-16H,3H2,(H2,12,13,17)/t4-,6-,7-/m1/s1
|
||||
| InChIKey |
SDUQYLNIPVEERB-QPPQHZFASA-N
|
||||
| PubChem CID | |||||
| ChEBI ID | |||||
| TTD Drug ID | |||||
| VARIDT ID | |||||
| INTEDE ID | |||||
| DrugBank ID | |||||
Type(s) of Resistant Mechanism of This Drug
 ADTT: Aberration of the Drug's Therapeutic Target
 DISM: Drug Inactivation by Structure Modification
 EADR: Epigenetic Alteration of DNA, RNA or Protein
 IDUE: Irregularity in Drug Uptake and Drug Efflux
 MRAP: Metabolic Reprogramming via Altered Pathways
 RTDM: Regulation by the Disease Microenvironment
 UAPP: Unusual Activation of Pro-survival Pathway
Drug Resistance Data Categorized by Their Corresponding Diseases
ICD-02: Benign/in-situ/malignant neoplasm
| Drug Resistance Data Categorized by Their Corresponding Mechanisms | ||||
|
Metabolic Reprogramming via Altered Pathways (MRAP)
|
||||
| Key Molecule: ATP binding cassette subfamily B member 6 (ABCB6) | [22] | |||
| Metabolic Type | Lipid metabolism | |||
| Resistant Disease | Non-small cell lung carcinoma [ICD-11: 2C25.Y] | |||
| Molecule Alteration | Expression | Up-regulation |
||
| Differential expression of the molecule in resistant disease | ||||
| Classification of Disease | Lung cancer [ICD-11: 2C25] | |||
| The Specified Disease | Non-small cell lung carcinoma | |||
| The Studied Tissue | Lung tissue | |||
| The Expression Level of Disease Section Compare with the Healthy Individual Tissue | p-value: 9.34E-02 Fold-change: 1.26E-01 Z-score: 1.69E+00 |
|||
| Experimental Note | Revealed Based on the Cell Line Data | |||
| Cell Pathway Regulation | HIF-1 signaling pathway | Activation | hsa04066 | |
| In Vitro Model | A549 cells | Lung | Homo sapiens (Human) | CVCL_0023 |
| H1703 cells | Lung | Homo sapiens (Human) | CVCL_1490 | |
| Experiment for Molecule Alteration |
qRT-PCR; Western blot analysis | |||
| Experiment for Drug Resistance |
Cell viability assay | |||
| Mechanism Description | First, an analysis of ABCB6 expression in human NSCLCs was found to be associated with poor prognosis and gemcitabine resistance in a hypoxia-inducible factor (HIF)-1-dependent manner. Further experiments showed that activation of HIF-1alpha/ABCB6 signaling led to intracellular heme metabolic reprogramming and a corresponding increase in heme biosynthesis to enhance the activation and accumulation of catalase. Increased catalase levels diminished the effective levels of reactive oxygen species, thereby promoting gemcitabine-based resistance. In a mouse NSCLC model, inhibition of HIF-1alpha or ABCB6, in combination with gemcitabine, strongly restrained tumor proliferation, increased tumor cell apoptosis, and prolonged animal survival. | |||
| Key Molecule: Integrin beta-5 (ITGB5) | [18] | |||
| Metabolic Type | Redox metabolism | |||
| Resistant Disease | Lung adenocarcinoma [ICD-11: 2C25.0] | |||
| Molecule Alteration | Expression | Up-regulation |
||
| Differential expression of the molecule in resistant disease | ||||
| Classification of Disease | Lung cancer [ICD-11: 2C25] | |||
| The Specified Disease | Lung adenocarcinoma | |||
| The Studied Tissue | Lung tissue | |||
| The Expression Level of Disease Section Compare with the Healthy Individual Tissue | p-value: 3.87E-14 Fold-change: 4.20E-01 Z-score: 8.33E+00 |
|||
| Experimental Note | Revealed Based on the Cell Line Data | |||
| In Vitro Model | A5419 cells | Lung | Homo sapiens (Human) | N.A. |
| LLC cells | Lung | Homo sapiens (Human) | CVCL_A9AW | |
| Experiment for Molecule Alteration |
qRT-PCR; Western blot analysis | |||
| Experiment for Drug Resistance |
IC50 assay | |||
| Mechanism Description | Mechanistically, our proteomic analysis reveals a consistent up-regulation of sphingolipid metabolic enzyme ASAH2 and beta5-integrin expression in GemR pancreatic and lung cancer cells as well as stable beta5-integrin-expressing cells. | |||
|
Epigenetic Alteration of DNA, RNA or Protein (EADR)
|
||||
| Key Molecule: EGFR antisense RNA 1 (EGFR-AS1) | [4] | |||
| Resistant Disease | Non-small cell lung cancer [ICD-11: 2C25.Y] | |||
| Molecule Alteration | Expression | Up-regulation |
||
| Differential expression of the molecule in resistant disease | ||||
| Classification of Disease | Lung cancer [ICD-11: 2C25] | |||
| The Specified Disease | Lung squamous cell carcinoma | |||
| The Studied Tissue | Lung | |||
| The Expression Level of Disease Section Compare with the Healthy Individual Tissue | p-value: 5.70E-01 Fold-change: 9.04E-02 Z-score: 5.69E-01 |
|||
| Experimental Note | Identified from the Human Clinical Data | |||
| Cell Pathway Regulation | Cell proliferation | Activation | hsa05200 | |
| IGF1R/AKT/PI3K signaling pathway | Activation | hsa05224 | ||
| In Vitro Model | A549 cells | Lung | Homo sapiens (Human) | CVCL_0023 |
| H1299 cells | Lung | Homo sapiens (Human) | CVCL_0060 | |
| NCI-H358 cells | Lung | Homo sapiens (Human) | CVCL_1559 | |
| NCI-H292 cells | Lung | Homo sapiens (Human) | CVCL_0455 | |
| NCI-H460 cells | Lung | Homo sapiens (Human) | CVCL_0459 | |
| NCI-H838 cells | Lung | Homo sapiens (Human) | CVCL_1594 | |
| Experiment for Molecule Alteration |
qRT-PCR | |||
| Experiment for Drug Resistance |
CCK8 assay | |||
| Mechanism Description | Long non-coding RNA EGFR-AS1 Can enhance IGF1R expression by suppressing miR-223 expression to promotes gemcitabine resistance in the non-small cell lung cancer. | |||
| Key Molecule: Insulin-like growth factor 1 receptor (IGF1R) | [4] | |||
| Resistant Disease | Non-small cell lung cancer [ICD-11: 2C25.Y] | |||
| Molecule Alteration | Expression | Up-regulation |
||
| Differential expression of the molecule in resistant disease | ||||
| Classification of Disease | Lung cancer [ICD-11: 2C25] | |||
| The Specified Disease | Lung cancer | |||
| The Studied Tissue | Lung tissue | |||
| The Expression Level of Disease Section Compare with the Healthy Individual Tissue | p-value: 6.95E-04 Fold-change: 3.78E-02 Z-score: 3.42E+00 |
|||
| Experimental Note | Identified from the Human Clinical Data | |||
| Cell Pathway Regulation | Cell proliferation | Activation | hsa05200 | |
| IGF1R/AKT/PI3K signaling pathway | Activation | hsa05224 | ||
| In Vitro Model | A549 cells | Lung | Homo sapiens (Human) | CVCL_0023 |
| H1299 cells | Lung | Homo sapiens (Human) | CVCL_0060 | |
| NCI-H358 cells | Lung | Homo sapiens (Human) | CVCL_1559 | |
| NCI-H292 cells | Lung | Homo sapiens (Human) | CVCL_0455 | |
| NCI-H460 cells | Lung | Homo sapiens (Human) | CVCL_0459 | |
| NCI-H838 cells | Lung | Homo sapiens (Human) | CVCL_1594 | |
| Experiment for Molecule Alteration |
Western blot analysis; RT-qPCR | |||
| Experiment for Drug Resistance |
CCK8 assay | |||
| Mechanism Description | Long non-coding RNA EGFR-AS1 Can enhance IGF1R expression by suppressing miR-223 expression to promotes gemcitabine resistance in the non-small cell lung cancer. | |||
| Drug Sensitivity Data Categorized by Their Corresponding Mechanisms | ||||
|
Unusual Activation of Pro-survival Pathway (UAPP)
|
||||
| Key Molecule: Deoxycytidine kinase (DCK) | [38] | |||
| Sensitive Disease | Lung cancer [ICD-11: 2C25.5] | |||
| Molecule Alteration | Expression | Up-regulation |
||
| Differential expression of the molecule in resistant disease | ||||
| Classification of Disease | Lung cancer [ICD-11: 2C25] | |||
| The Specified Disease | Lung cancer | |||
| The Studied Tissue | Lung tissue | |||
| The Expression Level of Disease Section Compare with the Healthy Individual Tissue | p-value: 1.56E-05 Fold-change: 3.46E-02 Z-score: 4.41E+00 |
|||
| Experimental Note | Revealed Based on the Cell Line Data | |||
| In Vitro Model | A549 cells | Lung | Homo sapiens (Human) | CVCL_0023 |
| H460 cells | Lung | Homo sapiens (Human) | CVCL_0459 | |
| SW1573 cells | Lung | Homo sapiens (Human) | CVCL_1720 | |
| Experiment for Molecule Alteration |
qRT -PCR | |||
| Experiment for Drug Resistance |
Sulforhodamide B (SRB) test assay | |||
| Mechanism Description | Deoxycytidine kinase (dCk) is essential for phosphorylation of natural deoxynucleosides andanalogs, such as gemcitabine and cytarabine, two widely used anticancer compounds. miR-330 expression negatively correlated withdCk mRNA expression, suggesting a role of miR-330 in post-transcriptional regulationof dCk. Expression of miR-330 in various colon and lung cancer cell lines,as measured by QRT-PCR, varied five-fold between samples and correlated with in-vitro gemcitabineresistance. | |||
| Drug Resistance Data Categorized by Their Corresponding Mechanisms | ||||
|
Metabolic Reprogramming via Altered Pathways (MRAP)
|
||||
| Key Molecule: Acyl-CoA thioesterase 8 (ACOT8) | [23] | |||
| Metabolic Type | Lipid metabolism | |||
| Resistant Disease | Pancreatic ductal adenocarcinoma [ICD-11: 2C10.0] | |||
| Molecule Alteration | Expression | Up-regulation |
||
| Differential expression of the molecule in resistant disease | ||||
| Classification of Disease | Pancreatic cancer [ICD-11: 2C10] | |||
| The Specified Disease | Pancreatic ductal adenocarcinoma | |||
| The Studied Tissue | Pancreas | |||
| The Expression Level of Disease Section Compare with the Healthy Individual Tissue | p-value: 5.82E-14 Fold-change: 6.86E-01 Z-score: 8.55E+00 |
|||
| Experimental Note | Revealed Based on the Cell Line Data | |||
| In Vivo Model | ACOT8 knockdown in nude mice; ACOT8 overexpression in nude mice | Mice | ||
| Experiment for Molecule Alteration |
Transcriptome sequencing and analysis | |||
| Experiment for Drug Resistance |
Tumor volume assay | |||
| Mechanism Description | Mechanistically, ACOT8 regulates cellular cholesterol ester (CE) levels, decreases the levels of phosphatidylethanolamines (PEs) that bind to polyunsaturated fatty acids and promote peroxisome activation. The knockdown of ACOT8 promotes ferroptosis and increases the chemosensitivity of tumors to GEM by inducing ferroptosis-associated pathway activation in PDAC cell lines. | |||
| Key Molecule: Acyl-CoA thioesterase 8 (ACOT8) | [23] | |||
| Metabolic Type | Lipid metabolism | |||
| Resistant Disease | Pancreatic ductal adenocarcinoma [ICD-11: 2C10.0] | |||
| Molecule Alteration | Expression | Up-regulation |
||
| Differential expression of the molecule in resistant disease | ||||
| Classification of Disease | Pancreatic cancer [ICD-11: 2C10] | |||
| The Specified Disease | Pancreatic ductal adenocarcinoma | |||
| The Studied Tissue | Pancreas | |||
| The Expression Level of Disease Section Compare with the Healthy Individual Tissue | p-value: 5.82E-14 Fold-change: 6.86E-01 Z-score: 8.55E+00 |
|||
| Experimental Note | Revealed Based on the Cell Line Data | |||
| In Vitro Model | AsPC1 cells | Pancreas | Homo sapiens (Human) | CVCL_0152 |
| MiaPaCa-2 cells | Blood | Homo sapiens (Human) | CVCL_0428 | |
| Panc1 cells | Pancreas | Homo sapiens (Human) | CVCL_0480 | |
| Experiment for Molecule Alteration |
Transcriptome sequencing and analysis | |||
| Experiment for Drug Resistance |
IC50 assay | |||
| Mechanism Description | Mechanistically, ACOT8 regulates cellular cholesterol ester (CE) levels, decreases the levels of phosphatidylethanolamines (PEs) that bind to polyunsaturated fatty acids and promote peroxisome activation. The knockdown of ACOT8 promotes ferroptosis and increases the chemosensitivity of tumors to GEM by inducing ferroptosis-associated pathway activation in PDAC cell lines. | |||
| Key Molecule: Transglutaminase 2 (TGM2) | [24] | |||
| Metabolic Type | Glutamine metabolism | |||
| Resistant Disease | Pancreatic ductal adenocarcinoma [ICD-11: 2C10.0] | |||
| Molecule Alteration | Expression | Up-regulation |
||
| Differential expression of the molecule in resistant disease | ||||
| Classification of Disease | Pancreatic cancer [ICD-11: 2C10] | |||
| The Specified Disease | Pancreatic ductal adenocarcinoma | |||
| The Studied Tissue | Pancreas | |||
| The Expression Level of Disease Section Compare with the Healthy Individual Tissue | p-value: 9.67E-17 Fold-change: 6.28E-01 Z-score: 9.67E+00 |
|||
| Experimental Note | Revealed Based on the Cell Line Data | |||
| In Vitro Model | Panc1 cells | Pancreas | Homo sapiens (Human) | CVCL_0480 |
| Patu-8988 cells | Pancreas | Homo sapiens (Human) | CVCL_1846 | |
| Experiment for Molecule Alteration |
qRT-PCR; Western blot analysis | |||
| Experiment for Drug Resistance |
IC50 assay | |||
| Mechanism Description | Functional and clinical verification revealed that a higher TGM2 expression is linked with a worse patient survival, an increased IC50 value of gemcitabine, and a higher abundance of tumor-infiltrating macrophages in pancreatic cancer. Mechanistically, we found that increased C-C motif chemokine ligand 2 (CCL2) release mediated by TGM2 contributes to macrophage infiltration into the tumor microenvironment. | |||
| Key Molecule: N-acylsphingosine amidohydrolase 2 (ASAH2) | [18] | |||
| Metabolic Type | Redox metabolism | |||
| Resistant Disease | Pancreatic ductal adenocarcinoma [ICD-11: 2C10.0] | |||
| Molecule Alteration | Expression | Up-regulation |
||
| Differential expression of the molecule in resistant disease | ||||
| Classification of Disease | Pancreatic cancer [ICD-11: 2C10] | |||
| The Specified Disease | Pancreatic ductal adenocarcinoma | |||
| The Studied Tissue | Pancreas | |||
| The Expression Level of Disease Section Compare with the Healthy Individual Tissue | p-value: 3.44E-01 Fold-change: 1.83E-01 Z-score: 9.68E-01 |
|||
| Experimental Note | Revealed Based on the Cell Line Data | |||
| In Vitro Model | Panc1 cells | Pancreas | Homo sapiens (Human) | CVCL_0480 |
| TB32048 cells | N.A. | Homo sapiens (Human) | N.A. | |
| Experiment for Molecule Alteration |
qRT-PCR; Western blot analysis | |||
| Experiment for Drug Resistance |
IC50 assay | |||
| Mechanism Description | Mechanistically, our proteomic analysis reveals a consistent up-regulation of sphingolipid metabolic enzyme ASAH2 and beta5-integrin expression in GemR pancreatic and lung cancer cells as well as stable beta5-integrin-expressing cells. | |||
| Key Molecule: Integrin beta-5 (ITGB5) | [18] | |||
| Metabolic Type | Redox metabolism | |||
| Resistant Disease | Pancreatic ductal adenocarcinoma [ICD-11: 2C10.0] | |||
| Molecule Alteration | Expression | Up-regulation |
||
| Differential expression of the molecule in resistant disease | ||||
| Classification of Disease | Pancreatic cancer [ICD-11: 2C10] | |||
| The Specified Disease | Pancreatic ductal adenocarcinoma | |||
| The Studied Tissue | Pancreas | |||
| The Expression Level of Disease Section Compare with the Healthy Individual Tissue | p-value: 1.91E-26 Fold-change: 7.66E-01 Z-score: 1.30E+01 |
|||
| Experimental Note | Revealed Based on the Cell Line Data | |||
| In Vitro Model | Panc1 cells | Pancreas | Homo sapiens (Human) | CVCL_0480 |
| TB32048 cells | N.A. | Homo sapiens (Human) | N.A. | |
| Experiment for Molecule Alteration |
qRT-PCR; Western blot analysis | |||
| Experiment for Drug Resistance |
IC50 assay | |||
| Mechanism Description | Mechanistically, our proteomic analysis reveals a consistent up-regulation of sphingolipid metabolic enzyme ASAH2 and beta5-integrin expression in GemR pancreatic and lung cancer cells as well as stable beta5-integrin-expressing cells. | |||
| Key Molecule: Acyl-CoA thioesterase 8 (ACOT8) | [23] | |||
| Metabolic Type | Lipid metabolism | |||
| Resistant Disease | Pancreatic ductal adenocarcinoma [ICD-11: 2C10.0] | |||
| Molecule Alteration | Expression | Up-regulation |
||
| Differential expression of the molecule in resistant disease | ||||
| Classification of Disease | Pancreatic cancer [ICD-11: 2C10] | |||
| The Specified Disease | Pancreatic ductal adenocarcinoma | |||
| The Studied Tissue | Pancreas | |||
| The Expression Level of Disease Section Compare with the Healthy Individual Tissue | p-value: 5.82E-14 Fold-change: 6.86E-01 Z-score: 8.55E+00 |
|||
| Experimental Note | Identified from the Human Clinical Data | |||
| In Vivo Model | Patient-derived PDAC organoids | Homo Sapiens | ||
| Experiment for Molecule Alteration |
Transcriptome sequencing and analysis | |||
| Experiment for Drug Resistance |
Tumor volume assay | |||
| Mechanism Description | Mechanistically, ACOT8 regulates cellular cholesterol ester (CE) levels, decreases the levels of phosphatidylethanolamines (PEs) that bind to polyunsaturated fatty acids and promote peroxisome activation. The knockdown of ACOT8 promotes ferroptosis and increases the chemosensitivity of tumors to GEM by inducing ferroptosis-associated pathway activation in PDAC cell lines. | |||
|
Irregularity in Drug Uptake and Drug Efflux (IDUE)
|
||||
| Key Molecule: Solute carrier family 29 member 1 (SLC29A1) | [25] | |||
| Resistant Disease | Pancreatic ductal adenocarcinoma [ICD-11: 2C10.0] | |||
| Molecule Alteration | Expression | Down-regulation |
||
| Differential expression of the molecule in resistant disease | ||||
| Classification of Disease | Pancreatic cancer [ICD-11: 2C10] | |||
| The Specified Disease | Pancreatic ductal adenocarcinoma | |||
| The Studied Tissue | Pancreas | |||
| The Expression Level of Disease Section Compare with the Healthy Individual Tissue | p-value: 4.44E-05 Fold-change: -6.19E-01 Z-score: -4.29E+00 |
|||
| Experimental Note | Identified from the Human Clinical Data | |||
| Mechanism Description | Gemcitabine could be a substrate for several nucleoside transporters (NTs), but its major uptake occurs via the equilibrative and concentrative type NTs (ENTs and CNTs, respectively). ENT1, CNT1 and CNT3 have often been related to gemcitabine transport and resistance in humans. When ENT1 knockout conferred gemcitabine resistance, while its up regulation enhanced its cytotoxic activity. Similarly, retroviral expression of CNT1 renders ovarian cancer cells sensitive to gemcitabine in vitro. | |||
| Key Molecule: Solute carrier family 28 member 1 (SLC28A1) | [25] | |||
| Resistant Disease | Pancreatic ductal adenocarcinoma [ICD-11: 2C10.0] | |||
| Molecule Alteration | Expression | Down-regulation |
||
| Differential expression of the molecule in resistant disease | ||||
| Classification of Disease | Pancreatic cancer [ICD-11: 2C10] | |||
| The Specified Disease | Pancreatic cancer | |||
| The Studied Tissue | Pancreas | |||
| The Expression Level of Disease Section Compare with the Healthy Individual Tissue | p-value: 2.99E-02 Fold-change: -5.93E-02 Z-score: -2.35E+00 |
|||
| Experimental Note | Identified from the Human Clinical Data | |||
| Mechanism Description | Gemcitabine could be a substrate for several nucleoside transporters (NTs), but its major uptake occurs via the equilibrative and concentrative type NTs (ENTs and CNTs, respectively). ENT1, CNT1 and CNT3 have often been related to gemcitabine transport and resistance in humans. When ENT1 knockout conferred gemcitabine resistance, while its up regulation enhanced its cytotoxic activity. Similarly, retroviral expression of CNT1 renders ovarian cancer cells sensitive to gemcitabine in vitro. | |||
| Key Molecule: Solute carrier family 28 member 3 (SLC28A3) | [25] | |||
| Resistant Disease | Pancreatic ductal adenocarcinoma [ICD-11: 2C10.0] | |||
| Molecule Alteration | Expression | Down-regulation |
||
| Differential expression of the molecule in resistant disease | ||||
| Classification of Disease | Pancreatic cancer [ICD-11: 2C10] | |||
| The Specified Disease | Pancreatic cancer | |||
| The Studied Tissue | Pancreas | |||
| The Expression Level of Disease Section Compare with the Healthy Individual Tissue | p-value: 2.43E-01 Fold-change: -8.82E-02 Z-score: -1.21E+00 |
|||
| Experimental Note | Identified from the Human Clinical Data | |||
| Mechanism Description | Gemcitabine could be a substrate for several nucleoside transporters (NTs), but its major uptake occurs via the equilibrative and concentrative type NTs (ENTs and CNTs, respectively). ENT1, CNT1 and CNT3 have often been related to gemcitabine transport and resistance in humans. When ENT1 knockout conferred gemcitabine resistance, while its up regulation enhanced its cytotoxic activity. Similarly, retroviral expression of CNT1 renders ovarian cancer cells sensitive to gemcitabine in vitro. | |||
|
Unusual Activation of Pro-survival Pathway (UAPP)
|
||||
| Key Molecule: DNA excision repair protein ERCC-1 (ERCC1) | [25] | |||
| Resistant Disease | Pancreatic ductal adenocarcinoma [ICD-11: 2C10.0] | |||
| Molecule Alteration | Expression | Up-regulation |
||
| Differential expression of the molecule in resistant disease | ||||
| Classification of Disease | Pancreatic cancer [ICD-11: 2C10] | |||
| The Specified Disease | Pancreatic ductal adenocarcinoma | |||
| The Studied Tissue | Pancreas | |||
| The Expression Level of Disease Section Compare with the Healthy Individual Tissue | p-value: 9.00E-04 Fold-change: 4.20E-01 Z-score: 3.43E+00 |
|||
| Experimental Note | Identified from the Human Clinical Data | |||
| Mechanism Description | Excision repair cross-complementation 1 (ERCC1) is a DNA repair endonuclease responsible for the incision of DNA cross-link-induced double-strand breaks. ERCC1 can repair gemcitabine-induced strand breaks, and its overexpression is well documented in poor gemcitabine responders. | |||
| Key Molecule: Protein salvador homolog 1 (SAV1) | [27] | |||
| Resistant Disease | Pancreatic cancer [ICD-11: 2C10.3] | |||
| Molecule Alteration | Expression | Down-regulation |
||
| Differential expression of the molecule in resistant disease | ||||
| Classification of Disease | Pancreatic cancer [ICD-11: 2C10] | |||
| The Specified Disease | Pancreatic cancer | |||
| The Studied Tissue | Pancreas | |||
| The Expression Level of Disease Section Compare with the Healthy Individual Tissue | p-value: 7.75E-14 Fold-change: -5.70E-01 Z-score: -8.32E+00 |
|||
| Experimental Note | Revealed Based on the Cell Line Data | |||
| Cell Pathway Regulation | Cell apoptosis | Inhibition | hsa04210 | |
| Hippo signaling pathway | Regulation | N.A. | ||
| In Vitro Model | BxPC-3 cells | Pancreas | Homo sapiens (Human) | CVCL_0186 |
| PANC-1 cells | Pancreas | Homo sapiens (Human) | CVCL_0480 | |
| Experiment for Molecule Alteration |
Western blot analysis | |||
| Experiment for Drug Resistance |
Flow cytometry assay | |||
| Mechanism Description | miR-181c directly repressed MST1, LATS2, MOB1 and SAV1 expression in human pancreatic cancer cells. Overexpression of miR-181c induced hyperactivation of the YAP/TAZ and (+) expression of the Hippo signaling downstream genes CTGF, BIRC5 and BLC2L1, leading to pancreatic cancer cell survival and chemoresistance in vitro and in vivo. Importantly, high miR-181c levels were significantly correlated with Hippo signaling inactivation in pancreatic cancer samples, and predicted a poor patient overall survival. | |||
| Key Molecule: Bromodomain-containing protein 4 (BRD4) | [32] | |||
| Resistant Disease | Pancreatic cancer [ICD-11: 2C10.3] | |||
| Molecule Alteration | Expression | Up-regulation |
||
| Differential expression of the molecule in resistant disease | ||||
| Classification of Disease | Pancreatic cancer [ICD-11: 2C10] | |||
| The Specified Disease | Pancreatic cancer | |||
| The Studied Tissue | Pancreas | |||
| The Expression Level of Disease Section Compare with the Healthy Individual Tissue | p-value: 1.83E-04 Fold-change: 1.13E-01 Z-score: 3.86E+00 |
|||
| Experimental Note | Revealed Based on the Cell Line Data | |||
| Cell Pathway Regulation | Cell apoptosis | Inhibition | hsa04210 | |
| Cell proliferation | Activation | hsa05200 | ||
| In Vitro Model | BxPC-3 cells | Pancreas | Homo sapiens (Human) | CVCL_0186 |
| MIA PaCa-2 cells | Pancreas | Homo sapiens (Human) | CVCL_0428 | |
| PANC-1 cells | Pancreas | Homo sapiens (Human) | CVCL_0480 | |
| Capan-1 cells | Pancreas | Homo sapiens (Human) | CVCL_0237 | |
| In Vivo Model | Nude mouse xenograft model | Mus musculus | ||
| Experiment for Molecule Alteration |
Luciferase reporter assay; Western blot analysis; RT-qPCR | |||
| Experiment for Drug Resistance |
MTT assay; Flow cytometry assay; Soft agar assay | |||
| Mechanism Description | Long non-coding RNA LINC00346 promotes pancreatic cancer growth and gemcitabine resistance by sponging miR-188-3p to derepress BRD4 expression. | |||
| Key Molecule: Homeobox protein Hox-A13 (HOXA13) | [35] | |||
| Resistant Disease | Pancreatic ductal adenocarcinoma [ICD-11: 2C10.0] | |||
| Molecule Alteration | Expression | Up-regulation |
||
| Differential expression of the molecule in resistant disease | ||||
| Classification of Disease | Pancreatic cancer [ICD-11: 2C10] | |||
| The Specified Disease | Pancreatic cancer | |||
| The Studied Tissue | Pancreas | |||
| The Expression Level of Disease Section Compare with the Healthy Individual Tissue | p-value: 1.13E-10 Fold-change: 2.33E-01 Z-score: 6.99E+00 |
|||
| Experimental Note | Revealed Based on the Cell Line Data | |||
| Cell Pathway Regulation | Cell invasion | Activation | hsa05200 | |
| Cell migration | Activation | hsa04670 | ||
| Cell proliferation | Activation | hsa05200 | ||
| HOTTIP/HOXA13 signaling pathway | Activation | hsa05202 | ||
| In Vitro Model | BxPC-3 cells | Pancreas | Homo sapiens (Human) | CVCL_0186 |
| MIA PaCa-2 cells | Pancreas | Homo sapiens (Human) | CVCL_0428 | |
| PANC-1 cells | Pancreas | Homo sapiens (Human) | CVCL_0480 | |
| Capan-2 cells | Pancreas | Homo sapiens (Human) | CVCL_0026 | |
| SW1990 cells | Pancreas | Homo sapiens (Human) | CVCL_1723 | |
| Experiment for Molecule Alteration |
Western blot analysis | |||
| Experiment for Drug Resistance |
CCK8 assay | |||
| Mechanism Description | The long non-coding RNA HOTTIP promotes progression and gemcitabine resistance by regulating HOXA13 in pancreatic cancer.Microarray analyses revealed that HOTTIP was one of the most significantly upregulated LncRNAs in PDAC tissues compared with pancreatic tissues.Furthermore, knockdown of HOXA13 by RNA interference (siHOXA13) revealed that HOTTIP promoted PDAC cell proliferation, invasion, and chemoresistance, at least partly through regulating HOXA13. As a crucial tumor promoter, HOTTIP promotes cell proliferation, invasion, and chemoresistance by modulating HOXA13. Therefore, the HOTTIP/HOXA13 axis is a potential therapeutic target and molecular biomarker for PDAC. | |||
| Key Molecule: SWI/SNF complex subunit SMARCC1 (SMARCC1) | [43] | |||
| Resistant Disease | Pancreatic cancer [ICD-11: 2C10.3] | |||
| Molecule Alteration | Expression | Down-regulation |
||
| Differential expression of the molecule in resistant disease | ||||
| Classification of Disease | Pancreatic cancer [ICD-11: 2C10] | |||
| The Specified Disease | Pancreatic cancer | |||
| The Studied Tissue | Pancreas | |||
| The Expression Level of Disease Section Compare with the Healthy Individual Tissue | p-value: 9.52E-01 Fold-change: -1.99E-03 Z-score: -6.16E-02 |
|||
| Experimental Note | Identified from the Human Clinical Data | |||
| Cell Pathway Regulation | Cell viability | Activation | hsa05200 | |
| In Vitro Model | MIA PaCa-2 cells | Pancreas | Homo sapiens (Human) | CVCL_0428 |
| PSN1 cells | Pancreas | Homo sapiens (Human) | CVCL_1644 | |
| Experiment for Molecule Alteration |
Western blot analysis | |||
| Experiment for Drug Resistance |
MTT assay | |||
| Mechanism Description | miR-320c regulates the resistance of pancreatic cancer cells to gemcitabine through SMARCC1. | |||
| Key Molecule: Tumor necrosis factor alpha-induced protein 3 (TNFAIP3) | [44] | |||
| Resistant Disease | Pancreatic cancer [ICD-11: 2C10.3] | |||
| Molecule Alteration | Expression | Down-regulation |
||
| Differential expression of the molecule in resistant disease | ||||
| Classification of Disease | Pancreatic cancer [ICD-11: 2C10] | |||
| The Specified Disease | Pancreatic cancer | |||
| The Studied Tissue | Pancreas | |||
| The Expression Level of Disease Section Compare with the Healthy Individual Tissue | p-value: 9.21E-01 Fold-change: -4.55E-03 Z-score: -1.00E-01 |
|||
| Experimental Note | Revealed Based on the Cell Line Data | |||
| Cell Pathway Regulation | Cell proliferation | Activation | hsa05200 | |
| In Vitro Model | HEK293T cells | Kidney | Homo sapiens (Human) | CVCL_0063 |
| SW1990 cells | Pancreas | Homo sapiens (Human) | CVCL_1723 | |
| In Vivo Model | Nude mouse xenograft model | Mus musculus | ||
| Experiment for Molecule Alteration |
Western blot analysis | |||
| Experiment for Drug Resistance |
CCK8 assay | |||
| Mechanism Description | miR-125a may promote chemo-resistance to gemcitabine in pancreatic cell lines through targeting A20, which may provide novel therapeutic targets or molecular biomarkers for cancer therapy and improve tumor diagnosis or predictions of therapeutic responses. | |||
| Key Molecule: Tumor necrosis factor ligand superfamily member 6 (FASLG) | [48] | |||
| Resistant Disease | Pancreatic cancer [ICD-11: 2C10.3] | |||
| Molecule Alteration | Expression | Down-regulation |
||
| Differential expression of the molecule in resistant disease | ||||
| Classification of Disease | Pancreatic cancer [ICD-11: 2C10] | |||
| The Specified Disease | Pancreatic cancer | |||
| The Studied Tissue | Pancreas | |||
| The Expression Level of Disease Section Compare with the Healthy Individual Tissue | p-value: 1.67E-01 Fold-change: -2.74E-02 Z-score: -1.43E+00 |
|||
| Experimental Note | Identified from the Human Clinical Data | |||
| Cell Pathway Regulation | Cell apoptosis | Inhibition | hsa04210 | |
| FasL/Fas signaling pathway | Inhibition | hsa04210 | ||
| In Vitro Model | BxPC-3 cells | Pancreas | Homo sapiens (Human) | CVCL_0186 |
| PANC-1 cells | Pancreas | Homo sapiens (Human) | CVCL_0480 | |
| In Vivo Model | BALB/c nude mouse xenograft model | Mus musculus | ||
| Experiment for Molecule Alteration |
Western blot analysis | |||
| Experiment for Drug Resistance |
WST-8 assay | |||
| Mechanism Description | Decreased Fas/FasL signaling mediates miR-21-induced chemoresistance in pancreatic cancer, over-expression of miR-21 reduced the endogenous expression of FasL anfd cause resistance to Gemcitabine. | |||
| Key Molecule: Phosphatase and tensin homolog (PTEN) | [8] | |||
| Resistant Disease | Pancreatic cancer [ICD-11: 2C10.3] | |||
| Molecule Alteration | Expression | Down-regulation |
||
| Differential expression of the molecule in resistant disease | ||||
| Classification of Disease | Pancreatic cancer [ICD-11: 2C10] | |||
| The Specified Disease | Pancreatic cancer | |||
| The Studied Tissue | Pancreas | |||
| The Expression Level of Disease Section Compare with the Healthy Individual Tissue | p-value: 1.32E-02 Fold-change: -3.94E-02 Z-score: -2.68E+00 |
|||
| Experimental Note | Identified from the Human Clinical Data | |||
| Cell Pathway Regulation | AKT signaling pathway | Activation | hsa04151 | |
| Cell apoptosis | Inhibition | hsa04210 | ||
| Cell proliferation | Activation | hsa05200 | ||
| In Vitro Model | LPc006 cells | Pancreas | Homo sapiens (Human) | N.A. |
| LPc028 cells | Pancreas | Homo sapiens (Human) | N.A. | |
| LPc033 cells | Pancreas | Homo sapiens (Human) | N.A. | |
| LPc067 cells | Pancreas | Homo sapiens (Human) | N.A. | |
| LPc111 cells | Pancreas | Homo sapiens (Human) | N.A. | |
| LPc167 cells | Pancreas | Homo sapiens (Human) | N.A. | |
| PP437 cells | Pancreas | Homo sapiens (Human) | N.A. | |
| Experiment for Molecule Alteration |
Western blot analysis | |||
| Experiment for Drug Resistance |
Fluorescence microscopy | |||
| Mechanism Description | miR-21 regulates expression of PTEN and phosphorylation of its downstream kinase Akt and (b) the reduction of phospho-Akt (pAkt) correlated with the enhancement of gemcitabine-induced apoptosis and antitumor activity in vitro and in vivo, suggesting that Akt pathway plays a significant role in mediating drug resistance in PDAC cells. | |||
|
Epigenetic Alteration of DNA, RNA or Protein (EADR)
|
||||
| Key Molecule: HOXA distal transcript antisense RNA (HOTTIP) | [35] | |||
| Resistant Disease | Pancreatic ductal adenocarcinoma [ICD-11: 2C10.0] | |||
| Molecule Alteration | Expression | Up-regulation |
||
| Differential expression of the molecule in resistant disease | ||||
| Classification of Disease | Pancreatic cancer [ICD-11: 2C10] | |||
| The Specified Disease | Pancreatic adenocarcinoma | |||
| The Studied Tissue | Pancreas | |||
| The Expression Level of Disease Section Compare with the Healthy Individual Tissue | p-value: 3.59E-10 Fold-change: 5.66E+00 Z-score: 6.75E+00 |
|||
| Experimental Note | Revealed Based on the Cell Line Data | |||
| Cell Pathway Regulation | Cell invasion | Activation | hsa05200 | |
| Cell migration | Activation | hsa04670 | ||
| Cell proliferation | Activation | hsa05200 | ||
| HOTTIP/HOXA13 signaling pathway | Activation | hsa05202 | ||
| In Vitro Model | BxPC-3 cells | Pancreas | Homo sapiens (Human) | CVCL_0186 |
| MIA PaCa-2 cells | Pancreas | Homo sapiens (Human) | CVCL_0428 | |
| PANC-1 cells | Pancreas | Homo sapiens (Human) | CVCL_0480 | |
| Capan-2 cells | Pancreas | Homo sapiens (Human) | CVCL_0026 | |
| SW1990 cells | Pancreas | Homo sapiens (Human) | CVCL_1723 | |
| Experiment for Molecule Alteration |
qPCR | |||
| Experiment for Drug Resistance |
CCK8 assay | |||
| Mechanism Description | The long non-coding RNA HOTTIP promotes progression and gemcitabine resistance by regulating HOXA13 in pancreatic cancer.Microarray analyses revealed that HOTTIP was one of the most significantly upregulated LncRNAs in PDAC tissues compared with pancreatic tissues.Furthermore, knockdown of HOXA13 by RNA interference (siHOXA13) revealed that HOTTIP promoted PDAC cell proliferation, invasion, and chemoresistance, at least partly through regulating HOXA13. As a crucial tumor promoter, HOTTIP promotes cell proliferation, invasion, and chemoresistance by modulating HOXA13. Therefore, the HOTTIP/HOXA13 axis is a potential therapeutic target and molecular biomarker for PDAC. | |||
| Key Molecule: Taurine up-regulated 1 (TUG1) | [36] | |||
| Resistant Disease | Pancreatic ductal adenocarcinoma [ICD-11: 2C10.0] | |||
| Molecule Alteration | Expression | Up-regulation |
||
| Differential expression of the molecule in resistant disease | ||||
| Classification of Disease | Pancreatic cancer [ICD-11: 2C10] | |||
| The Specified Disease | Pancreatic adenocarcinoma | |||
| The Studied Tissue | Pancreas | |||
| The Expression Level of Disease Section Compare with the Healthy Individual Tissue | p-value: 9.57E-23 Fold-change: 5.17E-01 Z-score: 1.06E+01 |
|||
| Experimental Note | Revealed Based on the Cell Line Data | |||
| Cell Pathway Regulation | Cell apoptosis | Inhibition | hsa04210 | |
| Cell colony | Activation | hsa05200 | ||
| Cell viability | Activation | hsa05200 | ||
| ERK signaling pathway | Activation | hsa04210 | ||
| In Vitro Model | BxPC-3 cells | Pancreas | Homo sapiens (Human) | CVCL_0186 |
| PANC-1 cells | Pancreas | Homo sapiens (Human) | CVCL_0480 | |
| SW1990 cells | Pancreas | Homo sapiens (Human) | CVCL_1723 | |
| PANC-28 cells | Pancreatic | Homo sapiens (Human) | CVCL_3917 | |
| Experiment for Molecule Alteration |
qRT-PCR | |||
| Experiment for Drug Resistance |
MTT assay | |||
| Mechanism Description | TUG1 promoted the viability of PDAC cells and enhanced its resistance of gemcitabine and overexpression of TUG1 increased ERk phosphorylation. | |||
| Key Molecule: P53 regulated carcinoma associated Stat3 activating long intergenic non-protein coding transcript (PRECSIT) | [32] | |||
| Resistant Disease | Pancreatic cancer [ICD-11: 2C10.3] | |||
| Molecule Alteration | Expression | Up-regulation |
||
| Differential expression of the molecule in resistant disease | ||||
| Classification of Disease | Pancreatic cancer [ICD-11: 2C10] | |||
| The Specified Disease | Pancreatic adenocarcinoma | |||
| The Studied Tissue | Pancreas | |||
| The Expression Level of Disease Section Compare with the Healthy Individual Tissue | p-value: 5.63E-31 Fold-change: 3.02E+00 Z-score: 1.41E+01 |
|||
| Experimental Note | Revealed Based on the Cell Line Data | |||
| Cell Pathway Regulation | Cell apoptosis | Inhibition | hsa04210 | |
| Cell proliferation | Activation | hsa05200 | ||
| In Vitro Model | BxPC-3 cells | Pancreas | Homo sapiens (Human) | CVCL_0186 |
| MIA PaCa-2 cells | Pancreas | Homo sapiens (Human) | CVCL_0428 | |
| PANC-1 cells | Pancreas | Homo sapiens (Human) | CVCL_0480 | |
| Capan-1 cells | Pancreas | Homo sapiens (Human) | CVCL_0237 | |
| In Vivo Model | Nude mouse xenograft model | Mus musculus | ||
| Experiment for Molecule Alteration |
qRT-PCR | |||
| Experiment for Drug Resistance |
MTT assay; Flow cytometry assay; Soft agar assay | |||
| Mechanism Description | Long non-coding RNA LINC00346 promotes pancreatic cancer growth and gemcitabine resistance by sponging miR-188-3p to derepress BRD4 expression. | |||
| Key Molecule: Maternally expressed 3 (MEG3) | [56] | |||
| Resistant Disease | Pancreatic cancer [ICD-11: 2C10.3] | |||
| Molecule Alteration | Expression | Down-regulation |
||
| Differential expression of the molecule in resistant disease | ||||
| Classification of Disease | Pancreatic cancer [ICD-11: 2C10] | |||
| The Specified Disease | Pancreatic adenocarcinoma | |||
| The Studied Tissue | Pancreas | |||
| The Expression Level of Disease Section Compare with the Healthy Individual Tissue | p-value: 1.44E-13 Fold-change: -2.89E+00 Z-score: -7.99E+00 |
|||
| Experimental Note | Identified from the Human Clinical Data | |||
| Cell Pathway Regulation | Cell apoptosis | Inhibition | hsa04210 | |
| Cell migration | Activation | hsa04670 | ||
| Cell proliferation | Activation | hsa05200 | ||
| In Vitro Model | BxPC-3 cells | Pancreas | Homo sapiens (Human) | CVCL_0186 |
| MIA PaCa-2 cells | Pancreas | Homo sapiens (Human) | CVCL_0428 | |
| PANC-1 cells | Pancreas | Homo sapiens (Human) | CVCL_0480 | |
| Capan-1 cells | Pancreas | Homo sapiens (Human) | CVCL_0237 | |
| AsPC-1 cells | Pancreas | Homo sapiens (Human) | CVCL_0152 | |
| SW1990 cells | Pancreas | Homo sapiens (Human) | CVCL_1723 | |
| COLO357 cells | Pancreas | Homo sapiens (Human) | CVCL_0221 | |
| T3M4 cells | Pancreas | Homo sapiens (Human) | CVCL_4056 | |
| HTERT-HPNE cells | Pancreas | Homo sapiens (Human) | CVCL_C466 | |
| Experiment for Molecule Alteration |
RT-qPCR | |||
| Experiment for Drug Resistance |
CCK8 assay; Boyden chamber assay; Sphere formation assay; Flow cytometric analysis | |||
| Mechanism Description | Decreased expression of MEG3 could promote PC cell migration and invasion, as well as chemoresistance by regulating the EMT process and CSC properties. | |||
|
Regulation by the Disease Microenvironment (RTDM)
|
||||
| Key Molecule: Mucin 4, cell surface associated (MUC4) | [25] | |||
| Resistant Disease | Pancreatic ductal adenocarcinoma [ICD-11: 2C10.0] | |||
| Molecule Alteration | Expression | Up-regulation |
||
| Differential expression of the molecule in resistant disease | ||||
| Classification of Disease | Pancreatic cancer [ICD-11: 2C10] | |||
| The Specified Disease | Pancreatic cancer | |||
| The Studied Tissue | Pancreas | |||
| The Expression Level of Disease Section Compare with the Healthy Individual Tissue | p-value: 2.87E-10 Fold-change: 2.03E-01 Z-score: 7.40E+00 |
|||
| Experimental Note | Identified from the Human Clinical Data | |||
| Mechanism Description | Mucin 4 (MUC4) is a membrane-bound O-glycoprotein that is found in the lining of the respiratory tract and GI mucosa, where it enables lubrication and cell-matrix detachment. In PDA, MUC4 expressing cells exhibit greater gemcitabine resistance than do MUC4 negative cells, an effect mediated by interaction with HER2. | |||
| Key Molecule: TIMP metallopeptidase inhibitor 2 (TIMP2) | [25] | |||
| Resistant Disease | Pancreatic ductal adenocarcinoma [ICD-11: 2C10.0] | |||
| Molecule Alteration | Expression | Up-regulation |
||
| Differential expression of the molecule in resistant disease | ||||
| Classification of Disease | Pancreatic cancer [ICD-11: 2C10] | |||
| The Specified Disease | Pancreatic cancer | |||
| The Studied Tissue | Pancreas | |||
| The Expression Level of Disease Section Compare with the Healthy Individual Tissue | p-value: 1.45E-03 Fold-change: 1.43E-01 Z-score: 3.74E+00 |
|||
| Experimental Note | Identified from the Human Clinical Data | |||
| Mechanism Description | The ECM may provide a mechanical barrier, preventing the tumor from further spread. Disintegration of the ECM by MMPs enables cancer cells to dissociate from the tumor and metastasize. Apart from destabilizing the physical barrier, MMPs overexpression also regulates internal cellular cascades. In response to collagen deposition in the ECM, an MMP dependent ERK-1/2 phosphorylation occurs, triggering the transcription factor HMGA2 and gemcitabine resistance. | |||
| Key Molecule: Transcription factor AP2 gamma (TFAP2C) | [46] | |||
| Resistant Disease | Pancreatic ductal adenocarcinoma [ICD-11: 2C10.0] | |||
| Molecule Alteration | Expression | Down-regulation |
||
| Differential expression of the molecule in resistant disease | ||||
| Classification of Disease | Pancreatic cancer [ICD-11: 2C10] | |||
| The Specified Disease | Pancreatic cancer | |||
| The Studied Tissue | Pancreas | |||
| The Expression Level of Disease Section Compare with the Healthy Individual Tissue | p-value: 7.42E-01 Fold-change: -1.25E-02 Z-score: -3.34E-01 |
|||
| Experimental Note | Revealed Based on the Cell Line Data | |||
| Cell Pathway Regulation | Cell apoptosis | Inhibition | hsa04210 | |
| Cell invasion | Activation | hsa05200 | ||
| Cell migration | Activation | hsa04670 | ||
| Cell viability | Activation | hsa05200 | ||
| In Vitro Model | BxPC-3 cells | Pancreas | Homo sapiens (Human) | CVCL_0186 |
| MIA PaCa-2 cells | Pancreas | Homo sapiens (Human) | CVCL_0428 | |
| PANC-1 cells | Pancreas | Homo sapiens (Human) | CVCL_0480 | |
| AsPC-1 cells | Pancreas | Homo sapiens (Human) | CVCL_0152 | |
| Su.86.86 cells | Pancreas | Homo sapiens (Human) | CVCL_3881 | |
| T3M4 cells | Pancreas | Homo sapiens (Human) | CVCL_4056 | |
| In Vivo Model | Nude mouse model | Mus musculus | ||
| Experiment for Molecule Alteration |
Western blot analysis | |||
| Experiment for Drug Resistance |
CCK8 assay; Flow cytometry assay; Transwell assay | |||
| Mechanism Description | Transcription factor activating protein 2 gamma (TFAP2C) is a target of miR-10a-5p, and TFAP2C overexpression resensitizes PDAC cells to gemcitabine, which is initiated by miR-10a-5p. | |||
| Drug Sensitivity Data Categorized by Their Corresponding Mechanisms | ||||
|
Unusual Activation of Pro-survival Pathway (UAPP)
|
||||
| Key Molecule: PI3-kinase regulatory subunit alpha (PIK3R1) | [26] | |||
| Sensitive Disease | Pancreatic cancer [ICD-11: 2C10.3] | |||
| Molecule Alteration | Expression | Up-regulation |
||
| Differential expression of the molecule in resistant disease | ||||
| Classification of Disease | Pancreatic cancer [ICD-11: 2C10] | |||
| The Specified Disease | Pancreatic cancer | |||
| The Studied Tissue | Pancreas | |||
| The Expression Level of Disease Section Compare with the Healthy Individual Tissue | p-value: 7.10E-06 Fold-change: 1.77E-01 Z-score: 4.72E+00 |
|||
| Experimental Note | Revealed Based on the Cell Line Data | |||
| Cell Pathway Regulation | PI3K/AKT signaling pathway | Inhibition | hsa04151 | |
| In Vitro Model | MIA PaCa-2 cells | Pancreas | Homo sapiens (Human) | CVCL_0428 |
| PANC-1 cells | Pancreas | Homo sapiens (Human) | CVCL_0480 | |
| Hs-578T cells | Breast | Homo sapiens (Human) | CVCL_0332 | |
| Experiment for Molecule Alteration |
Western blot analysis | |||
| Experiment for Drug Resistance |
MTT assay | |||
| Mechanism Description | Increased p85alpha expression in PDAC TCs results in decreased PI3k-AkT signaling and increased gemcitabine sensitivity. Expression of p85alpha inversely correlates with miR-21 levels in human PDAC. Overexpression of miR-21 results in decreased levels of p85alpha and increased PI3k-AkT activation. | |||
| Key Molecule: High mobility group protein HMGI-C (HMGA2) | [29], [30] | |||
| Sensitive Disease | Pancreatic cancer [ICD-11: 2C10.3] | |||
| Molecule Alteration | Expression | Up-regulation |
||
| Differential expression of the molecule in resistant disease | ||||
| Classification of Disease | Pancreatic cancer [ICD-11: 2C10] | |||
| The Specified Disease | Pancreatic cancer | |||
| The Studied Tissue | Pancreas | |||
| The Expression Level of Disease Section Compare with the Healthy Individual Tissue | p-value: 1.29E-11 Fold-change: 9.89E-01 Z-score: 7.21E+00 |
|||
| Experimental Note | Revealed Based on the Cell Line Data | |||
| Cell Pathway Regulation | CXCR4/let-7a/HMGA2 pathway | Regulation | N.A. | |
| In Vitro Model | HPDE6-C7 cells | Pancreas | Homo sapiens (Human) | CVCL_0P38 |
| In Vivo Model | Nude mouse xenograft model | Mus musculus | ||
| Experiment for Molecule Alteration |
qRT-PCR; Western blot analysis; Luciferase reporter assay | |||
| Experiment for Drug Resistance |
MTT assay; Transwell assay; Flow cytometric analysis | |||
| Mechanism Description | CXCR4/Let-7a axis regulates metastasis and chemoresistance of pancreatic cancer cells through targeting HMGA2. overexpression of HMGA2 restores cell proliferation, metastasis and chemosensitivity of gem inhibited by let-7a. | |||
| Key Molecule: Transforming protein RhoA (RHOA) | [31] | |||
| Sensitive Disease | Pancreatic cancer [ICD-11: 2C10.3] | |||
| Molecule Alteration | Expression | Down-regulation |
||
| Differential expression of the molecule in resistant disease | ||||
| Classification of Disease | Pancreatic cancer [ICD-11: 2C10] | |||
| The Specified Disease | Pancreatic cancer | |||
| The Studied Tissue | Pancreas | |||
| The Expression Level of Disease Section Compare with the Healthy Individual Tissue | p-value: 3.32E-04 Fold-change: -1.84E-01 Z-score: -3.66E+00 |
|||
| Experimental Note | Revealed Based on the Cell Line Data | |||
| Cell Pathway Regulation | Cell apoptosis | Activation | hsa04210 | |
| Cell proliferation | Inhibition | hsa05200 | ||
| In Vitro Model | BxPC-3 cells | Pancreas | Homo sapiens (Human) | CVCL_0186 |
| MIA PaCa-2 cells | Pancreas | Homo sapiens (Human) | CVCL_0428 | |
| PANC-1 cells | Pancreas | Homo sapiens (Human) | CVCL_0480 | |
| Capan-1 cells | Pancreas | Homo sapiens (Human) | CVCL_0237 | |
| AsPC-1 cells | Pancreas | Homo sapiens (Human) | CVCL_0152 | |
| SW1990 cells | Pancreas | Homo sapiens (Human) | CVCL_1723 | |
| Su.86.86 cells | Pancreas | Homo sapiens (Human) | CVCL_3881 | |
| In Vivo Model | Engrafted tumor mouse model | Mus musculus | ||
| Experiment for Molecule Alteration |
Western blot analysis; qRT-PCR; IHC analyses | |||
| Experiment for Drug Resistance |
CCK8 assay; Flow cytometry assay | |||
| Mechanism Description | RhoA inhibition leads to improved efficacy of gemcitabine in PC cells. | |||
| Key Molecule: F-box/WD repeat-containing protein 7 (FBXW7) | [33] | |||
| Sensitive Disease | Pancreatic cancer [ICD-11: 2C10.3] | |||
| Molecule Alteration | Expression | Up-regulation |
||
| Differential expression of the molecule in resistant disease | ||||
| Classification of Disease | Pancreatic cancer [ICD-11: 2C10] | |||
| The Specified Disease | Pancreatic cancer | |||
| The Studied Tissue | Pancreas | |||
| The Expression Level of Disease Section Compare with the Healthy Individual Tissue | p-value: 9.75E-01 Fold-change: 8.49E-04 Z-score: 3.18E-02 |
|||
| Experimental Note | Revealed Based on the Cell Line Data | |||
| Cell Pathway Regulation | Cell invasion | Inhibition | hsa05200 | |
| Cell migration | Inhibition | hsa04670 | ||
| Cell proliferation | Inhibition | hsa05200 | ||
| In Vitro Model | PANC-1 cells | Pancreas | Homo sapiens (Human) | CVCL_0480 |
| AsPC-1 cells | Pancreas | Homo sapiens (Human) | CVCL_0152 | |
| Experiment for Molecule Alteration |
Western blot analysis | |||
| Experiment for Drug Resistance |
MTT assay; Transwell migration and invasion assay | |||
| Mechanism Description | Down-regulation of miR-223 reverses epithelial-mesenchymal transition in gemcitabine-resistant pancreatic cancer cells due to down-regulation of its target Fbw7 and subsequent upregulation of Notch-1, which enhances GR cells to gemcitabine sensitivity. | |||
| Key Molecule: Cadherin-1 (CDH1) | [42] | |||
| Sensitive Disease | Pancreatic carcinoma [ICD-11: 2C10.2] | |||
| Molecule Alteration | Expression | Up-regulation |
||
| Differential expression of the molecule in resistant disease | ||||
| Classification of Disease | Pancreatic cancer [ICD-11: 2C10] | |||
| The Specified Disease | Pancreatic cancer | |||
| The Studied Tissue | Pancreas | |||
| The Expression Level of Disease Section Compare with the Healthy Individual Tissue | p-value: 3.75E-02 Fold-change: 1.34E-01 Z-score: 2.27E+00 |
|||
| Experimental Note | Revealed Based on the Cell Line Data | |||
| Cell Pathway Regulation | Cell apoptosis | Activation | hsa04210 | |
| Cell invasion | Inhibition | hsa05200 | ||
| Cell proliferation | Inhibition | hsa05200 | ||
| In Vitro Model | PANC-1 cells | Pancreas | Homo sapiens (Human) | CVCL_0480 |
| Capan-2 cells | Pancreas | Homo sapiens (Human) | CVCL_0026 | |
| Experiment for Molecule Alteration |
qRT-PCR | |||
| Experiment for Drug Resistance |
Colorimetric methylene blue assay; Flow cytometry assay | |||
| Mechanism Description | Forced expression of miR-200b induces CDH1 expression and promotes gemcitabine sensitivity in Capan-2 and Panc-1 cells. | |||
| Key Molecule: Ubiquitin carboxyl-terminal hydrolase 22 (USP22) | [47] | |||
| Sensitive Disease | Pancreatic cancer [ICD-11: 2C10.3] | |||
| Molecule Alteration | Expression | Down-regulation |
||
| Differential expression of the molecule in resistant disease | ||||
| Classification of Disease | Pancreatic cancer [ICD-11: 2C10] | |||
| The Specified Disease | Pancreatic cancer | |||
| The Studied Tissue | Pancreas | |||
| The Expression Level of Disease Section Compare with the Healthy Individual Tissue | p-value: 1.88E-01 Fold-change: -2.73E-02 Z-score: -1.37E+00 |
|||
| Experimental Note | Revealed Based on the Cell Line Data | |||
| Cell Pathway Regulation | Cell apoptosis | Activation | hsa04210 | |
| Cell colony | Inhibition | hsa05200 | ||
| Cell viability | Inhibition | hsa05200 | ||
| In Vitro Model | PANC-1 cells | Pancreas | Homo sapiens (Human) | CVCL_0480 |
| In Vivo Model | Nude mouse xenograft model | Mus musculus | ||
| Experiment for Molecule Alteration |
Western blot analysis; RIP assay; Luciferase reporter assay | |||
| Experiment for Drug Resistance |
MTT assay; Flow cytometry assay | |||
| Mechanism Description | miR-29c targets USP22 and suppresses autophagy-mediated chemoresistance in a xenograft tumor model in vivo. | |||
| Key Molecule: Zinc finger protein SNAI1 (SNAI1) | [49] | |||
| Sensitive Disease | Pancreatic cancer [ICD-11: 2C10.3] | |||
| Molecule Alteration | Expression | Down-regulation |
||
| Differential expression of the molecule in resistant disease | ||||
| Classification of Disease | Pancreatic cancer [ICD-11: 2C10] | |||
| The Specified Disease | Pancreatic cancer | |||
| The Studied Tissue | Pancreas | |||
| The Expression Level of Disease Section Compare with the Healthy Individual Tissue | p-value: 2.20E-01 Fold-change: -2.83E-02 Z-score: -1.27E+00 |
|||
| Experimental Note | Revealed Based on the Cell Line Data | |||
| Cell Pathway Regulation | Cell colony | Inhibition | hsa05200 | |
| Cell proliferation | Inhibition | hsa05200 | ||
| SNAI1/IRS1/AKT signaling pathway | Regulation | N.A. | ||
| In Vitro Model | BxPC-3 cells | Pancreas | Homo sapiens (Human) | CVCL_0186 |
| PANC-1 cells | Pancreas | Homo sapiens (Human) | CVCL_0480 | |
| SW1990 cells | Pancreas | Homo sapiens (Human) | CVCL_1723 | |
| In Vivo Model | BALB/c nude mouse xenograft model | Mus musculus | ||
| Experiment for Molecule Alteration |
Western blot analysis | |||
| Experiment for Drug Resistance |
MTS assay | |||
| Mechanism Description | miR-30a overexpression suppresses cell proliferation, and sensitizes pancreatic cancer cells to gemcitabine and miR-30a overexpression reduced IRS1 and SNAI1 protein level. | |||
| Key Molecule: Proto-oncogene tyrosine-protein kinase Src (SRC) | [31] | |||
| Sensitive Disease | Pancreatic cancer [ICD-11: 2C10.3] | |||
| Molecule Alteration | Expression | Down-regulation |
||
| Differential expression of the molecule in resistant disease | ||||
| Classification of Disease | Pancreatic cancer [ICD-11: 2C10] | |||
| The Specified Disease | Pancreatic cancer | |||
| The Studied Tissue | Pancreas | |||
| The Expression Level of Disease Section Compare with the Healthy Individual Tissue | p-value: 2.61E-01 Fold-change: -3.44E-02 Z-score: -1.17E+00 |
|||
| Experimental Note | Revealed Based on the Cell Line Data | |||
| Cell Pathway Regulation | Cell apoptosis | Activation | hsa04210 | |
| Cell proliferation | Inhibition | hsa05200 | ||
| In Vitro Model | BxPC-3 cells | Pancreas | Homo sapiens (Human) | CVCL_0186 |
| MIA PaCa-2 cells | Pancreas | Homo sapiens (Human) | CVCL_0428 | |
| PANC-1 cells | Pancreas | Homo sapiens (Human) | CVCL_0480 | |
| Capan-1 cells | Pancreas | Homo sapiens (Human) | CVCL_0237 | |
| AsPC-1 cells | Pancreas | Homo sapiens (Human) | CVCL_0152 | |
| SW1990 cells | Pancreas | Homo sapiens (Human) | CVCL_1723 | |
| Su.86.86 cells | Pancreas | Homo sapiens (Human) | CVCL_3881 | |
| In Vivo Model | Engrafted tumor mouse model | Mus musculus | ||
| Experiment for Molecule Alteration |
Western blot analysis; qRT-PCR; IHC analyses | |||
| Experiment for Drug Resistance |
CCK8 assay; Flow cytometry assay | |||
| Mechanism Description | SRC inhibition leads to improved efficacy of gemcitabine in PC cells. | |||
| Key Molecule: Ribosomal protein S6 kinase beta-1 (RPS6KB1) | [50] | |||
| Sensitive Disease | Pancreatic adenocarcinoma [ICD-11: 2C10.4] | |||
| Molecule Alteration | Expression | Down-regulation |
||
| Differential expression of the molecule in resistant disease | ||||
| Classification of Disease | Pancreatic cancer [ICD-11: 2C10] | |||
| The Specified Disease | Pancreatic cancer | |||
| The Studied Tissue | Pancreas | |||
| The Expression Level of Disease Section Compare with the Healthy Individual Tissue | p-value: 1.88E-02 Fold-change: -4.06E-02 Z-score: -2.54E+00 |
|||
| Experimental Note | Revealed Based on the Cell Line Data | |||
| In Vitro Model | BxPC-3 cells | Pancreas | Homo sapiens (Human) | CVCL_0186 |
| PANC-1 cells | Pancreas | Homo sapiens (Human) | CVCL_0480 | |
| Experiment for Molecule Alteration |
Western blot analysis | |||
| Experiment for Drug Resistance |
CCK8 assay; Transwell migration assay | |||
| Mechanism Description | miRNA-145 increases therapeutic sensibility to gemcitabine treatment of pancreatic adenocarcinoma cells, miR145 negatively regulated p70S6k1 expression at the posttranscriptional level in colon cancer. | |||
| Key Molecule: Apoptosis regulator Bcl-2 (BCL2) | [51] | |||
| Sensitive Disease | Pancreatic ductal adenocarcinoma [ICD-11: 2C10.0] | |||
| Molecule Alteration | Expression | Down-regulation |
||
| Differential expression of the molecule in resistant disease | ||||
| Classification of Disease | Pancreatic cancer [ICD-11: 2C10] | |||
| The Specified Disease | Pancreatic cancer | |||
| The Studied Tissue | Pancreas | |||
| The Expression Level of Disease Section Compare with the Healthy Individual Tissue | p-value: 1.85E-02 Fold-change: -5.33E-02 Z-score: -2.60E+00 |
|||
| Experimental Note | Revealed Based on the Cell Line Data | |||
| Cell Pathway Regulation | Cell apoptosis | Activation | hsa04210 | |
| In Vitro Model | SW1990 cells | Pancreas | Homo sapiens (Human) | CVCL_1723 |
| CFPAC1 cells | Pancreas | Homo sapiens (Human) | CVCL_1119 | |
| In Vivo Model | BALB/c nude mouse xenograft model | Mus musculus | ||
| Experiment for Molecule Alteration |
Western blot analysis | |||
| Experiment for Drug Resistance |
MTT assay | |||
| Mechanism Description | BCL-2 facilitates cell survival against chemotherapy via the blockage of Bax/Bak-induced apoptosis, miRNA-181b sensitizes PDAC cells to gemcitabine by targeting BCL-2. | |||
| Key Molecule: G1/S-specific cyclin-D2 (CCND2) | [54] | |||
| Sensitive Disease | Pancreatic carcinoma [ICD-11: 2C10.2] | |||
| Molecule Alteration | Expression | Down-regulation |
||
| Differential expression of the molecule in resistant disease | ||||
| Classification of Disease | Pancreatic cancer [ICD-11: 2C10] | |||
| The Specified Disease | Pancreatic cancer | |||
| The Studied Tissue | Pancreas | |||
| The Expression Level of Disease Section Compare with the Healthy Individual Tissue | p-value: 9.56E-06 Fold-change: -2.36E-01 Z-score: -6.19E+00 |
|||
| Experimental Note | Revealed Based on the Cell Line Data | |||
| Cell Pathway Regulation | Cell apoptosis | Activation | hsa04210 | |
| Cell invasion | Inhibition | hsa05200 | ||
| Cell migration | Inhibition | hsa04670 | ||
| Cell viability | Inhibition | hsa05200 | ||
| In Vitro Model | PANC-1 cells | Pancreas | Homo sapiens (Human) | CVCL_0480 |
| Experiment for Molecule Alteration |
Western blot analysis | |||
| Experiment for Drug Resistance |
MTT assay; Flow cytometry assay | |||
| Mechanism Description | miR-373-3p enhances the chemosensitivity of gemcitabine through cell cycle pathway by downregulating CCND2 in pancreatic carcinoma cells. | |||
|
Epigenetic Alteration of DNA, RNA or Protein (EADR)
|
||||
| Key Molecule: Programmed cell death protein 4 (PDCD4) | [28] | |||
| Sensitive Disease | Pancreatic ductal adenocarcinoma [ICD-11: 2C10.0] | |||
| Molecule Alteration | Expression | Down-regulation |
||
| Differential expression of the molecule in resistant disease | ||||
| Classification of Disease | Pancreatic cancer [ICD-11: 2C10] | |||
| The Specified Disease | Pancreatic ductal adenocarcinoma | |||
| The Studied Tissue | Pancreas | |||
| The Expression Level of Disease Section Compare with the Healthy Individual Tissue | p-value: 2.18E-33 Fold-change: -1.18E+00 Z-score: -1.75E+01 |
|||
| Experimental Note | Identified from the Human Clinical Data | |||
| In Vitro Model | MIA PaCa-2 cells | Pancreas | Homo sapiens (Human) | CVCL_0428 |
| Panc02 cells | Pancreas | Homo sapiens (Human) | CVCL_D627 | |
| In Vivo Model | Mouse xenograft model | Mus musculus | ||
| Experiment for Molecule Alteration |
qRT-PCR; Immunofluorescence (IF) staining | |||
| Experiment for Drug Resistance |
Costar Transwell Invasion Assay; | |||
| Mechanism Description | Upregulating miR21 in CAFs promoted PDAC desmoplasia and increased its drug resistance to gemcitabine treatment by promoting the activation of cancer-associated fibroblasts (CAFs). miR21 mediates activation of CAFs via down-regulating PDCD4. | |||
| Key Molecule: CXC chemokine receptor type 4 (CXCR4) | [30] | |||
| Sensitive Disease | Pancreatic cancer [ICD-11: 2C10.3] | |||
| Molecule Alteration | Expression | Up-regulation |
||
| Differential expression of the molecule in resistant disease | ||||
| Classification of Disease | Pancreatic cancer [ICD-11: 2C10] | |||
| The Specified Disease | Pancreatic cancer | |||
| The Studied Tissue | Pancreas | |||
| The Expression Level of Disease Section Compare with the Healthy Individual Tissue | p-value: 6.90E-02 Fold-change: 1.57E-01 Z-score: 1.95E+00 |
|||
| Experimental Note | Revealed Based on the Cell Line Data | |||
| Cell Pathway Regulation | CXCR4/let-7a/HMGA2 pathway | Regulation | N.A. | |
| In Vitro Model | HPDE6-C7 cells | Pancreas | Homo sapiens (Human) | CVCL_0P38 |
| In Vivo Model | Nude mouse xenograft model | Mus musculus | ||
| Experiment for Molecule Alteration |
qRT-PCR | |||
| Experiment for Drug Resistance |
MTT assay; Transwell assay; Flow cytometric analysis | |||
| Mechanism Description | CXCR4/Let-7a axis regulates metastasis and chemoresistance of pancreatic cancer cells through targeting HMGA2. overexpression of HMGA2 restores cell proliferation, metastasis and chemosensitivity of gem inhibited by let-7a. | |||
|
Regulation by the Disease Microenvironment (RTDM)
|
||||
| Key Molecule: Mothers against decapentaplegic homolog 4 (SMAD4) | [29] | |||
| Sensitive Disease | Pancreatic cancer [ICD-11: 2C10.3] | |||
| Molecule Alteration | Expression | Down-regulation |
||
| Differential expression of the molecule in resistant disease | ||||
| Classification of Disease | Pancreatic cancer [ICD-11: 2C10] | |||
| The Specified Disease | Pancreatic cancer | |||
| The Studied Tissue | Pancreas | |||
| The Expression Level of Disease Section Compare with the Healthy Individual Tissue | p-value: 1.67E-03 Fold-change: -1.32E-01 Z-score: -3.22E+00 |
|||
| Experimental Note | Revealed Based on the Cell Line Data | |||
| Cell Pathway Regulation | Cell invasion | Inhibition | hsa05200 | |
| Cell migration | Inhibition | hsa04670 | ||
| Epithelial mesenchymal transition signaling pathway | Inhibition | hsa01521 | ||
| TGF-beta signaling pathway | Inhibition | hsa04350 | ||
| In Vitro Model | MDA-MB-231 cells | Breast | Homo sapiens (Human) | CVCL_0062 |
| BxPC-3 cells | Pancreas | Homo sapiens (Human) | CVCL_0186 | |
| Su.86.86 cells | Pancreas | Homo sapiens (Human) | CVCL_3881 | |
| CFPAC1 cells | Pancreas | Homo sapiens (Human) | CVCL_1119 | |
| KMP3 cells | Pancreas | Homo sapiens (Human) | CVCL_8491 | |
| KP4-4 cells | Pancreas | Homo sapiens (Human) | CVCL_Y142 | |
| Panc1 cells | Pancreas | Homo sapiens (Human) | CVCL_0480 | |
| Experiment for Molecule Alteration |
Western blot analysis | |||
| Experiment for Drug Resistance |
WST-8 assay; Crystal violet staining assay | |||
| Mechanism Description | Overexpression of miR509-5p and miR1243 increased the expression of E-cadherin through the suppression of EMT-related gene expression and that drug sensitivity increased with a combination of each of these miRNAs and gemcitabine. miR1243 directly regulated SMAD2 and SMAD4, which regulate the TGF-beta signaling pathway, resulting in an induction of the MET phenotype. Suppressing SMADs reduced the effect of TGF-beta. | |||
| Key Molecule: Mothers against decapentaplegic homolog 2 (SMAD2) | [29] | |||
| Sensitive Disease | Pancreatic cancer [ICD-11: 2C10.3] | |||
| Molecule Alteration | Expression | Down-regulation |
||
| Differential expression of the molecule in resistant disease | ||||
| Classification of Disease | Pancreatic cancer [ICD-11: 2C10] | |||
| The Specified Disease | Pancreatic cancer | |||
| The Studied Tissue | Pancreas | |||
| The Expression Level of Disease Section Compare with the Healthy Individual Tissue | p-value: 4.92E-02 Fold-change: -6.54E-02 Z-score: -1.99E+00 |
|||
| Experimental Note | Revealed Based on the Cell Line Data | |||
| Cell Pathway Regulation | Cell invasion | Inhibition | hsa05200 | |
| Cell migration | Inhibition | hsa04670 | ||
| Epithelial mesenchymal transition signaling pathway | Inhibition | hsa01521 | ||
| TGF-beta signaling pathway | Inhibition | hsa04350 | ||
| In Vitro Model | MDA-MB-231 cells | Breast | Homo sapiens (Human) | CVCL_0062 |
| BxPC-3 cells | Pancreas | Homo sapiens (Human) | CVCL_0186 | |
| Su.86.86 cells | Pancreas | Homo sapiens (Human) | CVCL_3881 | |
| CFPAC1 cells | Pancreas | Homo sapiens (Human) | CVCL_1119 | |
| KMP3 cells | Pancreas | Homo sapiens (Human) | CVCL_8491 | |
| KP4-4 cells | Pancreas | Homo sapiens (Human) | CVCL_Y142 | |
| Panc1 cells | Pancreas | Homo sapiens (Human) | CVCL_0480 | |
| Experiment for Molecule Alteration |
Western blot analysis | |||
| Experiment for Drug Resistance |
WST-8 assay; Crystal violet staining assay | |||
| Mechanism Description | Overexpression of miR509-5p and miR1243 increased the expression of E-cadherin through the suppression of EMT-related gene expression and that drug sensitivity increased with a combination of each of these miRNAs and gemcitabine. miR1243 directly regulated SMAD2 and SMAD4, which regulate the TGF-beta signaling pathway, resulting in an induction of the MET phenotype. Suppressing SMADs reduced the effect of TGF-beta. | |||
| Key Molecule: Suppressor of cytokine signaling 3 (SOCS3) | [37] | |||
| Sensitive Disease | Pancreatic cancer [ICD-11: 2C10.3] | |||
| Molecule Alteration | Expression | Up-regulation |
||
| Differential expression of the molecule in resistant disease | ||||
| Classification of Disease | Pancreatic cancer [ICD-11: 2C10] | |||
| The Specified Disease | Pancreatic cancer | |||
| The Studied Tissue | Pancreas | |||
| The Expression Level of Disease Section Compare with the Healthy Individual Tissue | p-value: 9.08E-01 Fold-change: 4.36E-03 Z-score: 1.17E-01 |
|||
| Experimental Note | Revealed Based on the Cell Line Data | |||
| Cell Pathway Regulation | Cell apoptosis | Activation | hsa04210 | |
| Cell migration | Inhibition | hsa04670 | ||
| Cell proliferation | Inhibition | hsa05200 | ||
| miR221/SOCS3 signaling pathway | Regulation | N.A. | ||
| In Vitro Model | BxPC-3 cells | Pancreas | Homo sapiens (Human) | CVCL_0186 |
| PANC-1 cells | Pancreas | Homo sapiens (Human) | CVCL_0480 | |
| Capan-2 cells | Pancreas | Homo sapiens (Human) | CVCL_0026 | |
| AsPC-1 cells | Pancreas | Homo sapiens (Human) | CVCL_0152 | |
| SW1990 cells | Pancreas | Homo sapiens (Human) | CVCL_1723 | |
| Experiment for Molecule Alteration |
Western blot analysis; RT-qPCR | |||
| Experiment for Drug Resistance |
CCK8 assay; Flow cytometry assay | |||
| Mechanism Description | SOCS3 overexpression reverses miR-221 overexpression-induced proliferation, migration, emt, chemotherapy resistance, and stem cell-like properties in panc-1 cells. | |||
| Key Molecule: Rho-related GTP-binding protein RhoF (RHOF) | [41] | |||
| Sensitive Disease | Pancreatic cancer [ICD-11: 2C10.3] | |||
| Molecule Alteration | Expression | Up-regulation |
||
| Differential expression of the molecule in resistant disease | ||||
| Classification of Disease | Pancreatic cancer [ICD-11: 2C10] | |||
| The Specified Disease | Pancreatic cancer | |||
| The Studied Tissue | Pancreas | |||
| The Expression Level of Disease Section Compare with the Healthy Individual Tissue | p-value: 6.02E-01 Fold-change: 1.63E-02 Z-score: 5.31E-01 |
|||
| Experimental Note | Revealed Based on the Cell Line Data | |||
| Cell Pathway Regulation | Epithelial mesenchymal transition signaling pathway | Activation | hsa01521 | |
| In Vitro Model | BxPC-3 cells | Pancreas | Homo sapiens (Human) | CVCL_0186 |
| PANC-1 cells | Pancreas | Homo sapiens (Human) | CVCL_0480 | |
| Capan-2 cells | Pancreas | Homo sapiens (Human) | CVCL_0026 | |
| AsPC-1 cells | Pancreas | Homo sapiens (Human) | CVCL_0152 | |
| SW1990 cells | Pancreas | Homo sapiens (Human) | CVCL_1723 | |
| HPDE6-C7 cells | Pancreas | Homo sapiens (Human) | CVCL_0P38 | |
| HTERT-HPNE cells | Pancreas | Homo sapiens (Human) | CVCL_C466 | |
| PATU8988 cells | Pancreas | Homo sapiens (Human) | CVCL_1846 | |
| CFPAC1 cells | Pancreas | Homo sapiens (Human) | CVCL_1119 | |
| HPAC cells | Pancreas | Homo sapiens (Human) | CVCL_3517 | |
| In Vivo Model | Nude mouse xenograft model | Mus musculus | ||
| Experiment for Molecule Alteration |
Western blot analysis; Dual luciferase reporter assay | |||
| Experiment for Drug Resistance |
MTS assay | |||
| Mechanism Description | miR3656 expression enhances the chemosensitivity of pancreatic cancer to gemcitabine through modulation of the RHOF/EMT axis. miR3656 could target RHOF, a member of the Rho subfamily of small GTPases, and regulate the EMT process, enforced EMT progression via TWIST1 overexpression compromised the chemotherapy-enhancing effects of miR3656. Reduced miR3656 expression levels activated the EMT pathway through upregulation of RHOF, eventually causing drug resistance. | |||
| Drug Resistance Data Categorized by Their Corresponding Mechanisms | ||||
|
Regulation by the Disease Microenvironment (RTDM)
|
||||
| Key Molecule: Transcription factor SOX-2 (SOX2) | [34] | |||
| Resistant Disease | Bladder urothelial carcinoma [ICD-11: 2C94.2] | |||
| Molecule Alteration | Expression | Up-regulation |
||
| Differential expression of the molecule in resistant disease | ||||
| Classification of Disease | Bladder cancer [ICD-11: 2C94] | |||
| The Specified Disease | Bladder cancer | |||
| The Studied Tissue | Bladder tissue | |||
| The Expression Level of Disease Section Compare with the Healthy Individual Tissue | p-value: 5.57E-02 Fold-change: 6.55E-02 Z-score: 2.25E+00 |
|||
| Experimental Note | Identified from the Human Clinical Data | |||
| In Vitro Model | 5637 cells | Bladder | Homo sapiens (Human) | CVCL_0126 |
| J82 cells | Bladder | Homo sapiens (Human) | CVCL_0359 | |
| T24 cells | Bladder | Homo sapiens (Human) | CVCL_0554 | |
| BFTC 909 cells | Kidney | Homo sapiens (Human) | CVCL_1084 | |
| BFTC 905 cells | Urinary bladder | Homo sapiens (Human) | CVCL_1083 | |
| HT-1376 cells | Urinary bladder | Homo sapiens (Human) | CVCL_1292 | |
| SCaBER cells | Urinary bladder | Homo sapiens (Human) | CVCL_3599 | |
| RT-4 cells | Urinary bladder | Homo sapiens (Human) | CVCL_0036 | |
| UM-UC3 cells | Urinary bladder | Homo sapiens (Human) | CVCL_1783 | |
| In Vivo Model | Athymic (nu+/nu+) mouse xenograft model; NOD/SCID/IL2Rgamma -/- mouse xenograft model | Mus musculus | ||
| Experiment for Molecule Alteration |
Western blotting assay | |||
| Mechanism Description | Chemotherapy-induced COX2 and YAP1 signaling may promote CSC expansion via SOX2 overexpression and subsequent chemotherapy resistance.The YAP1-SOX2 axis, via re-activated PI3K/AKT signaling, may also be relevant to an acquired resistance to the EGFR inhibitor, as demonstrated by our findings that the resistant tumors again became sensitive to the EGFR inhibitor in combination with the YAP1 inhibitor. | |||
|
Epigenetic Alteration of DNA, RNA or Protein (EADR)
|
||||
| Key Molecule: Golgi phosphoprotein 3 (GOLPH3) | [39] | |||
| Resistant Disease | Bladder urothelial carcinoma [ICD-11: 2C94.2] | |||
| Molecule Alteration | Expression | Up-regulation |
||
| Differential expression of the molecule in resistant disease | ||||
| Classification of Disease | Bladder cancer [ICD-11: 2C94] | |||
| The Specified Disease | Bladder cancer | |||
| The Studied Tissue | Bladder tissue | |||
| The Expression Level of Disease Section Compare with the Healthy Individual Tissue | p-value: 6.26E-02 Fold-change: 2.58E-02 Z-score: 2.04E+00 |
|||
| Experimental Note | Identified from the Human Clinical Data | |||
| In Vitro Model | 5637 cells | Bladder | Homo sapiens (Human) | CVCL_0126 |
| T24 cells | Bladder | Homo sapiens (Human) | CVCL_0554 | |
| In Vivo Model | BALB/c nude mouse xenograft model | Mus musculus | ||
| Experiment for Molecule Alteration |
qRT-PCR; Western blotting assay | |||
| Experiment for Drug Resistance |
CCK8 assay | |||
| Mechanism Description | The expression levels of miR34a were decreased and GOLPH3 were increased in GC chemoresistant UBC cell lines. Down-regulation of miR34a resulted in the overexpression of GOLPH3.The ectopic expression of miR34a decreased the stem cell properties of chemoresistant UBC cells and re-sensitized these cells to GC treatment in vitro and in vivo. | |||
|
Unusual Activation of Pro-survival Pathway (UAPP)
|
||||
| Key Molecule: Cyclin-dependent kinase inhibitor 1B (CDKN1B) | [2] | |||
| Resistant Disease | Bladder cancer [ICD-11: 2C94.0] | |||
| Molecule Alteration | Expression | Down-regulation |
||
| Differential expression of the molecule in resistant disease | ||||
| Classification of Disease | Bladder cancer [ICD-11: 2C94] | |||
| The Specified Disease | Bladder cancer | |||
| The Studied Tissue | Bladder tissue | |||
| The Expression Level of Disease Section Compare with the Healthy Individual Tissue | p-value: 2.05E-07 Fold-change: -1.46E-01 Z-score: -9.14E+00 |
|||
| Experimental Note | Identified from the Human Clinical Data | |||
| In Vitro Model | 5637 cells | Bladder | Homo sapiens (Human) | CVCL_0126 |
| UMUC-2 cells | Bladder | Homo sapiens (Human) | CVCL_8155 | |
| In Vivo Model | Nude mouse xenograft model | Mus musculus | ||
| Experiment for Molecule Alteration |
Western blot analysis | |||
| Experiment for Drug Resistance |
Annexin V-FITC/PI Apoptosis assay | |||
| Mechanism Description | miR196a-5p is involved in UCA1-mediated cisplatin/gemcitabine resistance via targeting p27kip1. | |||
| Drug Sensitivity Data Categorized by Their Corresponding Mechanisms | ||||
|
Unusual Activation of Pro-survival Pathway (UAPP)
|
||||
| Key Molecule: Insulin-like growth factor 1 receptor (IGF1R) | [53] | |||
| Sensitive Disease | Bladder cancer [ICD-11: 2C94.0] | |||
| Molecule Alteration | Expression | Down-regulation |
||
| Differential expression of the molecule in resistant disease | ||||
| Classification of Disease | Bladder cancer [ICD-11: 2C94] | |||
| The Specified Disease | Bladder cancer | |||
| The Studied Tissue | Bladder tissue | |||
| The Expression Level of Disease Section Compare with the Healthy Individual Tissue | p-value: 1.52E-07 Fold-change: -1.89E-01 Z-score: -9.27E+00 |
|||
| Experimental Note | Revealed Based on the Cell Line Data | |||
| Cell Pathway Regulation | Cell proliferation | Inhibition | hsa05200 | |
| IGF1R signaling pathway | Inhibition | hsa05200 | ||
| MAPK sigaling pathway | Inhibition | hsahsa04 | ||
| PI3K/AKT signaling pathway | Inhibition | hsa04151 | ||
| In Vitro Model | 5637 cells | Bladder | Homo sapiens (Human) | CVCL_0126 |
| SV-HUC-1 cells | Bladder | Homo sapiens (Human) | CVCL_3798 | |
| T24 cells | Bladder | Homo sapiens (Human) | CVCL_0554 | |
| Experiment for Molecule Alteration |
Western blot analysis | |||
| Experiment for Drug Resistance |
CCK8 assay | |||
| Mechanism Description | miR143 inhibits bladder cancer cell proliferation and enhances their sensitivity to gemcitabine by repressing IGF-1R signaling. Down-regulation of miR143 in bladder cancer may be involved in tumor development via the activation of IGF-1R and other downstream pathways like PI3k/Akt and MAPk. | |||
| Key Molecule: Protein Wnt-5a (WNT5A) | [55] | |||
| Sensitive Disease | Bladder cancer [ICD-11: 2C94.0] | |||
| Molecule Alteration | Expression | Down-regulation |
||
| Differential expression of the molecule in resistant disease | ||||
| Classification of Disease | Bladder cancer [ICD-11: 2C94] | |||
| The Specified Disease | Bladder cancer | |||
| The Studied Tissue | Bladder tissue | |||
| The Expression Level of Disease Section Compare with the Healthy Individual Tissue | p-value: 4.79E-05 Fold-change: -2.79E-01 Z-score: -6.68E+00 |
|||
| Experimental Note | Revealed Based on the Cell Line Data | |||
| Cell Pathway Regulation | Cell apoptosis | Activation | hsa04210 | |
| Cell viability | Inhibition | hsa05200 | ||
| In Vitro Model | SW780 cells | Bladder | Homo sapiens (Human) | CVCL_1728 |
| UM-UC-3 cells | Bladder | Homo sapiens (Human) | CVCL_1783 | |
| Experiment for Molecule Alteration |
Western blot analysis | |||
| Experiment for Drug Resistance |
MTT assay; Flow cytometry assay | |||
| Mechanism Description | miR-129-5p inhibits gemcitabine resistance and promotes cell apoptosis of bladder cancer cells by downregulating Wnt5a. | |||
| Drug Sensitivity Data Categorized by Their Corresponding Mechanisms | ||||
|
Unusual Activation of Pro-survival Pathway (UAPP)
|
||||
| Key Molecule: Deoxycytidine kinase (DCK) | [38] | |||
| Sensitive Disease | Colon cancer [ICD-11: 2B90.1] | |||
| Molecule Alteration | Expression | Up-regulation |
||
| Differential expression of the molecule in resistant disease | ||||
| Classification of Disease | Colon cancer [ICD-11: 2B90] | |||
| The Specified Disease | Colon cancer | |||
| The Studied Tissue | Colon tissue | |||
| The Expression Level of Disease Section Compare with the Healthy Individual Tissue | p-value: 1.10E-05 Fold-change: 3.16E-02 Z-score: 4.49E+00 |
|||
| Experimental Note | Revealed Based on the Cell Line Data | |||
| In Vitro Model | HT-29 cells | Colon | Homo sapiens (Human) | CVCL_0320 |
| Colo320 cells | Colon | Homo sapiens (Human) | CVCL_1989 | |
| WiDR cells | Colon | Homo sapiens (Human) | CVCL_2760 | |
| Experiment for Molecule Alteration |
qRT -PCR | |||
| Experiment for Drug Resistance |
Sulforhodamide B (SRB) test assay | |||
| Mechanism Description | Deoxycytidine kinase (dCk) is essential for phosphorylation of natural deoxynucleosides andanalogs, such as gemcitabine and cytarabine, two widely used anticancer compounds. miR-330 expression negatively correlated withdCk mRNA expression, suggesting a role of miR-330 in post-transcriptional regulationof dCk. Expression of miR-330 in various colon and lung cancer cell lines,as measured by QRT-PCR, varied five-fold between samples and correlated with in-vitro gemcitabineresistance. | |||
|
Epigenetic Alteration of DNA, RNA or Protein (EADR)
|
||||
| Key Molecule: hsa-mir-330 | [38] | |||
| Sensitive Disease | Colon cancer [ICD-11: 2B90.1] | |||
| Molecule Alteration | Expression | Down-regulation |
||
| Experimental Note | Revealed Based on the Cell Line Data | |||
| In Vitro Model | HT-29 cells | Colon | Homo sapiens (Human) | CVCL_0320 |
| Colo320 cells | Colon | Homo sapiens (Human) | CVCL_1989 | |
| WiDR cells | Colon | Homo sapiens (Human) | CVCL_2760 | |
| Experiment for Molecule Alteration |
qRT-PCR | |||
| Experiment for Drug Resistance |
Sulforhodamide B (SRB) test assay | |||
| Mechanism Description | Deoxycytidine kinase (dCk) is essential for phosphorylation of natural deoxynucleosides andanalogs, such as gemcitabine and cytarabine, two widely used anticancer compounds. miR-330 expression negatively correlated withdCk mRNA expression, suggesting a role of miR-330 in post-transcriptional regulationof dCk. Expression of miR-330 in various colon and lung cancer cell lines,as measured by QRT-PCR, varied five-fold between samples and correlated with in-vitro gemcitabineresistance. | |||
| Drug Sensitivity Data Categorized by Their Corresponding Mechanisms | ||||
|
Unusual Activation of Pro-survival Pathway (UAPP)
|
||||
| Key Molecule: Tyrosine-protein phosphatase non-receptor type 12 (PTPN12) | [40] | |||
| Sensitive Disease | Cholangiocarcinoma [ICD-11: 2C12.0] | |||
| Molecule Alteration | Expression | Up-regulation |
||
| Differential expression of the molecule in resistant disease | ||||
| Classification of Disease | Liver cancer [ICD-11: 2C12] | |||
| The Specified Disease | Liver cancer | |||
| The Studied Tissue | Liver tissue | |||
| The Expression Level of Disease Section Compare with the Healthy Individual Tissue | p-value: 1.74E-06 Fold-change: 2.24E-01 Z-score: 5.27E+00 |
|||
| Experimental Note | Revealed Based on the Cell Line Data | |||
| Cell Pathway Regulation | Cell proliferation | Activation | hsa05200 | |
| In Vitro Model | H69 cells | Lung | Homo sapiens (Human) | CVCL_8121 |
| KMCH-1 cells | Gallbladder | Homo sapiens (Human) | CVCL_7970 | |
| Mz-ChA-1 cells | Gallbladder | Homo sapiens (Human) | CVCL_6932 | |
| In Vivo Model | Nude mouse xenograft model | Mus musculus | ||
| Experiment for Molecule Alteration |
Western blot analysis | |||
| Experiment for Drug Resistance |
Celltiter 96 aqueous one solution cell proliferation assay | |||
| Mechanism Description | PTPN12 can bind and dephosphorylate the product ofoncogenes such as c-Abl or Src and inactivate the Raspathway. Thus, deregulation of PTPN12 expressionmay contribute to tumor cell survival and oncogenesis. In cells transfected with anti-miR-200b, PTPN12 ex-pression was increased to 132.2%+/-7.2% of controlafter 48 hours and 147.3%+/-12.8% of control after 72hours. Moreover, inhibition of miR-200b significantlyreduced the tyrosine phosphorylation of a downstreamtarget Src, a key mediator of tumor cell proliferation anddifferentiation. | |||
| Key Molecule: PI3-kinase regulatory subunit alpha (PIK3R1) | [52] | |||
| Sensitive Disease | Cholangiocarcinoma [ICD-11: 2C12.0] | |||
| Molecule Alteration | Expression | Down-regulation |
||
| Differential expression of the molecule in resistant disease | ||||
| Classification of Disease | Liver cancer [ICD-11: 2C12] | |||
| The Specified Disease | Liver cancer | |||
| The Studied Tissue | Liver tissue | |||
| The Expression Level of Disease Section Compare with the Healthy Individual Tissue | p-value: 1.13E-05 Fold-change: -7.38E-02 Z-score: -4.75E+00 |
|||
| Experimental Note | Revealed Based on the Cell Line Data | |||
| In Vitro Model | HuCCT1 cells | Bile duct | Homo sapiens (Human) | CVCL_0324 |
| HuH28 cells | Bile duct | Homo sapiens (Human) | CVCL_2955 | |
| Experiment for Molecule Alteration |
Western blot analysis | |||
| Experiment for Drug Resistance |
CCK8 assay | |||
| Mechanism Description | Two miR-29b target genes, PIk3R1 and MMP-2, that are, at least partly, responsible for the resistance of CCA Gem treatment. PIk3R1 encodes phosphoinositide 3-kinase (PI3k) regulatory subunit designated p85 alpha; p85 alpha is regarded as integrator of multiple signaling pathways that together promote cell proliferation, cell survival, and carcinogenesis. | |||
|
Regulation by the Disease Microenvironment (RTDM)
|
||||
| Key Molecule: Collagenase 72 kDa type IV collagenase (MMP2) | [52] | |||
| Sensitive Disease | Cholangiocarcinoma [ICD-11: 2C12.0] | |||
| Molecule Alteration | Expression | Down-regulation |
||
| Differential expression of the molecule in resistant disease | ||||
| Classification of Disease | Liver cancer [ICD-11: 2C12] | |||
| The Specified Disease | Liver cancer | |||
| The Studied Tissue | Liver tissue | |||
| The Expression Level of Disease Section Compare with the Healthy Individual Tissue | p-value: 4.80E-06 Fold-change: -5.35E-02 Z-score: -5.09E+00 |
|||
| Experimental Note | Revealed Based on the Cell Line Data | |||
| In Vitro Model | HuCCT1 cells | Bile duct | Homo sapiens (Human) | CVCL_0324 |
| HuH28 cells | Bile duct | Homo sapiens (Human) | CVCL_2955 | |
| Experiment for Molecule Alteration |
Western blot analysis | |||
| Experiment for Drug Resistance |
CCK8 assay | |||
| Mechanism Description | Two miR-29b target genes, PIk3R1 and MMP-2, that are, at least partly, responsible for the resistance of CCA Gem treatment. PIk3R1 encodes phosphoinositide 3-kinase (PI3k) regulatory subunit designated p85 alpha; p85 alpha is regarded as integrator of multiple signaling pathways that together promote cell proliferation, cell survival, and carcinogenesis. | |||
| Drug Sensitivity Data Categorized by Their Corresponding Mechanisms | ||||
|
Unusual Activation of Pro-survival Pathway (UAPP)
|
||||
| Key Molecule: Tumor protein p53-inducible nuclear protein 1 (TP53INP1) | [45] | |||
| Sensitive Disease | Breast cancer [ICD-11: 2C60.3] | |||
| Molecule Alteration | Expression | Down-regulation |
||
| Differential expression of the molecule in resistant disease | ||||
| Classification of Disease | Breast cancer [ICD-11: 2C60] | |||
| The Specified Disease | Breast cancer | |||
| The Studied Tissue | Breast tissue | |||
| The Expression Level of Disease Section Compare with the Healthy Individual Tissue | p-value: 1.38E-01 Fold-change: -1.23E-02 Z-score: -1.49E+00 |
|||
| Experimental Note | Identified from the Human Clinical Data | |||
| Cell Pathway Regulation | p73-mediated apoptosis signaling pathway | Inhibition | hsa04210 | |
| In Vitro Model | MCF-7 cells | Breast | Homo sapiens (Human) | CVCL_0031 |
| SkBR3 cells | Breast | Homo sapiens (Human) | CVCL_0033 | |
| MDA-MB-231 cells | Breast | Homo sapiens (Human) | CVCL_0062 | |
| T47D cells | Breast | Homo sapiens (Human) | CVCL_0553 | |
| ZR75-1 cells | Breast | Homo sapiens (Human) | CVCL_0588 | |
| BT-549 | Breast | Homo sapiens (Human) | CVCL_1092 | |
| MCF-10A | Breast | Homo sapiens (Human) | CVCL_0598 | |
| MDA-MB-436 cells | Breast | Homo sapiens (Human) | CVCL_0623 | |
| MDA-MB-453 cells | Breast | Homo sapiens (Human) | CVCL_0418 | |
| MDA-MB-468 cells | Breast | Homo sapiens (Human) | CVCL_0419 | |
| ZR-75-30 cells | Breast | Homo sapiens (Human) | CVCL_1661 | |
| Experiment for Molecule Alteration |
Immunoblotting assay | |||
| Experiment for Drug Resistance |
TUNEL assays | |||
| Mechanism Description | microRNA-200a confers chemoresistance by antagonizing TP53INP1 and YAP1 in human breast cancer Inhibition of miR200a enhances gemcitabine chemosensitivity in resistance cancer cells. TP53INP1 and YAP1 are involved in the RNA damage-induced p73-mediated apoptosis. | |||
| Drug Resistance Data Categorized by Their Corresponding Mechanisms | ||||
|
Unusual Activation of Pro-survival Pathway (UAPP)
|
||||
| Key Molecule: Deoxycytidylate deaminase (DCTD) | [1] | |||
| Resistant Disease | Triple negative breast cancer [ICD-11: 2C60.9] | |||
| Molecule Alteration | Expression | Down-regulation |
||
| Differential expression of the molecule in resistant disease | ||||
| Classification of Disease | Breast cancer [ICD-11: 2C60] | |||
| The Specified Disease | Breast cancer | |||
| The Studied Tissue | Breast tissue | |||
| The Expression Level of Disease Section Compare with the Healthy Individual Tissue | p-value: 1.12E-02 Fold-change: -1.31E-02 Z-score: -2.55E+00 |
|||
| Experimental Note | Identified from the Human Clinical Data | |||
| Cell Pathway Regulation | Cell apoptosis | Inhibition | hsa04210 | |
| Cell proliferation | Activation | hsa05200 | ||
| In Vitro Model | MDA-MB-231 cells | Breast | Homo sapiens (Human) | CVCL_0062 |
| Experiment for Molecule Alteration |
Western blot analysis; RT-qPCR | |||
| Experiment for Drug Resistance |
MTT assay; Flow cytometry assay | |||
| Mechanism Description | Overexpression of microRNA-620 facilitates the resistance of triple negative breast cancer cells to gemcitabine treatment by targeting DCTD. | |||
| Drug Sensitivity Data Categorized by Their Corresponding Mechanisms | ||||
|
Unusual Activation of Pro-survival Pathway (UAPP)
|
||||
| Key Molecule: Cysteine and glycine-rich protein 1 (CSRP1) | [57] | |||
| Sensitive Disease | Acute myeloid leukemia [ICD-11: 2A60.0] | |||
| Molecule Alteration | Expression | Up-regulation |
||
| Experimental Note | Discovered Using In-vivo Testing Model | |||
| Cell Pathway Regulation | Rap1 signaling pathway | Activation | hsa04015 | |
| HIF-1 signaling pathway | Activation | hsa04066 | ||
| JAK-STAT signaling pathway | Activation | hsa04630 | ||
| In Vivo Model | Patient-derived advanced AML model | Homo sapiens | ||
| Experiment for Drug Resistance |
OncoPredict assay | |||
| Mechanism Description | Based on the findings, the high?CSRP1?groups of patients in the TCGA datasets showed higher sensitivity to 5-fluorouracil, gemcitabine, rapamycin, and cisplatin and lower sensitivity to fludarabine. CSRP1 may serve as a potential prognostic marker and a therapeutic target for AML in the future. | |||
| Drug Resistance Data Categorized by Their Corresponding Mechanisms | ||||
|
Epigenetic Alteration of DNA, RNA or Protein (EADR)
|
||||
| Key Molecule: hsa-mir-187 | [5] | |||
| Resistant Disease | Peripheral T-cell lymphoma [ICD-11: 2A90.0] | |||
| Molecule Alteration | Expression | Up-regulation |
||
| Experimental Note | Identified from the Human Clinical Data | |||
| Cell Pathway Regulation | Cell proliferation | Activation | hsa05200 | |
| In Vitro Model | MOLT4 cells | Bone marrow | Homo sapiens (Human) | CVCL_0013 |
| HUT78 cells | Lymph | Homo sapiens (Human) | CVCL_0337 | |
| In Vivo Model | Nude mouse xenograft model | Mus musculus | ||
| Experiment for Molecule Alteration |
qRT-PCR | |||
| Experiment for Drug Resistance |
MTT assay | |||
| Mechanism Description | miR187 downregulated tumor suppressor gene disabled homolog-2 (Dab2), decreased the interaction of Dab2 with adapter protein Grb2, resulting in Ras activation, phosphorylation/activation of extracellular signal-regulated kinase (ERk) and AkT, and subsequent stabilization of MYC oncoprotein. MiR187-overexpressing cells were resistant to chemotherapeutic agents like doxorubicin, cyclophosphamide, cisplatin and gemcitabine, but sensitive to the proteasome inhibitor bortezomib. | |||
|
Irregularity in Drug Uptake and Drug Efflux (IDUE)
|
||||
| Key Molecule: ATP-binding cassette sub-family G2 (ABCG2) | [58] | |||
| Resistant Disease | Natural killer/T-cell lymphoma [ICD-11: 2A90.2] | |||
| Molecule Alteration | Expression | Up-regulation |
||
| Experimental Note | Revealed Based on the Cell Line Data | |||
| In Vitro Model | SNK-6 cells | Oral | Homo sapiens (Human) | CVCL_A673 |
| In Vivo Model | Balb/c athymic nude mouse xenograft model | Mus musculus | ||
| Experiment for Molecule Alteration |
Western blot analysis | |||
| Experiment for Drug Resistance |
CCK8 assay | |||
| Mechanism Description | ABCG2 upregulated cell proliferation, increased clonogenicity, increased invasive ability and decreased apoptosis, in vivo and in vitro, when cells were treated with gemcitabine. | |||
|
Unusual Activation of Pro-survival Pathway (UAPP)
|
||||
| Key Molecule: Protein zeta/delta 14-3-3 (YWHAZ) | [19] | |||
| Resistant Disease | T-cell lymphoma [ICD-11: 2A60.3] | |||
| Molecule Alteration | Expression | Up-regulation |
||
| Experimental Note | Revealed Based on the Cell Line Data | |||
| In Vitro Model | YTS cells | Pleural effusion | Homo sapiens (Human) | CVCL_D324 |
| Experiment for Molecule Alteration |
Western blotting assay | |||
| Experiment for Drug Resistance |
MTT assay | |||
| Mechanism Description | Compared with YTS-gem cells, the level of Pro apoptotic protein Bax in YTS gem cells that down regulated 14-3-3-Zetawas significantly higher. In contrast, the levels of anti apoptotic proteins Bcl-2, Caspase-3, cleaved caspase-3 and cyclin D1 decreased significantly. | |||
| Key Molecule: Protein zeta/delta 14-3-3 (YWHAZ) | [19] | |||
| Resistant Disease | Extranodal NK/T-cell lymphoma [ICD-11: 2A90.6] | |||
| Molecule Alteration | Expression | Up-regulation |
||
| Experimental Note | Revealed Based on the Cell Line Data | |||
| Cell Pathway Regulation | Cell invasion | Activation | hsa05200 | |
| Cell proliferation | Activation | hsa05200 | ||
| In Vitro Model | YTS cells | Pleural effusion | Homo sapiens (Human) | CVCL_D324 |
| Experiment for Molecule Alteration |
Western blot analysis | |||
| Experiment for Drug Resistance |
CCK-8 assay | |||
| Mechanism Description | 14-3-3-Zeta was up regulated in YTS gem cells, 14-3-3-Zeta promote cell proliferation and invasion, 14-3-3-Zeta protein induced enktl resistance to gemcitabine through anti apoptotic pathway. | |||
| Drug Resistance Data Categorized by Their Corresponding Mechanisms | ||||
|
Epigenetic Alteration of DNA, RNA or Protein (EADR)
|
||||
| Key Molecule: hsa-mir-152 | [20] | |||
| Resistant Disease | Osteosarcoma [ICD-11: 2B51.0] | |||
| Molecule Alteration | Expression | Down-regulation |
||
| Experimental Note | Revealed Based on the Cell Line Data | |||
| Cell Pathway Regulation | Cell apoptosis | Inhibition | hsa04210 | |
| Cell proliferation | Activation | hsa05200 | ||
| c-Met/PI3K/AKT signaling pathway | Activation | hsa01521 | ||
| In Vitro Model | MG63 cells | Bone marrow | Homo sapiens (Human) | CVCL_0426 |
| In Vivo Model | Nude mouse xenograft model | Mus musculus | ||
| Experiment for Molecule Alteration |
qRT-PCR | |||
| Experiment for Drug Resistance |
MTT assay; Flow cytometry assay; Soft agar assay | |||
| Mechanism Description | LncRNAPVT1 targets miR-152 to enhance chemoresistance of osteosarcoma to gemcitabine through activating c-MET/PI3k/AkT pathway. | |||
| Key Molecule: Pvt1 oncogene (PVT1) | [20] | |||
| Resistant Disease | Osteosarcoma [ICD-11: 2B51.0] | |||
| Molecule Alteration | Expression | Up-regulation |
||
| Experimental Note | Revealed Based on the Cell Line Data | |||
| Cell Pathway Regulation | Cell apoptosis | Inhibition | hsa04210 | |
| Cell proliferation | Activation | hsa05200 | ||
| c-Met/PI3K/AKT signaling pathway | Activation | hsa01521 | ||
| In Vitro Model | MG63 cells | Bone marrow | Homo sapiens (Human) | CVCL_0426 |
| In Vivo Model | Nude mouse xenograft model | Mus musculus | ||
| Experiment for Molecule Alteration |
qRT-PCR | |||
| Experiment for Drug Resistance |
MTT assay; Flow cytometry assay; Soft agar assay | |||
| Mechanism Description | LncRNAPVT1 targets miR-152 to enhance chemoresistance of osteosarcoma to gemcitabine through activating c-MET/PI3k/AkT pathway. | |||
| Drug Sensitivity Data Categorized by Their Corresponding Mechanisms | ||||
|
Epigenetic Alteration of DNA, RNA or Protein (EADR)
|
||||
| Key Molecule: hsa-mir-34 | [59] | |||
| Sensitive Disease | Gastric cancer [ICD-11: 2B72.1] | |||
| Molecule Alteration | Expression | Up-regulation |
||
| Experimental Note | Revealed Based on the Cell Line Data | |||
| Cell Pathway Regulation | p53 signaling pathway | Inhibition | hsa04115 | |
| In Vitro Model | AGS cells | Gastric | Homo sapiens (Human) | CVCL_0139 |
| NCI-N87 cells | Gastric | Homo sapiens (Human) | CVCL_1603 | |
| MkN-45 cells | Gastric | Homo sapiens (Human) | CVCL_0434 | |
| KATO-3 cells | Gastric | Homo sapiens (Human) | CVCL_0371 | |
| Experiment for Molecule Alteration |
qRT-PCR | |||
| Experiment for Drug Resistance |
CCK8 assay | |||
| Mechanism Description | Human gastric cancer kato III cells with miR-34 restoration reduced the expression of target genes Bcl-2, Notch, and HMGA2. MicroRNA miR-34 was recently found to be a direct target of p53, functioning downstream of the p53 pathway as a tumor suppressor, miR-34 impaired cell growth, accumulated the cells in G1 phase, increased caspase-3 activation, and, more significantly, inhibited tumorsphere formation and growth. | |||
|
Unusual Activation of Pro-survival Pathway (UAPP)
|
||||
| Key Molecule: Apoptosis regulator Bcl-2 (BCL2) | [59] | |||
| Sensitive Disease | Gastric cancer [ICD-11: 2B72.1] | |||
| Molecule Alteration | Expression | Down-regulation |
||
| Experimental Note | Revealed Based on the Cell Line Data | |||
| Cell Pathway Regulation | p53 signaling pathway | Inhibition | hsa04115 | |
| In Vitro Model | AGS cells | Gastric | Homo sapiens (Human) | CVCL_0139 |
| NCI-N87 cells | Gastric | Homo sapiens (Human) | CVCL_1603 | |
| MkN-45 cells | Gastric | Homo sapiens (Human) | CVCL_0434 | |
| KATO-3 cells | Gastric | Homo sapiens (Human) | CVCL_0371 | |
| Experiment for Molecule Alteration |
Western blot analysis | |||
| Experiment for Drug Resistance |
CCK8 assay | |||
| Mechanism Description | Human gastric cancer kato III cells with miR-34 restoration reduced the expression of target genes Bcl-2, Notch, and HMGA2. MicroRNA miR-34 was recently found to be a direct target of p53, functioning downstream of the p53 pathway as a tumor suppressor, miR-34 impaired cell growth, accumulated the cells in G1 phase, increased caspase-3 activation, and, more significantly, inhibited tumorsphere formation and growth. | |||
| Key Molecule: High mobility group protein HMGI-C (HMGA2) | [59] | |||
| Sensitive Disease | Gastric cancer [ICD-11: 2B72.1] | |||
| Molecule Alteration | Expression | Down-regulation |
||
| Experimental Note | Revealed Based on the Cell Line Data | |||
| Cell Pathway Regulation | p53 signaling pathway | Inhibition | hsa04115 | |
| In Vitro Model | AGS cells | Gastric | Homo sapiens (Human) | CVCL_0139 |
| NCI-N87 cells | Gastric | Homo sapiens (Human) | CVCL_1603 | |
| MkN-45 cells | Gastric | Homo sapiens (Human) | CVCL_0434 | |
| KATO-3 cells | Gastric | Homo sapiens (Human) | CVCL_0371 | |
| Experiment for Molecule Alteration |
Western blot analysis | |||
| Experiment for Drug Resistance |
CCK8 assay | |||
| Mechanism Description | Human gastric cancer kato III cells with miR-34 restoration reduced the expression of target genes Bcl-2, Notch, and HMGA2. MicroRNA miR-34 was recently found to be a direct target of p53, functioning downstream of the p53 pathway as a tumor suppressor, miR-34 impaired cell growth, accumulated the cells in G1 phase, increased caspase-3 activation, and, more significantly, inhibited tumorsphere formation and growth. | |||
| Key Molecule: Neurogenic locus notch homolog protein (NOTCH) | [59] | |||
| Sensitive Disease | Gastric cancer [ICD-11: 2B72.1] | |||
| Molecule Alteration | Expression | Down-regulation |
||
| Experimental Note | Revealed Based on the Cell Line Data | |||
| Cell Pathway Regulation | p53 signaling pathway | Inhibition | hsa04115 | |
| In Vitro Model | AGS cells | Gastric | Homo sapiens (Human) | CVCL_0139 |
| NCI-N87 cells | Gastric | Homo sapiens (Human) | CVCL_1603 | |
| MkN-45 cells | Gastric | Homo sapiens (Human) | CVCL_0434 | |
| KATO-3 cells | Gastric | Homo sapiens (Human) | CVCL_0371 | |
| Experiment for Molecule Alteration |
Western blot analysis | |||
| Experiment for Drug Resistance |
CCK8 assay | |||
| Mechanism Description | Human gastric cancer kato III cells with miR-34 restoration reduced the expression of target genes Bcl-2, Notch, and HMGA2. MicroRNA miR-34 was recently found to be a direct target of p53, functioning downstream of the p53 pathway as a tumor suppressor, miR-34 impaired cell growth, accumulated the cells in G1 phase, increased caspase-3 activation, and, more significantly, inhibited tumorsphere formation and growth. | |||
References
If you find any error in data or bug in web service, please kindly report it to Dr. Sun and Dr. Yu.