Molecule Information
General Information of the Molecule (ID: Mol01297)
| Name |
Taurine up-regulated 1 (TUG1)
,Homo sapiens
|
||||
|---|---|---|---|---|---|
| Synonyms |
TUG1
Click to Show/Hide
|
||||
| Molecule Type |
LncRNA
|
||||
| Gene Name |
HCN, LINC00047, MALAT-1, NCRNA00047, NEAT2, PRO1073, mascRNA
|
||||
| Gene ID | |||||
| Location |
chr22:30969245-30979395[+]
|
||||
| Ensembl ID | |||||
| HGNC ID | |||||
| Click to Show/Hide the Complete Species Lineage | |||||
Type(s) of Resistant Mechanism of This Molecule
 EADR: Epigenetic Alteration of DNA, RNA or Protein
 UAPP: Unusual Activation of Pro-survival Pathway
Drug Resistance Data Categorized by Drug
Approved Drug(s)
5 drug(s) in total
| Drug Resistance Data Categorized by Their Corresponding Mechanisms | ||||
|
Epigenetic Alteration of DNA, RNA or Protein (EADR)
|
||||
| Disease Class: Pancreatic ductal adenocarcinoma [ICD-11: 2C10.0] | [1] | |||
| Resistant Disease | Pancreatic ductal adenocarcinoma [ICD-11: 2C10.0] | |||
| Resistant Drug | Gemcitabine | |||
| Molecule Alteration | Expression | Up-regulation |
||
| Differential expression of the molecule in resistant disease | ||||
| Classification of Disease | Pancreatic cancer [ICD-11: 2C10] | |||
| The Specified Disease | Pancreatic adenocarcinoma | |||
| The Studied Tissue | Pancreas | |||
| The Expression Level of Disease Section Compare with the Healthy Individual Tissue | p-value: 9.57E-23 Fold-change: 5.17E-01 Z-score: 1.06E+01 |
|||
| Experimental Note | Revealed Based on the Cell Line Data | |||
| Cell Pathway Regulation | Cell apoptosis | Inhibition | hsa04210 | |
| Cell colony | Activation | hsa05200 | ||
| Cell viability | Activation | hsa05200 | ||
| ERK signaling pathway | Activation | hsa04210 | ||
| In Vitro Model | BxPC-3 cells | Pancreas | Homo sapiens (Human) | CVCL_0186 |
| PANC-1 cells | Pancreas | Homo sapiens (Human) | CVCL_0480 | |
| SW1990 cells | Pancreas | Homo sapiens (Human) | CVCL_1723 | |
| PANC-28 cells | Pancreatic | Homo sapiens (Human) | CVCL_3917 | |
| Experiment for Molecule Alteration |
qRT-PCR | |||
| Experiment for Drug Resistance |
MTT assay | |||
| Mechanism Description | TUG1 promoted the viability of PDAC cells and enhanced its resistance of gemcitabine and overexpression of TUG1 increased ERk phosphorylation. | |||
| Drug Resistance Data Categorized by Their Corresponding Mechanisms | ||||
|
Epigenetic Alteration of DNA, RNA or Protein (EADR)
|
||||
| Disease Class: Esophageal squamous cell carcinoma [ICD-11: 2B70.3] | [2] | |||
| Resistant Disease | Esophageal squamous cell carcinoma [ICD-11: 2B70.3] | |||
| Resistant Drug | Cisplatin | |||
| Molecule Alteration | Expression | Up-regulation |
||
| Differential expression of the molecule in resistant disease | ||||
| Classification of Disease | Esophageal cancer [ICD-11: 2B70] | |||
| The Specified Disease | Esophageal carcinoma | |||
| The Studied Tissue | Esophagus | |||
| The Expression Level of Disease Section Compare with the Healthy Individual Tissue | p-value: 4.51E-16 Fold-change: 4.24E-01 Z-score: 8.85E+00 |
|||
| Experimental Note | Revealed Based on the Cell Line Data | |||
| Cell Pathway Regulation | Cell apoptosis | Inhibition | hsa04210 | |
| Cell proliferation | Activation | hsa05200 | ||
| In Vitro Model | TE-1 cells | Esophagus | Homo sapiens (Human) | CVCL_1759 |
| Experiment for Molecule Alteration |
qRT-PCR | |||
| Experiment for Drug Resistance |
MTT assay; Flow cytometry assay | |||
| Mechanism Description | TUG1 promoted cell resistance to DDP, at least in part, through upregulating Nrf2. | |||
| Drug Sensitivity Data Categorized by Their Corresponding Mechanisms | ||||
|
Epigenetic Alteration of DNA, RNA or Protein (EADR)
|
||||
| Disease Class: Breast cancer [ICD-11: 2C60.3] | [3] | |||
| Sensitive Disease | Breast cancer [ICD-11: 2C60.3] | |||
| Sensitive Drug | Cisplatin | |||
| Molecule Alteration | Expression | Up-regulation |
||
| Experimental Note | Revealed Based on the Cell Line Data | |||
| Cell Pathway Regulation | Cell viability | Inhibition | hsa05200 | |
| Wnt signaling pathway | Inhibition | hsa04310 | ||
| In Vitro Model | MCF-7 cells | Breast | Homo sapiens (Human) | CVCL_0031 |
| MDA-MB-231 cells | Breast | Homo sapiens (Human) | CVCL_0062 | |
| T47D cells | Breast | Homo sapiens (Human) | CVCL_0553 | |
| BT549 cells | Breast | Homo sapiens (Human) | CVCL_1092 | |
| Experiment for Molecule Alteration |
qRT-PCR | |||
| Experiment for Drug Resistance |
CCK8 assay | |||
| Mechanism Description | LncRNA TUG1 sensitized triple negative breast cancer to cisplatin by upregulating NLk expression via sponging miR-197. | |||
| Drug Resistance Data Categorized by Their Corresponding Mechanisms | ||||
|
Epigenetic Alteration of DNA, RNA or Protein (EADR)
|
||||
| Disease Class: Acute myeloid leukemia [ICD-11: 2A60.0] | [4] | |||
| Resistant Disease | Acute myeloid leukemia [ICD-11: 2A60.0] | |||
| Resistant Drug | Doxorubicin | |||
| Molecule Alteration | Expression | Up-regulation |
||
| Experimental Note | Identified from the Human Clinical Data | |||
| Cell Pathway Regulation | Cell apoptosis | Inhibition | hsa04210 | |
| In Vitro Model | HL60 cells | Peripheral blood | Homo sapiens (Human) | CVCL_0002 |
| HS-5 cells | Bone marrow | Homo sapiens (Human) | CVCL_3720 | |
| Experiment for Molecule Alteration |
qRT-PCR | |||
| Experiment for Drug Resistance |
MTT assay; Flow cytometry assay | |||
| Mechanism Description | TUG1 epigenetically suppressed miR-34a expression by recruiting EZH2 to the promoter region of miR-34a and increasing H3k27me3 level to confer adriamycin resistance in acute myeloid leukemia. | |||
| Drug Resistance Data Categorized by Their Corresponding Mechanisms | ||||
|
Epigenetic Alteration of DNA, RNA or Protein (EADR)
|
||||
| Disease Class: Colorectal cancer [ICD-11: 2B91.1] | [5] | |||
| Resistant Disease | Colorectal cancer [ICD-11: 2B91.1] | |||
| Resistant Drug | Methotrexate | |||
| Molecule Alteration | Expression | Up-regulation |
||
| Experimental Note | Identified from the Human Clinical Data | |||
| In Vitro Model | HCT-8 cells | Colon | Homo sapiens (Human) | CVCL_2478 |
| HT-29-R cells | Colon | Homo sapiens (Human) | CVCL_6834 | |
| Experiment for Molecule Alteration |
qPCR | |||
| Experiment for Drug Resistance |
MTT assay; Flow cytometric analysis | |||
| Mechanism Description | TUG1 mediates methotrexate resistance in colorectal cancer via miR186/CPEB2 axis. | |||
| Drug Resistance Data Categorized by Their Corresponding Mechanisms | ||||
|
Unusual Activation of Pro-survival Pathway (UAPP)
|
||||
| Disease Class: Glioma [ICD-11: 2A00.1] | [6] | |||
| Resistant Disease | Glioma [ICD-11: 2A00.1] | |||
| Resistant Drug | Temozolomide | |||
| Molecule Alteration | Expression | . |
||
| Experimental Note | Revealed Based on the Cell Line Data | |||
| Cell Pathway Regulation | NEAT1/miR-454-3p/Connexin 43 signaling pathway | Regulation | N.A. | |
| Experiment for Drug Resistance |
CCK8 assay | |||
| Mechanism Description | The results showed that recurring gliomas displayed elevated levels of NEAT1 compared to primary gliomas. The suppression of NEAT1 led to a restoration of sensitivity in GBM cells to TMZ. NEAT1 functioned as a competitive endogenous RNA against miR-454-3p. Connexin 43 was identified as a miR-454-3p target. NEAT1 was found to regulate gap junctional intercellular communication by modulating Connexin 43, thereby impacting the response of GBM cells to TMZ chemotherapy. Downregulation of NEAT1 resulted in enhanced chemosensitivity to TMZ and extended the survival of mice. | |||
Investigative Drug(s)
3 drug(s) in total
| Drug Resistance Data Categorized by Their Corresponding Mechanisms | ||||
|
Epigenetic Alteration of DNA, RNA or Protein (EADR)
|
||||
| Disease Class: Lung adenocarcinoma [ICD-11: 2C25.0] | [7] | |||
| Resistant Disease | Lung adenocarcinoma [ICD-11: 2C25.0] | |||
| Resistant Drug | Cisplatinum | |||
| Molecule Alteration | Down-regulation | Interaction |
||
| Experimental Note | Identified from the Human Clinical Data | |||
| In Vitro Model | SPC-A1 cells | Lung | Homo sapiens (Human) | CVCL_6955 |
| NCI-H520 cells | Lung | Homo sapiens (Human) | CVCL_1566 | |
| NCI-H1299 cells | Lymph node | Homo sapiens (Human) | CVCL_0060 | |
| In Vivo Model | BALB/c nude mice model | Mus musculus | ||
| Experiment for Molecule Alteration |
Overexpression assay | |||
| Experiment for Drug Resistance |
MTT assay | |||
| Mechanism Description | TUG1 overexpression was shown to inhibit cell proliferation, migration, invasion, but facilitate apoptosis and autophagy in NSCLC cells resistant to cisplatin (DDP). | |||
| Drug Resistance Data Categorized by Their Corresponding Mechanisms | ||||
|
Epigenetic Alteration of DNA, RNA or Protein (EADR)
|
||||
| Disease Class: Hepatic cirrhosis [ICD-11: DB93.1] | [7] | |||
| Resistant Disease | Hepatic cirrhosis [ICD-11: DB93.1] | |||
| Resistant Drug | Lipopolysaccharide | |||
| Molecule Alteration | Up-regulation | Interaction |
||
| Experimental Note | Identified from the Human Clinical Data | |||
| In Vitro Model | LSECs | Liver | Homo sapiens (Human) | CVCL_QY34 |
| Experiment for Molecule Alteration |
Knockdown assay; Overexpression assay; qRT-PCR; Western bloting analysis; Co-immunofluorescence staining; Immunohistochemical assay; RNA-seq; Luciferase assay; FISH assay; RIP experiments assay; ELISA assay | |||
| Experiment for Drug Resistance |
WST assay; Flow cytometry assay; Transwell assay | |||
| Mechanism Description | TUG1 promotes LPS-induced autophagy and EndMT of LSECs by functioning as an endogenous sponge for miR-142-3p and promoting the expression of A TG5. LPS and miR-142-3p are potential diagnostic and therapeutic targets in cirrhosis. | |||
| Drug Resistance Data Categorized by Their Corresponding Mechanisms | ||||
|
Epigenetic Alteration of DNA, RNA or Protein (EADR)
|
||||
| Disease Class: Irritable bowel syndrome [ICD-11: DD91.0] | [7] | |||
| Resistant Disease | Irritable bowel syndrome [ICD-11: DD91.0] | |||
| Resistant Drug | Picric acid | |||
| Molecule Alteration | Down-regulation | Interaction |
||
| Experimental Note | Revealed Based on the Cell Line Data | |||
| In Vitro Model | ICCs | Breast | Homo sapiens (Human) | CVCL_B5N7 |
| Experiment for Molecule Alteration |
qRT-PCR; Western bloting analysis; Overexpression assay | |||
| Experiment for Drug Resistance |
CCK8 assay; Flow cytometry assay | |||
| Mechanism Description | TUG1 attenuated TNF-alpha-caused apoptosis and inflammatory response in ICC by down-regulating miR-127 and then inactivating NF-kappa-B and Notch pathways. | |||
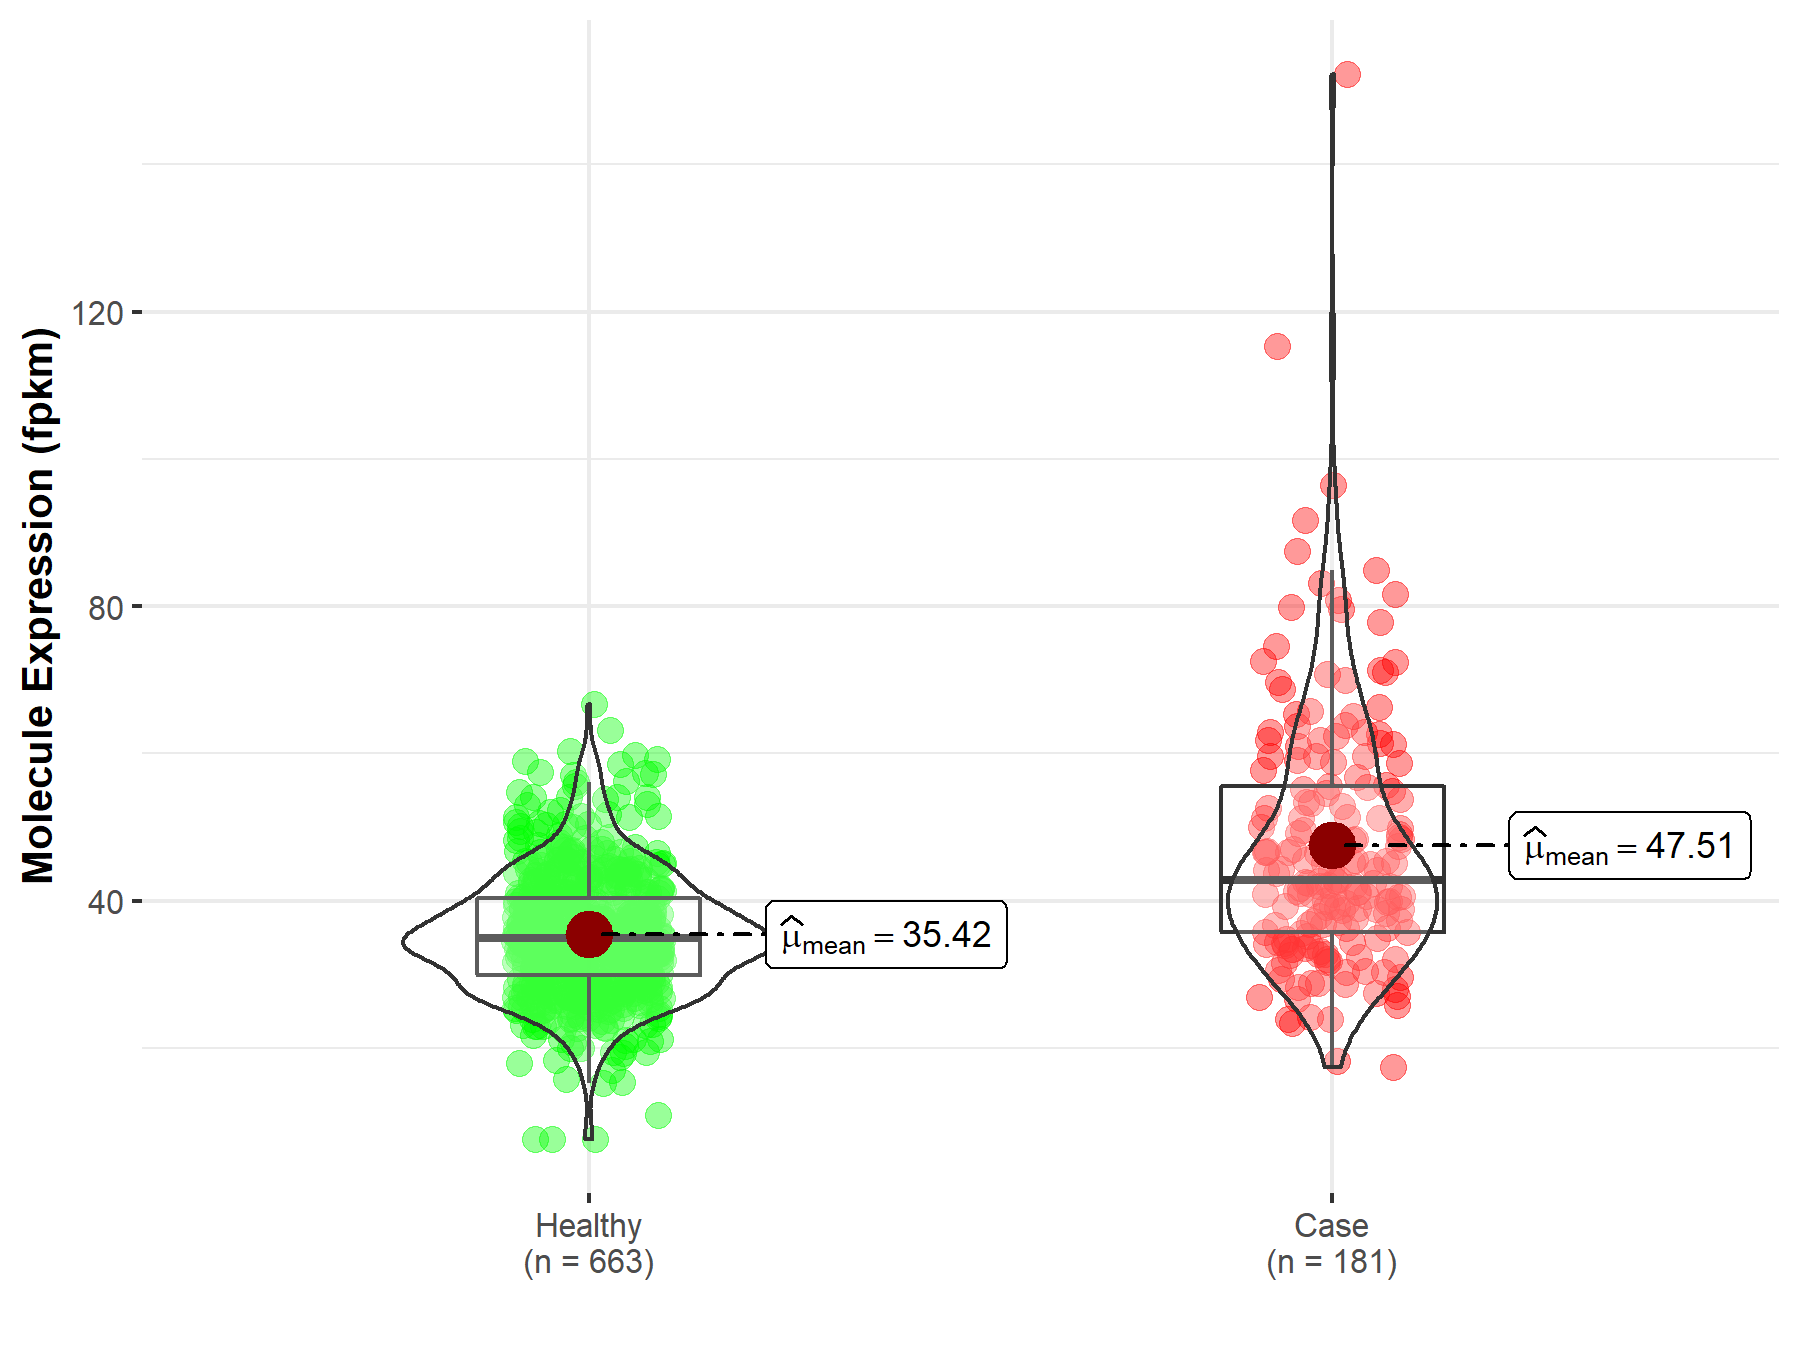
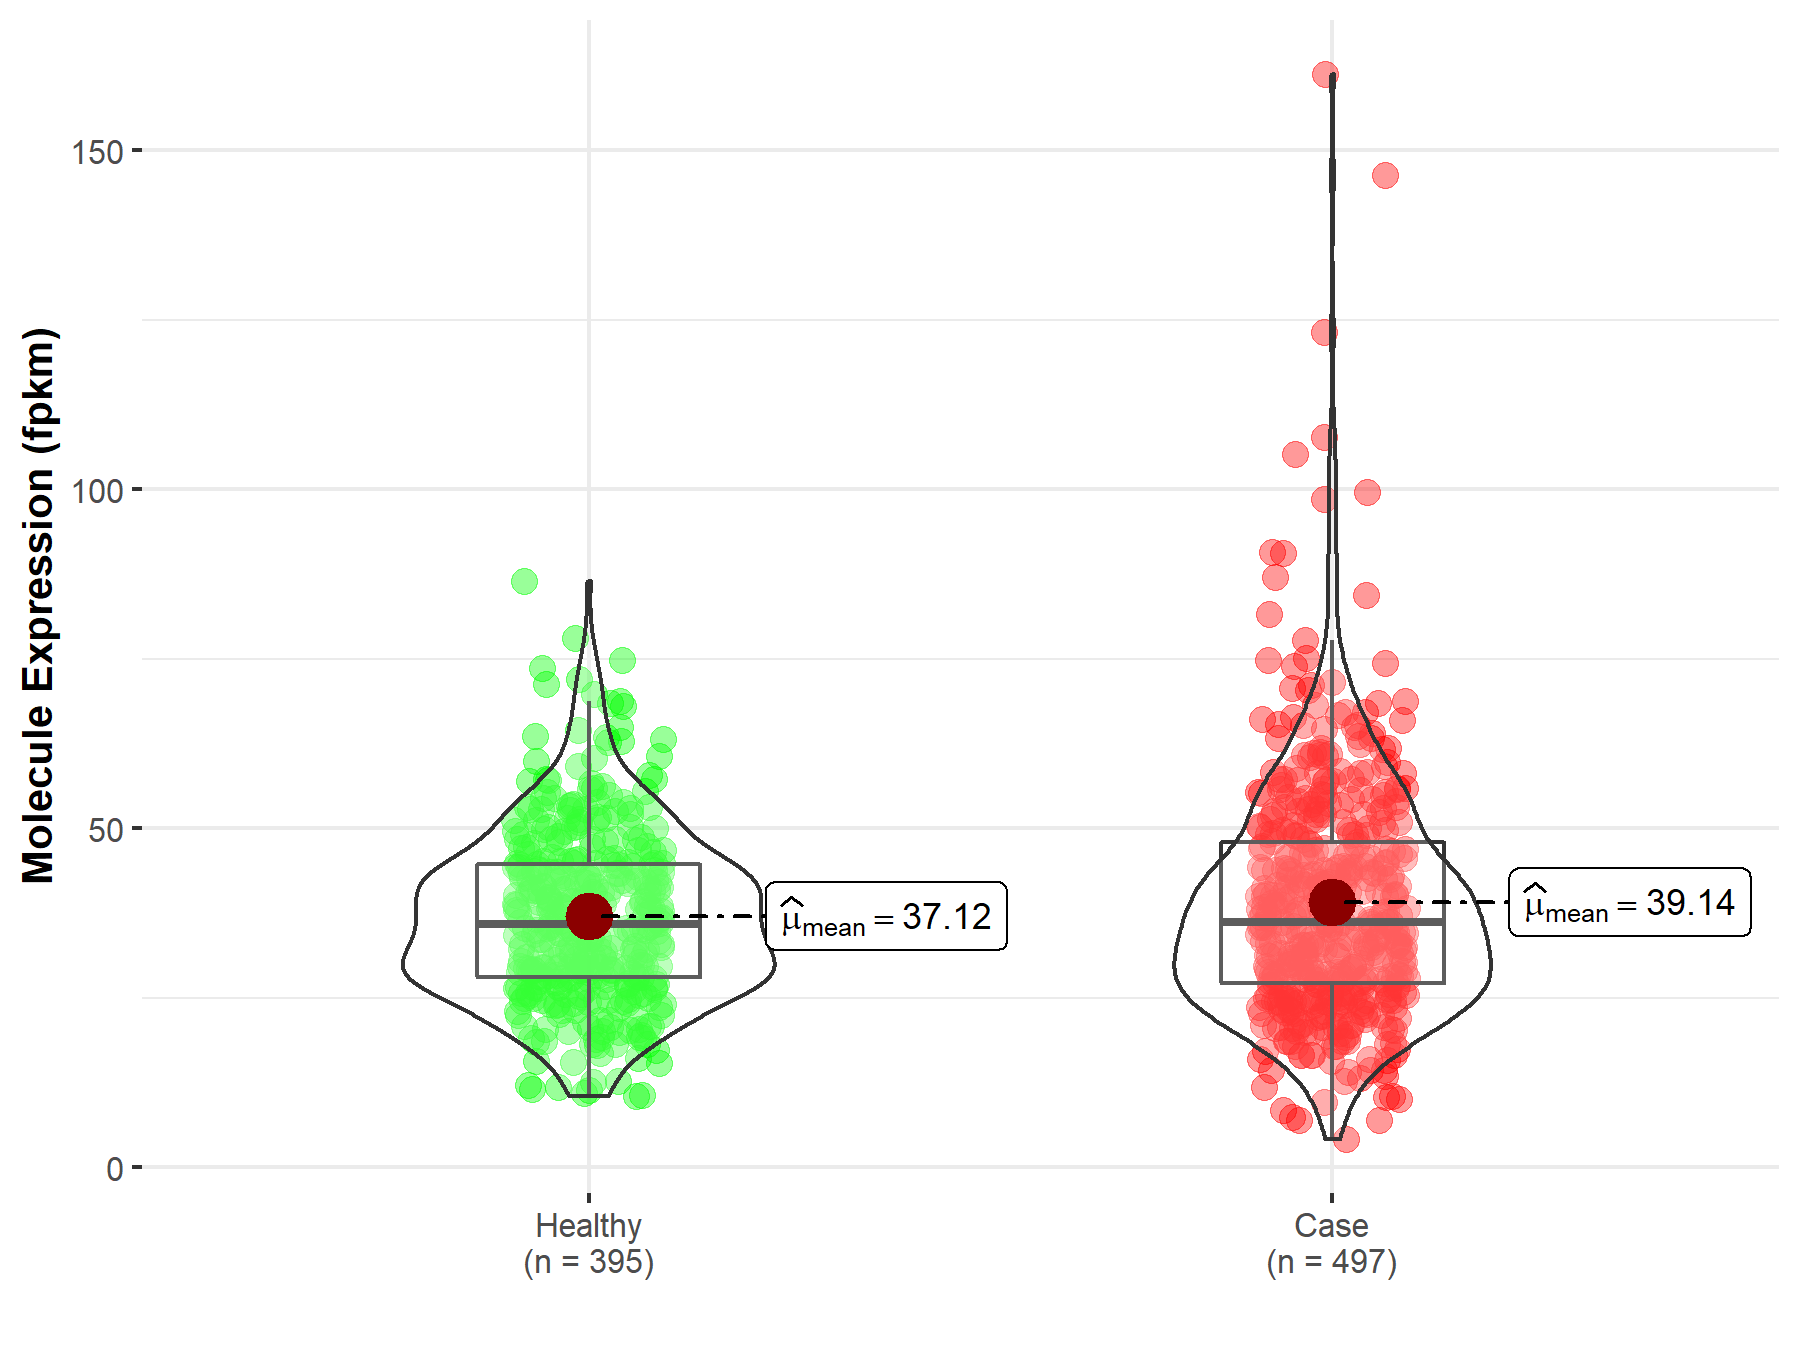
Disease- and Tissue-specific Abundances of This Molecule
ICD Disease Classification 02

| Differential expression of molecule in resistant diseases | ||
| The Studied Tissue | Esophagus | |
| The Specified Disease | Esophageal carcinoma | |
| The Expression Level of Disease Section Compare with the Healthy Individual Tissue | p-value: 3.36E-29; Fold-change: -3.06E-02 | |
|
Molecule expression in the diseased tissue of patients
Molecule expression in the normal tissue of healthy individuals
|
||
| Disease-specific Molecule Abundances |
|
Click to View the Clearer Original Diagram |
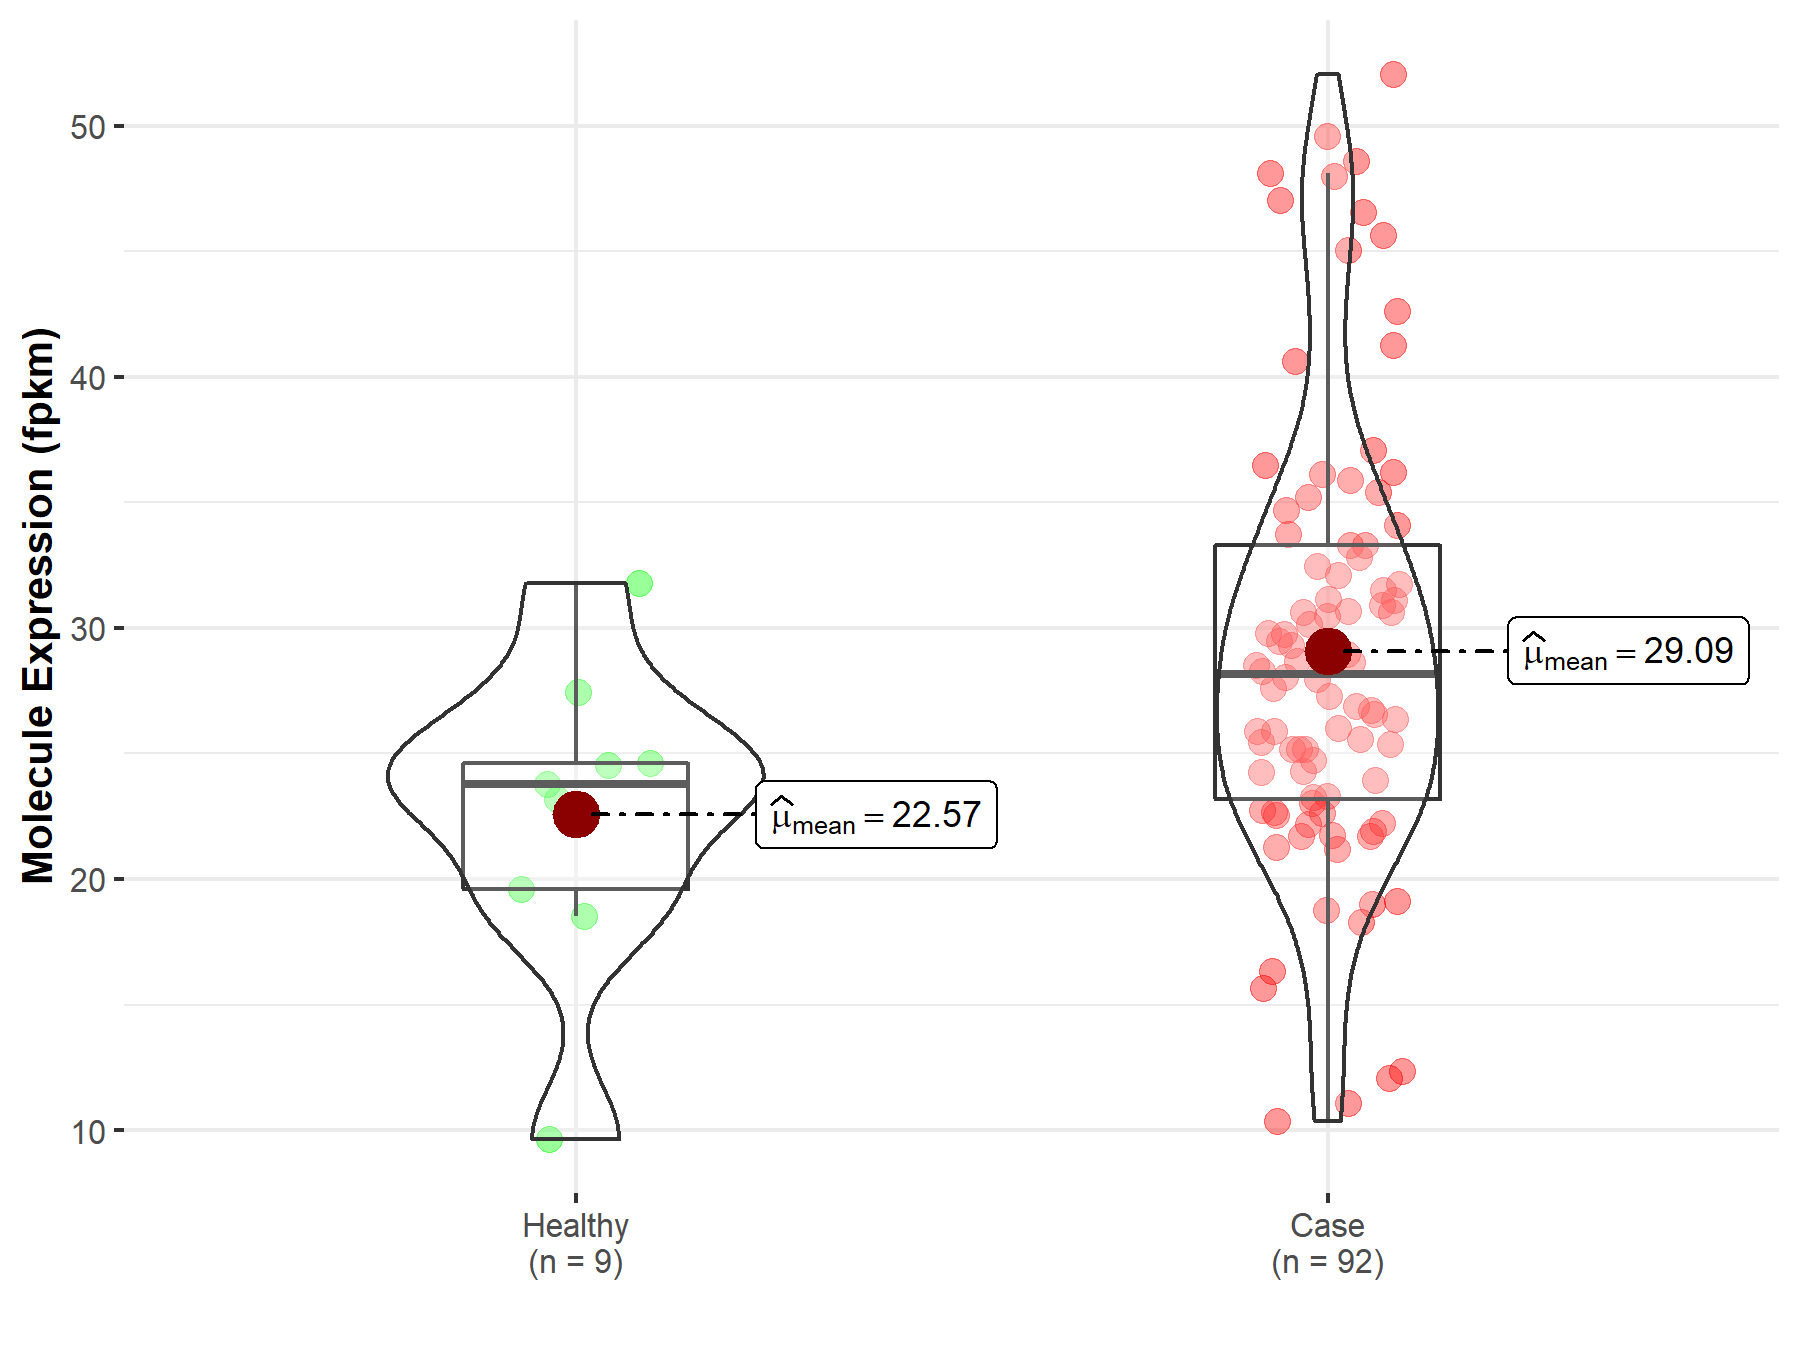
| Differential expression of molecule in resistant diseases | ||
| The Studied Tissue | Rectum | |
| The Specified Disease | Rectum adenocarcinoma | |
| The Expression Level of Disease Section Compare with the Healthy Individual Tissue | p-value: 1.40E-02; Fold-change: -3.43E-02 | |
|
Molecule expression in the diseased tissue of patients
Molecule expression in the normal tissue of healthy individuals
|
||
| Disease-specific Molecule Abundances |
|
Click to View the Clearer Original Diagram |
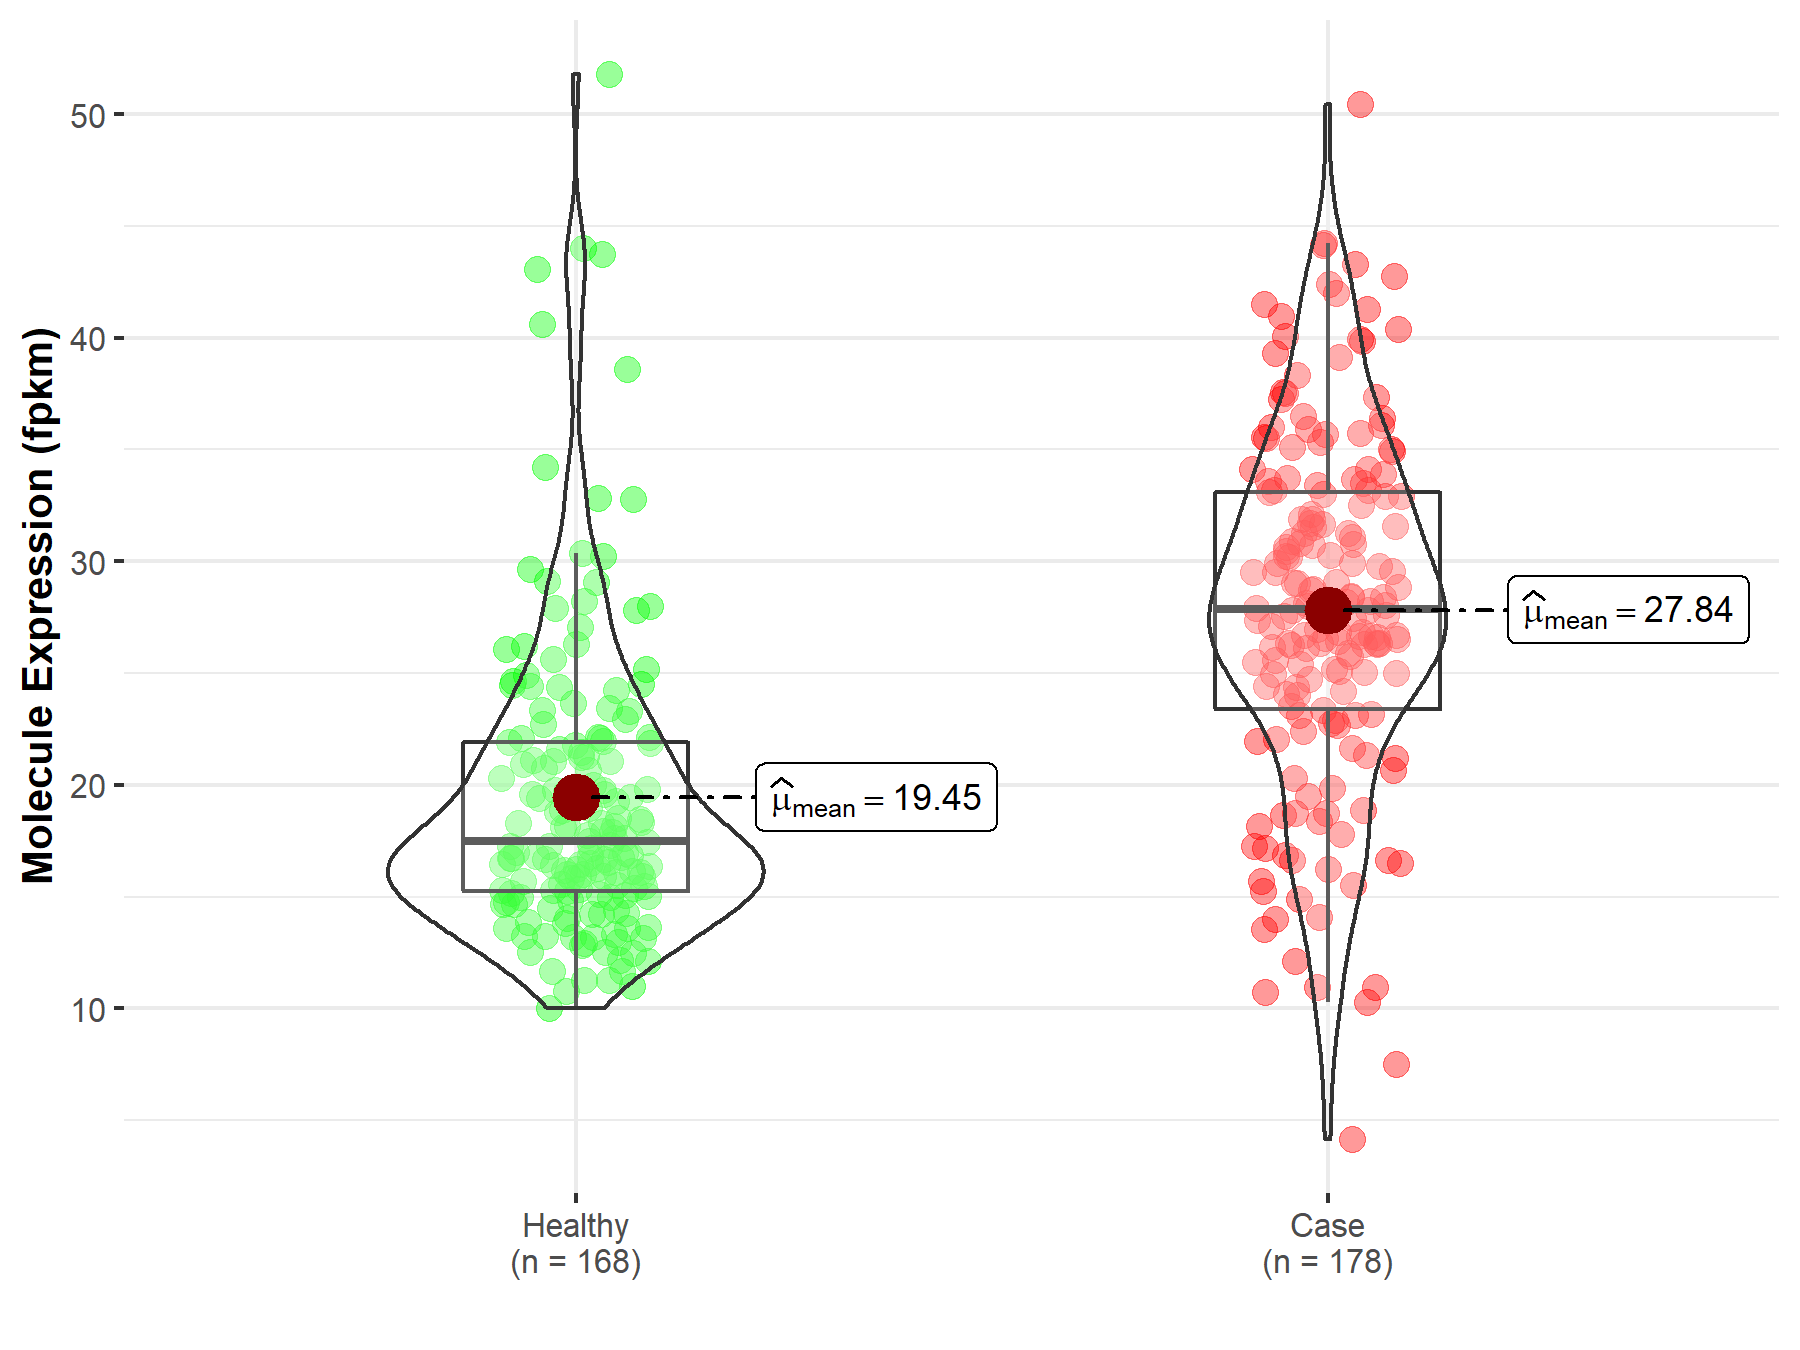
| Differential expression of molecule in resistant diseases | ||
| The Studied Tissue | Pancreas | |
| The Specified Disease | Pancreatic adenocarcinoma | |
| The Expression Level of Disease Section Compare with the Healthy Individual Tissue | p-value: 3.62E-22; Fold-change: -4.73E-02 | |
|
Molecule expression in the diseased tissue of patients
Molecule expression in the normal tissue of healthy individuals
|
||
| Disease-specific Molecule Abundances |
|
Click to View the Clearer Original Diagram |
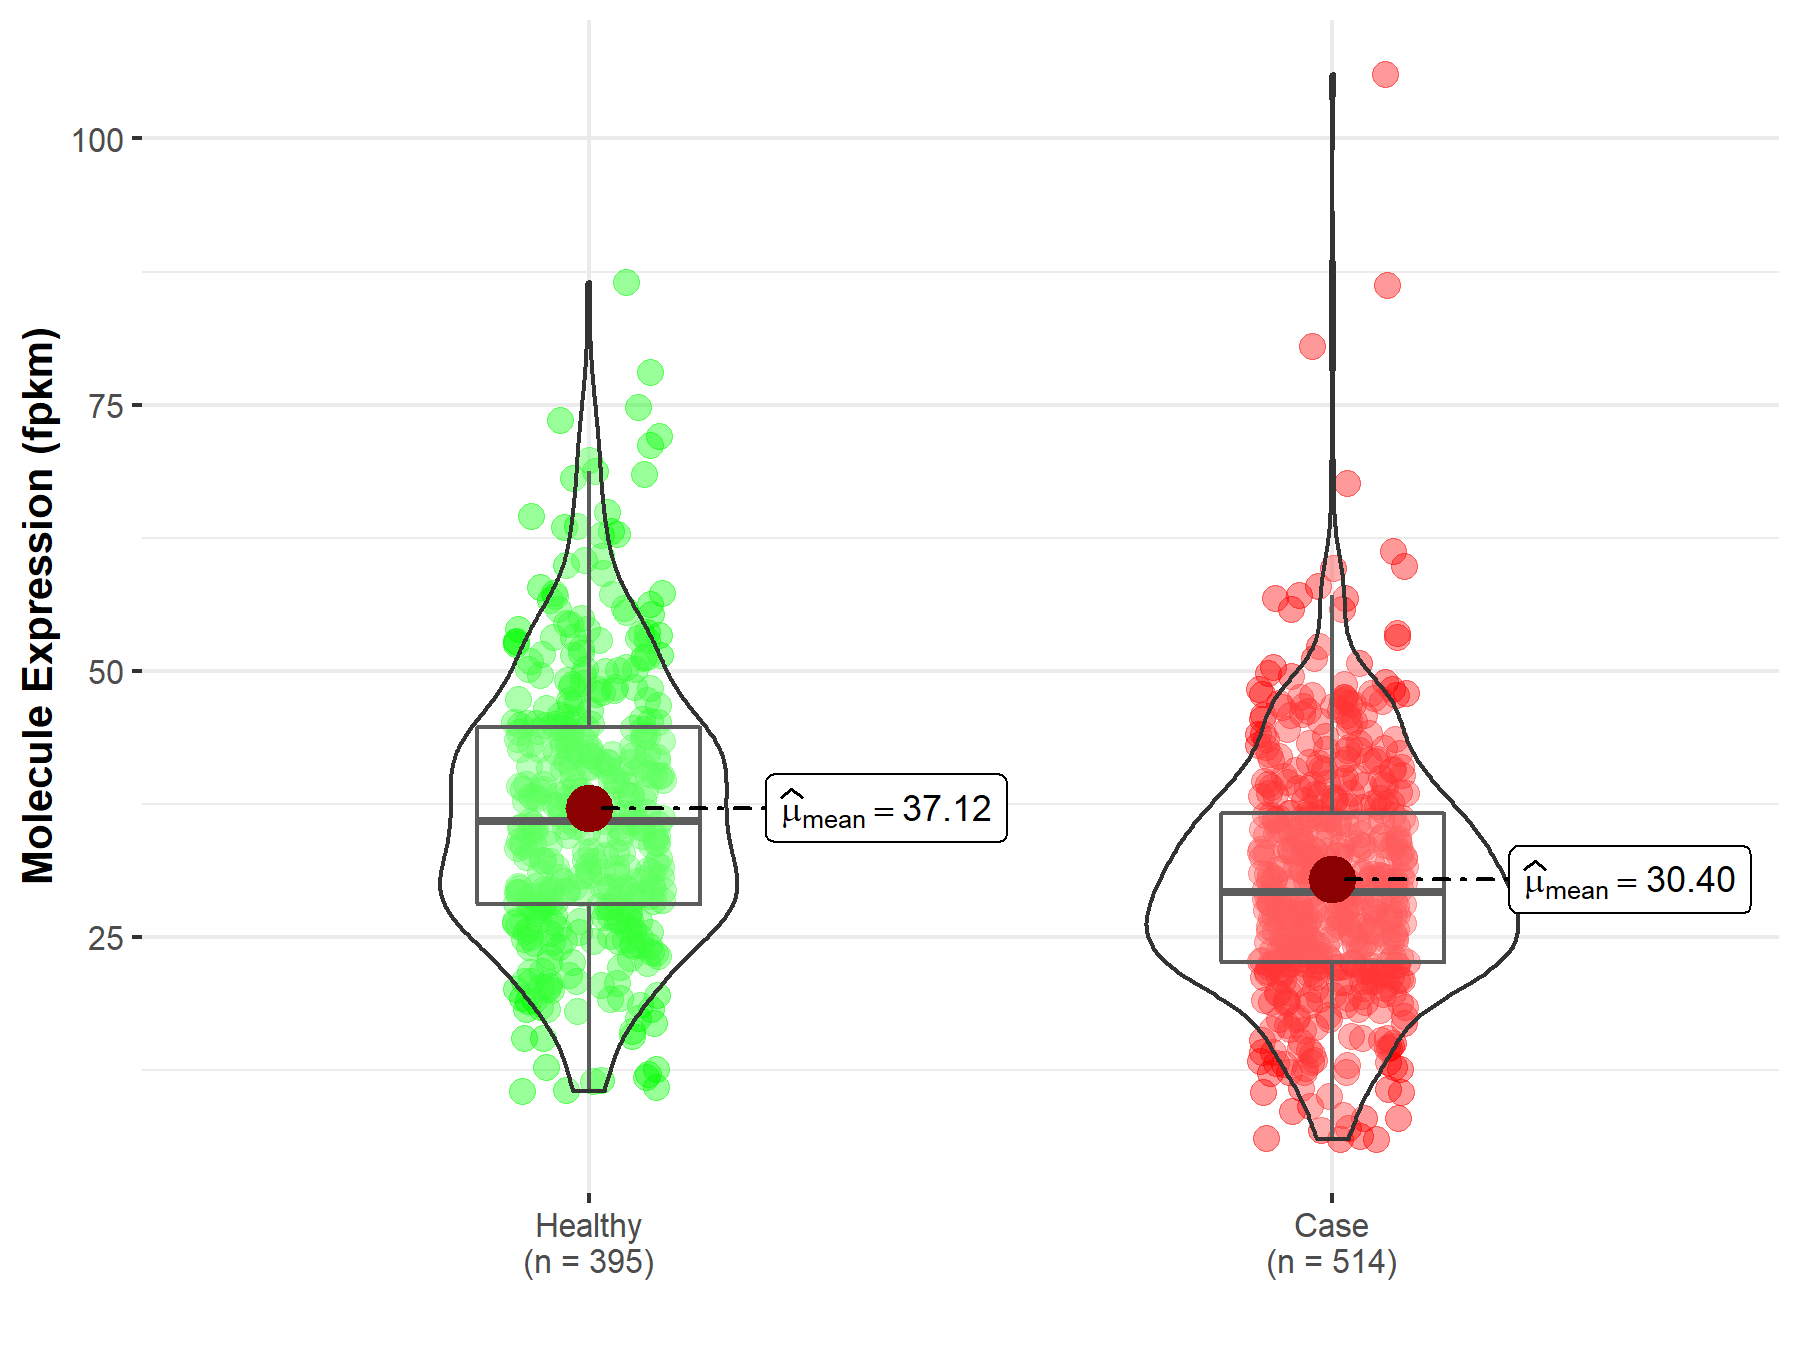
| Differential expression of molecule in resistant diseases | ||
| The Studied Tissue | Lung | |
| The Specified Disease | Lung adenocarcinoma | |
| The Expression Level of Disease Section Compare with the Healthy Individual Tissue | p-value: 9.33E-16; Fold-change: 2.56E-02 | |
|
Molecule expression in the diseased tissue of patients
Molecule expression in the normal tissue of healthy individuals
|
||
| Disease-specific Molecule Abundances |
|
Click to View the Clearer Original Diagram |
| The Studied Tissue | Lung | |
| The Specified Disease | Lung squamous cell carcinoma | |
| The Expression Level of Disease Section Compare with the Healthy Individual Tissue | p-value: 5.06E-01; Fold-change: -2.19E-03 | |
|
Molecule expression in the diseased tissue of patients
Molecule expression in the normal tissue of healthy individuals
|
||
| Disease-specific Molecule Abundances |
|
Click to View the Clearer Original Diagram |
Tissue-specific Molecule Abundances in Healthy Individuals

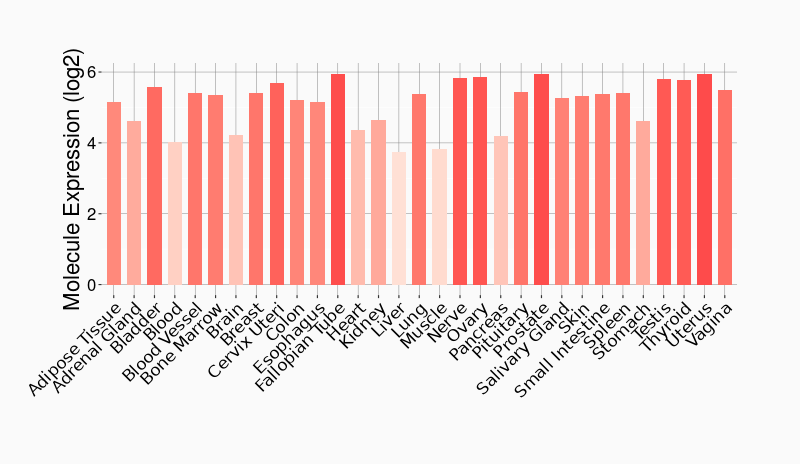
|
||
References
If you find any error in data or bug in web service, please kindly report it to Dr. Sun and Dr. Yu.