Molecule Information
General Information of the Molecule (ID: Mol00005)
| Name |
ATP-binding cassette sub-family G2 (ABCG2)
,Homo sapiens
|
||||
|---|---|---|---|---|---|
| Molecule Type |
Protein
|
||||
| Gene Name |
ABCG2
|
||||
| Gene ID | |||||
| Location |
chr4:88090150-88231628[-]
|
||||
| Sequence |
MSSSNVEVFIPVSQGNTNGFPATASNDLKAFTEGAVLSFHNICYRVKLKSGFLPCRKPVE
KEILSNINGIMKPGLNAILGPTGGGKSSLLDVLAARKDPSGLSGDVLINGAPRPANFKCN SGYVVQDDVVMGTLTVRENLQFSAALRLATTMTNHEKNERINRVIQELGLDKVADSKVGT QFIRGVSGGERKRTSIGMELITDPSILFLDEPTTGLDSSTANAVLLLLKRMSKQGRTIIF SIHQPRYSIFKLFDSLTLLASGRLMFHGPAQEALGYFESAGYHCEAYNNPADFFLDIING DSTAVALNREEDFKATEIIEPSKQDKPLIEKLAEIYVNSSFYKETKAELHQLSGGEKKKK ITVFKEISYTTSFCHQLRWVSKRSFKNLLGNPQASIAQIIVTVVLGLVIGAIYFGLKNDS TGIQNRAGVLFFLTTNQCFSSVSAVELFVVEKKLFIHEYISGYYRVSSYFLGKLLSDLLP MRMLPSIIFTCIVYFMLGLKPKADAFFVMMFTLMMVAYSASSMALAIAAGQSVVSVATLL MTICFVFMMIFSGLLVNLTTIASWLSWLQYFSIPRYGFTALQHNEFLGQNFCPGLNATGN NPCNYATCTGEEYLVKQGIDLSPWGLWKNHVALACMIVIFLTIAYLKLLFLKKYS Click to Show/Hide
|
||||
| 3D-structure |
|
||||
| Function |
Broad substrate specificity ATP-dependent transporter of the ATP-binding cassette (ABC) family that actively extrudes a wide variety of physiological compounds, dietary toxins and xenobiotics from cells. Involved in porphyrin homeostasis, mediating the export of protoporphyrin IX (PPIX) from both mitochondria to cytosol and cytosol to extracellular space, it also functions in the cellular export of heme. Also mediates the efflux of sphingosine-1-P from cells. Acts as a urate exporter functioning in both renal and extrarenal urate excretion. In kidney, it also functions as a physiological exporter of the uremic toxin indoxyl sulfate. Also involved in the excretion of steroids like estrone 3-sulfate/E1S, 3beta-sulfooxy-androst-5-en-17-one/DHEAS, and other sulfate conjugates. Mediates the secretion of the riboflavin and biotin vitamins into milk. Extrudes pheophorbide a, a phototoxic porphyrin catabolite of chlorophyll, reducing its bioavailability. Plays an important role in the exclusion of xenobiotics from the brain (Probable). It confers to cells a resistance to multiple drugs and other xenobiotics including mitoxantrone, pheophorbide, camptothecin, methotrexate, azidothymidine, and the anthracyclines daunorubicin and doxorubicin, through the control of their efflux. In placenta, it limits the penetration of drugs from the maternal plasma into the fetus. May play a role in early stem cell self-renewal by blocking differentiation.
Click to Show/Hide
|
||||
| Uniprot ID | |||||
| Ensembl ID | |||||
| HGNC ID | |||||
| Click to Show/Hide the Complete Species Lineage | |||||
Type(s) of Resistant Mechanism of This Molecule
Drug Resistance Data Categorized by Drug
Approved Drug(s)
28 drug(s) in total
| Drug Sensitivity Data Categorized by Their Corresponding Mechanisms | ||||
|
|
||||
| Disease Class: Glioblastoma [ICD-11: 2A00.02] | [1] | |||
| Sensitive Disease | Glioblastoma [ICD-11: 2A00.02] | |||
| Sensitive Drug | Perphenazine | |||
| Molecule Alteration | Expression | Up-regulation |
||
| Differential expression of the molecule in resistant disease | ||||
| Classification of Disease | Brain cancer [ICD-11: 2A00] | |||
| The Specified Disease | Glioblastoma | |||
| The Studied Tissue | Nervous tissue | |||
| The Expression Level of Disease Section Compare with the Healthy Individual Tissue | p-value: 1.18E-01 Fold-change: 2.37E-01 Z-score: 1.69E+00 |
|||
| Experimental Note | Revealed Based on the Cell Line Data | |||
| Cell Pathway Regulation | Cell migration | Inhibition | hsa04670 | |
| Cell invasion | Inhibition | hsa05200 | ||
| In Vitro Model | SHI-1 cells | Bone marrow | Homo sapiens (Human) | CVCL_2191 |
| Experiment for Molecule Alteration |
Western blot analysis | |||
| Mechanism Description | The present study explored the effects of perphenazine and prochlorperazine on the levels of ABCB1, ABCG2, E-cadherin, alpha-tubulin and integrins (alpha3, alpha5, and beta1), as well as on the migratory and invasive ability of U87-MG cells. The results suggested that perphenazine and prochlorperazine may modulate the expression levels of multidrug resistance proteins (they decreased ABCB1 and increased ABCG2 expression), E-cadherin, alpha-tubulin and integrins, and could impair the migration and invasion of U-87 MG cells. | |||
| Drug Sensitivity Data Categorized by Their Corresponding Mechanisms | ||||
|
|
||||
| Disease Class: Glioblastoma [ICD-11: 2A00.02] | [1] | |||
| Sensitive Disease | Glioblastoma [ICD-11: 2A00.02] | |||
| Sensitive Drug | Prochlorperazine | |||
| Molecule Alteration | Expression | Up-regulation |
||
| Differential expression of the molecule in resistant disease | ||||
| Classification of Disease | Brain cancer [ICD-11: 2A00] | |||
| The Specified Disease | Glioblastoma | |||
| The Studied Tissue | Nervous tissue | |||
| The Expression Level of Disease Section Compare with the Healthy Individual Tissue | p-value: 1.18E-01 Fold-change: 2.37E-01 Z-score: 1.69E+00 |
|||
| Experimental Note | Revealed Based on the Cell Line Data | |||
| Cell Pathway Regulation | Cell invasion | Inhibition | hsa05200 | |
| Cell migration | Inhibition | hsa04670 | ||
| In Vitro Model | SHI-1 cells | Bone marrow | Homo sapiens (Human) | CVCL_2191 |
| Experiment for Molecule Alteration |
Western blot analysis; RNA-sequencing analysis | |||
| Experiment for Drug Resistance |
Wound healing assay;Transwell assay | |||
| Mechanism Description | Prochlorperazine may modulate the expression levels of multidrug resistance proteins (they decreased ABCB1 and increased ABCG2 expression), E-cadherin, alpha-tubulin and integrins, and could impair the migration and invasion of U-87 MG cells. | |||
| Drug Resistance Data Categorized by Their Corresponding Mechanisms | ||||
|
|
||||
| Disease Class: Malignant glioma [ICD-11: 2A00.2] | [2] | |||
| Resistant Disease | Malignant glioma [ICD-11: 2A00.2] | |||
| Resistant Drug | Temozolomide | |||
| Molecule Alteration | Expression | Up-regulation |
||
| Differential expression of the molecule in resistant disease | ||||
| Classification of Disease | Brain cancer [ICD-11: 2A00] | |||
| The Specified Disease | Malignant glioma | |||
| The Studied Tissue | Nervous tissue | |||
| The Expression Level of Disease Section Compare with the Healthy Individual Tissue | p-value: 1.18E-01 Fold-change: 2.37E-01 Z-score: 1.69E+00 |
|||
| Experimental Note | Revealed Based on the Cell Line Data | |||
| Cell Pathway Regulation | Cell apoptosis | Activation | hsa04210 | |
| In Vitro Model | U251 cells | Brain | Homo sapiens (Human) | CVCL_0021 |
| U87 cells | Brain | Homo sapiens (Human) | CVCL_0022 | |
| In Vivo Model | Nude mouse xenograft model | Mus musculus | ||
| Experiment for Molecule Alteration |
Western blot analysis | |||
| Experiment for Drug Resistance |
MTT assay; Flow cytometry assay | |||
| Mechanism Description | Knockdown of long noncoding RNA H19 sensitizes human glioma cells to temozolomide therapy.the expression level of H19 transcripts was increased compared to wild-type or nonresistant clones.Furthermore, the reduced expression of H19 altered major drug resistance genes, such as ABCB1 (MDR1), ABCC (MRP), and ABCG2 (BCRP), both at the mRNA and protein levels. Taken together, these findings suggest that H19 plays an important role in the development of TMZ resistance, and may represent a novel therapeutic target for TMZ-resistant gliomas.Our results suggested that knockdown of H19 significantly downregulated the expression of these drug-resistant genes, both at the mRNA (P<0.001 vs respective control siRNA) and protein levels. These data confirm that the H19-induced TMZ resistance is in part mediated by MDR, MRP, and ABCG2. | |||
| Drug Resistance Data Categorized by Their Corresponding Mechanisms | ||||
|
|
||||
| Disease Class: Oral cancer [ICD-11: 2B6E.1] | [3] | |||
| Resistant Disease | Oral cancer [ICD-11: 2B6E.1] | |||
| Resistant Drug | Cisplatin | |||
| Molecule Alteration | Expression | Up-regulation |
||
| Differential expression of the molecule in resistant disease | ||||
| Classification of Disease | Oral squamous cell carcinoma [ICD-11: 2B6E] | |||
| The Specified Disease | Oral cancer | |||
| The Studied Tissue | Oral tissue | |||
| The Expression Level of Disease Section Compare with the Healthy Individual Tissue | p-value: 1.32E-01 Fold-change: 5.64E-02 Z-score: 1.54E+00 |
|||
| Experimental Note | Revealed Based on the Cell Line Data | |||
| In Vitro Model | UM-SCC-1 cells | Ovary | Homo sapiens (Human) | CVCL_7707 |
| WSU-HN30 cells | Pleural effusion | Homo sapiens (Human) | CVCL_5525 | |
| WSU-HN6 cells | Urinary bladder | Homo sapiens (Human) | CVCL_5516 | |
| Experiment for Molecule Alteration |
qRT-PCR; Western blotting assay | |||
| Experiment for Drug Resistance |
MTT assay | |||
| Mechanism Description | E-cigarette aerosol exposure alters the expression of drug influx and efflux transporters.Among the other drug efflux ATPase genes previously reported to contribute to cisplatin resistance ABCG2, ABCC2, ABCA1, and ABCC1 were significantly up-regulated in at least one cell line. | |||
| Disease Class: Sarcoma [ICD-11: 2C35.0] | [4] | |||
| Resistant Disease | Sarcoma [ICD-11: 2C35.0] | |||
| Resistant Drug | Cisplatin | |||
| Molecule Alteration | Expression | Up-regulation |
||
| Differential expression of the molecule in resistant disease | ||||
| Classification of Disease | Sarcoma [ICD-11: 2C35] | |||
| The Specified Disease | Sarcoma | |||
| The Studied Tissue | Muscle tissue | |||
| The Expression Level of Disease Section Compare with the Healthy Individual Tissue | p-value: 7.58E-56 Fold-change: 2.30E-01 Z-score: 1.68E+01 |
|||
| Experimental Note | Revealed Based on the Cell Line Data | |||
| In Vitro Model | SW-872 cells | Skin | Homo sapiens (Human) | CVCL_1730 |
| SW-1353 cells | Brain | Homo sapiens (Human) | CVCL_0543 | |
| TE-671 cells | Peripheral blood | Homo sapiens (Human) | CVCL_1756 | |
| SW-684 cells | Skin | Homo sapiens (Human) | CVCL_1726 | |
| SW-982 cells | Testicular | Homo sapiens (Human) | CVCL_1734 | |
| Experiment for Molecule Alteration |
Western blot analysis | |||
| Experiment for Drug Resistance |
MTS assay | |||
| Mechanism Description | By investigating of important regulators of stem cell biology, real-time RT-PCR data showed an increased expression of c-Myc, beta-catenin, and SOX-2 in the ALDH1high population and a significant higher level of ABCG2. Statistical analysis of data demonstrated that ALDH1high cells of SW-982 and SW-1353 showed higher resistance to commonly used chemotherapeutic agents like doxorubicin, epirubicin, and cisplatin than ALDH1low cells. This study demonstrates that in different sarcoma cell lines, high ALDH1 activity can be used to identify a subpopulation of cells characterized by a significantly higher proliferation rate, increased colony forming, increased expression of ABC transporter genes and stemness markers compared to control cells. In addition, enhanced drug resistance was demonstrated. | |||
| Disease Class: Breast cancer [ICD-11: 2C60.3] | [15] | |||
| Resistant Disease | Breast cancer [ICD-11: 2C60.3] | |||
| Resistant Drug | Cisplatin | |||
| Molecule Alteration | Expression | Up-regulation |
||
| Experimental Note | Revealed Based on the Cell Line Data | |||
| Cell Pathway Regulation | Cell cycle | Activation | hsa04110 | |
| Cell proliferation | Activation | hsa05200 | ||
| In Vitro Model | MCF-7 cells | Breast | Homo sapiens (Human) | CVCL_0031 |
| MDA-MB-231 cells | Breast | Homo sapiens (Human) | CVCL_0062 | |
| Experiment for Molecule Alteration |
Western blot analysis | |||
| Experiment for Drug Resistance |
MTT assay | |||
| Mechanism Description | miR-106a promotes breast cancer cell proliferation and invasion through upregulation of Bcl-2, ABCG2, and P53, and downregulation of Bax and RUNX3. | |||
| Drug Sensitivity Data Categorized by Their Corresponding Mechanisms | ||||
|
|
||||
| Disease Class: Gastric cancer [ICD-11: 2B72.1] | [16] | |||
| Sensitive Disease | Gastric cancer [ICD-11: 2B72.1] | |||
| Sensitive Drug | Cisplatin | |||
| Molecule Alteration | Expression | Down-regulation |
||
| Experimental Note | Revealed Based on the Cell Line Data | |||
| Cell Pathway Regulation | SIRT1/CREB/ABCG2 signaling pathway | Regulation | N.A. | |
| In Vitro Model | MkN-45 cells | Gastric | Homo sapiens (Human) | CVCL_0434 |
| MkN28 cells | Gastric | Homo sapiens (Human) | CVCL_1416 | |
| In Vivo Model | Nude mouse xenograft model | Mus musculus | ||
| Experiment for Molecule Alteration |
Western blot analysis | |||
| Experiment for Drug Resistance |
CCK8 assay | |||
| Mechanism Description | Upregulated miR132 in Lgr5+ gastric cancer stem cell-like cells contributes to cisplatin-resistance via SIRT1/CREB/ABCG2 signaling pathway. Overexpression of SIRT1 down-regulated ABCG2 expression by promoting the de-acetylation of the transcription factor CREB. CREB was further activated ABCG2 via binding to the promoter of ABCG2 to induce transcription. | |||
| Disease Class: Retinoblastoma [ICD-11: 2D02.2] | [5] | |||
| Sensitive Disease | Retinoblastoma [ICD-11: 2D02.2] | |||
| Sensitive Drug | Cisplatin | |||
| Molecule Alteration | Expression | Down-regulation |
||
| Experimental Note | Revealed Based on the Cell Line Data | |||
| Cell Pathway Regulation | Cell apoptosis | Activation | hsa04210 | |
| Cell proliferation | Inhibition | hsa05200 | ||
| In Vitro Model | WERI-Rb-1 cells | Retina | Homo sapiens (Human) | CVCL_1792 |
| In Vivo Model | Nude mouse xenograft model | Mus musculus | ||
| Experiment for Molecule Alteration |
Western blot analysis | |||
| Experiment for Drug Resistance |
CCK8 assay | |||
| Mechanism Description | Silencing of ABCG2 by MicroRNA-3163 inhibits multidrug resistance in retinoblastoma cancer stem cells. | |||
| Drug Sensitivity Data Categorized by Their Corresponding Mechanisms | ||||
|
|
||||
| Disease Class: Retinoblastoma [ICD-11: 2D02.2] | [5] | |||
| Sensitive Disease | Retinoblastoma [ICD-11: 2D02.2] | |||
| Sensitive Drug | Etoposide | |||
| Molecule Alteration | Expression | Down-regulation |
||
| Differential expression of the molecule in resistant disease | ||||
| Classification of Disease | Retina cancer [ICD-11: 2D02] | |||
| The Specified Disease | Retinoblastoma tumor | |||
| The Studied Tissue | Uvea | |||
| The Expression Level of Disease Section Compare with the Healthy Individual Tissue | p-value: 1.43E-02 Fold-change: -1.35E-01 Z-score: -2.66E+00 |
|||
| Experimental Note | Revealed Based on the Cell Line Data | |||
| Cell Pathway Regulation | Cell apoptosis | Activation | hsa04210 | |
| Cell proliferation | Inhibition | hsa05200 | ||
| In Vitro Model | WERI-Rb-1 cells | Retina | Homo sapiens (Human) | CVCL_1792 |
| In Vivo Model | Nude mouse xenograft model | Mus musculus | ||
| Experiment for Molecule Alteration |
Western blot analysis | |||
| Experiment for Drug Resistance |
CCK8 assay | |||
| Mechanism Description | Silencing of ABCG2 by MicroRNA-3163 inhibits multidrug resistance in retinoblastoma cancer stem cells. | |||
| Drug Sensitivity Data Categorized by Their Corresponding Mechanisms | ||||
|
|
||||
| Disease Class: Hyperlipidemia [ICD-11: 5C80.Z] | [6], [7] | |||
| Sensitive Disease | Hyperlipidemia [ICD-11: 5C80.Z] | |||
| Sensitive Drug | Rosuvastatin | |||
| Molecule Alteration | Expression | Down-regulation |
||
| Differential expression of the molecule in resistant disease | ||||
| Classification of Disease | Hyperlipoproteinaemia [ICD-11: 5C80] | |||
| The Specified Disease | Familial hypercholesterolemia | |||
| The Studied Tissue | Whole blood | |||
| The Expression Level of Disease Section Compare with the Healthy Individual Tissue | p-value: 2.28E-08 Fold-change: -1.96E-01 Z-score: -6.59E+00 |
|||
| Experimental Note | Identified from the Human Clinical Data | |||
| Experiment for Molecule Alteration |
qPCR | |||
| Mechanism Description | Enasidenib (and its metabolite, AGI-16903) at clinically relevant concentrations has effects on multiple drug metabolic enzymes and transporters, including inhibition of P-gp, BCRP, OATP1B1, and OATP1B3 transporters. When a single dose of rosuvastatin was administered together with 28 days of dosing of enasidenib, the AUC0-30 and AUC0-inf of rosuvastatin increased by =249% and 244%, respectively; and the Cmax increased by 366%, when compared to the single dose of rosuvastatin administered alone. | |||
| Drug Sensitivity Data Categorized by Their Corresponding Mechanisms | ||||
|
|
||||
| Disease Class: Liver cancer [ICD-11: 2C12.6] | [8] | |||
| Sensitive Disease | Liver cancer [ICD-11: 2C12.6] | |||
| Sensitive Drug | Doxorubicin | |||
| Molecule Alteration | Expression | Down-regulation |
||
| Differential expression of the molecule in resistant disease | ||||
| Classification of Disease | Liver cancer [ICD-11: 2C12] | |||
| The Specified Disease | Liver cancer | |||
| The Studied Tissue | Liver tissue | |||
| The Expression Level of Disease Section Compare with the Healthy Individual Tissue | p-value: 9.85E-09 Fold-change: -2.21E-01 Z-score: -6.58E+00 |
|||
| Experimental Note | Revealed Based on the Cell Line Data | |||
| In Vitro Model | HepG2 cells | Liver | Homo sapiens (Human) | CVCL_0027 |
| Experiment for Molecule Alteration |
RT-PCR | |||
| Experiment for Drug Resistance |
MTT assay | |||
| Mechanism Description | Synergistic interaction between the MDR mechanisms include ABCT proteins (P-gp, BCRP, and MDR1) and metabolic enzymes of phase I of metabolism mainly CYP3A4, phase II of metabolism mainly GST was observed. In this study, FUC alone and in combination with DOX inhibited the enzyme activities of CYP3A4 and GST and down regulated their genes. We interpret this effect as a consequence of a down-regulation of pregnane X receptor (PXR) gene. FUC overcame MDR by significantly suppressing PXR mediated pathways that regulated the expression of CYP3A and ABCB1 genes in HepG-2 cells. | |||
| Disease Class: Ovarian cancer [ICD-11: 2C73.0] | [8] | |||
| Sensitive Disease | Ovarian cancer [ICD-11: 2C73.0] | |||
| Sensitive Drug | Doxorubicin | |||
| Molecule Alteration | Expression | Down-regulation |
||
| Differential expression of the molecule in resistant disease | ||||
| Classification of Disease | Ovarian cancer [ICD-11: 2C73] | |||
| The Specified Disease | Ovarian cancer | |||
| The Studied Tissue | Ovarian tissue | |||
| The Expression Level of Disease Section Compare with the Healthy Individual Tissue | p-value: 1.76E-03 Fold-change: -2.41E-01 Z-score: -4.53E+00 |
|||
| Experimental Note | Revealed Based on the Cell Line Data | |||
| In Vitro Model | SkOV3 cells | Ovary | Homo sapiens (Human) | CVCL_0532 |
| Experiment for Molecule Alteration |
RT-PCR | |||
| Experiment for Drug Resistance |
MTT assay | |||
| Mechanism Description | Synergistic interaction between the MDR mechanisms include ABCT proteins (P-gp, BCRP, and MDR1) and metabolic enzymes of phase I of metabolism mainly CYP3A4, phase II of metabolism mainly GST was observed. In this study, FUC alone and in combination with DOX inhibited the enzyme activities of CYP3A4 and GST and down regulated their genes. We interpret this effect as a consequence of a down-regulation of pregnane X receptor (PXR) gene. FUC overcame MDR by significantly suppressing PXR mediated pathways that regulated the expression of CYP3A and ABCB1 genes in HepG-2 cells. | |||
| Disease Class: Lung cancer [ICD-11: 2C25.5] | [9] | |||
| Sensitive Disease | Lung cancer [ICD-11: 2C25.5] | |||
| Sensitive Drug | Doxorubicin | |||
| Molecule Alteration | Expression | Down-regulation |
||
| Differential expression of the molecule in resistant disease | ||||
| Classification of Disease | Lung cancer [ICD-11: 2C25] | |||
| The Specified Disease | Lung cancer | |||
| The Studied Tissue | Lung tissue | |||
| The Expression Level of Disease Section Compare with the Healthy Individual Tissue | p-value: 3.87E-47 Fold-change: -2.59E-01 Z-score: -1.76E+01 |
|||
| Experimental Note | Revealed Based on the Cell Line Data | |||
| Cell Pathway Regulation | AKT/ERK signaling pathway | Inhibition | hsa04010 | |
| Cell apoptosis | Activation | hsa04210 | ||
| Cell invasion | Inhibition | hsa05200 | ||
| Cell migration | Inhibition | hsa04670 | ||
| Cell proliferation | Inhibition | hsa05200 | ||
| In Vitro Model | A549 cells | Lung | Homo sapiens (Human) | CVCL_0023 |
| In Vivo Model | Nude mouse xenograft model | Mus musculus | ||
| Experiment for Molecule Alteration |
qRT-PCR; Western blot analysis | |||
| Experiment for Drug Resistance |
MTT assay | |||
| Mechanism Description | Suppression of miR-155 in this cell line considerably reversed doxorubicin resistance, and doxorubicin-induced apoptosis and cell cycle arrest were recovered. Furthermore, reverse transcription-polymerase chain reaction and western blot analysis revealed that miR-155 suppression downregulated the expression of multidrug resistance protein 1, multidrug resistance-associated protein 1, breast cancer resistance protein, glutathione S-transferase-Pi, Survivin and B-cell lymphoma 2, and upregulated the expression of caspase-3 and caspase-8. In addition, it was found that miR-155 suppression inhibited the activation of AkT and extracellular signal-regulated kinase. The transcriptional activity of nuclear factor-kB and activator protein-1 was also downregulated. | |||
| Disease Class: Retinoblastoma [ICD-11: 2D02.2] | [5] | |||
| Sensitive Disease | Retinoblastoma [ICD-11: 2D02.2] | |||
| Sensitive Drug | Doxorubicin | |||
| Molecule Alteration | Expression | Down-regulation |
||
| Experimental Note | Revealed Based on the Cell Line Data | |||
| Cell Pathway Regulation | Cell apoptosis | Activation | hsa04210 | |
| Cell proliferation | Inhibition | hsa05200 | ||
| In Vitro Model | WERI-Rb-1 cells | Retina | Homo sapiens (Human) | CVCL_1792 |
| In Vivo Model | Nude mouse xenograft model | Mus musculus | ||
| Experiment for Molecule Alteration |
Western blot analysis | |||
| Experiment for Drug Resistance |
CCK8 assay | |||
| Mechanism Description | Silencing of ABCG2 by MicroRNA-3163 inhibits multidrug resistance in retinoblastoma cancer stem cells. | |||
| Disease Class: Breast cancer [ICD-11: 2C60.3] | [8] | |||
| Sensitive Disease | Breast cancer [ICD-11: 2C60.3] | |||
| Sensitive Drug | Doxorubicin | |||
| Molecule Alteration | Expression | Down-regulation |
||
| Experimental Note | Revealed Based on the Cell Line Data | |||
| In Vitro Model | MCF-7 cells | Breast | Homo sapiens (Human) | CVCL_0031 |
| Experiment for Molecule Alteration |
RT-PCR | |||
| Experiment for Drug Resistance |
MTT assay | |||
| Mechanism Description | Synergistic interaction between the MDR mechanisms include ABCT proteins (P-gp, BCRP, and MDR1) and metabolic enzymes of phase I of metabolism mainly CYP3A4, phase II of metabolism mainly GST was observed. In this study, FUC alone and in combination with DOX inhibited the enzyme activities of CYP3A4 and GST and down regulated their genes. We interpret this effect as a consequence of a down-regulation of pregnane X receptor (PXR) gene. FUC overcame MDR by significantly suppressing PXR mediated pathways that regulated the expression of CYP3A and ABCB1 genes in HepG-2 cells. | |||
| Disease Class: Chronic myeloid leukemia [ICD-11: 2A20.0] | [13] | |||
| Sensitive Disease | Chronic myeloid leukemia [ICD-11: 2A20.0] | |||
| Sensitive Drug | Doxorubicin | |||
| Molecule Alteration | Expression | Down-regulation |
||
| Experimental Note | Revealed Based on the Cell Line Data | |||
| Cell Pathway Regulation | p-glycoprotein | Regulation | N.A. | |
| In Vitro Model | K562 cells | Blood | Homo sapiens (Human) | CVCL_0004 |
| K562 ABCG2 overexpression cells | Bone marrow | Homo sapiens (Human) | N.A. | |
| Experiment for Molecule Alteration |
Western blot assay | |||
| Experiment for Drug Resistance |
Cell viability assay; Flow Cytometry assay; DNA dye competition assay | |||
| Mechanism Description | Induction of DNA double-strand breaks and chromatin damage through histone eviction;Less affected by ABCG2-mediated drug export. | |||
| Drug Resistance Data Categorized by Their Corresponding Mechanisms | ||||
|
|
||||
| Disease Class: Esophageal cancer [ICD-11: 2B70.1] | [20] | |||
| Resistant Disease | Esophageal cancer [ICD-11: 2B70.1] | |||
| Resistant Drug | Doxorubicin | |||
| Molecule Alteration | Expression | Up-regulation |
||
| Experimental Note | Revealed Based on the Cell Line Data | |||
| Cell Pathway Regulation | Cell apoptosis | Inhibition | hsa04210 | |
| Cell viability | Activation | hsa05200 | ||
| In Vitro Model | ECA-109 cells | Esophagus | Homo sapiens (Human) | CVCL_6898 |
| Experiment for Molecule Alteration |
Flow cytometry assay | |||
| Experiment for Drug Resistance |
MTT assay; Flow cytometry assay | |||
| Mechanism Description | Extracellular vesicles released by drug-resistant cells were proved that they could upregulate the expression of ABCG2 in esophageal cancer cells and thus regulate the drug resistance of esophageal cancer cells, which was related to the linc-VLDLR carried by EVs. | |||
| Disease Class: Hepatocellular cancer [ICD-11: 2C12.4] | [21] | |||
| Resistant Disease | Hepatocellular cancer [ICD-11: 2C12.4] | |||
| Resistant Drug | Doxorubicin | |||
| Molecule Alteration | Expression | Up-regulation |
||
| Experimental Note | Revealed Based on the Cell Line Data | |||
| Cell Pathway Regulation | Cell apoptosis | Inhibition | hsa04210 | |
| In Vitro Model | Huh-7 cells | Liver | Homo sapiens (Human) | CVCL_0336 |
| HepG2 cells | Liver | Homo sapiens (Human) | CVCL_0027 | |
| Hep3B cells | Liver | Homo sapiens (Human) | CVCL_0326 | |
| PLC/PRF-5 cells | Liver | Homo sapiens (Human) | CVCL_0485 | |
| In Vivo Model | Nude mouse xenograft model | Mus musculus | ||
| Experiment for Molecule Alteration |
Western blot analysis | |||
| Experiment for Drug Resistance |
MTS assay; Flow cytometry assay | |||
| Mechanism Description | LincRNA-VLDLR (linc-VLDLR) was significantly up-regulated in malignant hepatocytes. Exposure of HCC cells to diverse anti-cancer agents such as sorafenib, camptothecin, and doxorubicin increased linc-VLDLR expression in cells as well as within EVs released from these cells. Incubation with EVs reduced chemotherapy-induced cell death and also increased linc-VLDLR expression in recipient cells. RNAi-mediated knockdown of linc-VLDLR decreased cell viability and abrogated cell cycle progression. Moreover, knockdown of VLDLR reduced expression of ABCG2 (ATP-binding cassette, sub-family G member 2), whereas over-expression of this protein reduced the effects of VLDLR knockdown on sorafenib-induced cell death. Here, linc-VLDLR is identified as an extracellular vesicle enriched LncRNA that contributes to cellular stress responses. | |||
| Disease Class: Breast cancer [ICD-11: 2C60.3] | [18] | |||
| Resistant Disease | Breast cancer [ICD-11: 2C60.3] | |||
| Resistant Drug | Doxorubicin | |||
| Molecule Alteration | Expression | Up-regulation |
||
| Experimental Note | Revealed Based on the Cell Line Data | |||
| In Vitro Model | MCF-7 cells | Breast | Homo sapiens (Human) | CVCL_0031 |
| MCF-7/AdrVp cells | Breast | Homo sapiens (Human) | CVCL_4Y46 | |
| MCF-7/AdrVpPR cells | Breast | Homo sapiens (Human) | CVCL_4Y46 | |
| Experiment for Drug Resistance |
Flow cytometric assay | |||
| Mechanism Description | Enforced expression of the full-length BCRP cDNA in MCF-7 breast cancer cells confers resistance to mitoxantrone, doxorubicin, and daunorubicin, reduces daunorubicin accumulation and retention, and causes an ATP-dependent enhancement of the efflux of rhodamine 123 in the cloned transfected. | |||
| Disease Class: Sarcoma [ICD-11: 2C35.0] | [4] | |||
| Resistant Disease | Sarcoma [ICD-11: 2C35.0] | |||
| Resistant Drug | Doxorubicin | |||
| Molecule Alteration | Expression | Up-regulation |
||
| Experimental Note | Revealed Based on the Cell Line Data | |||
| In Vitro Model | SW-872 cells | Skin | Homo sapiens (Human) | CVCL_1730 |
| SW-1353 cells | Brain | Homo sapiens (Human) | CVCL_0543 | |
| TE-671 cells | Peripheral blood | Homo sapiens (Human) | CVCL_1756 | |
| SW-684 cells | Skin | Homo sapiens (Human) | CVCL_1726 | |
| SW-982 cells | Testicular | Homo sapiens (Human) | CVCL_1734 | |
| Experiment for Molecule Alteration |
Western blot analysis | |||
| Experiment for Drug Resistance |
MTS assay | |||
| Mechanism Description | By investigating of important regulators of stem cell biology, real-time RT-PCR data showed an increased expression of c-Myc, beta-catenin, and SOX-2 in the ALDH1high population and a significant higher level of ABCG2. Statistical analysis of data demonstrated that ALDH1high cells of SW-982 and SW-1353 showed higher resistance to commonly used chemotherapeutic agents like doxorubicin, epirubicin, and cisplatin than ALDH1low cells. This study demonstrates that in different sarcoma cell lines, high ALDH1 activity can be used to identify a subpopulation of cells characterized by a significantly higher proliferation rate, increased colony forming, increased expression of ABC transporter genes and stemness markers compared to control cells. In addition, enhanced drug resistance was demonstrated. | |||
| Drug Sensitivity Data Categorized by Their Corresponding Mechanisms | ||||
|
|
||||
| Disease Class: Breast cancer [ICD-11: 2C60.3] | [10] | |||
| Sensitive Disease | Breast cancer [ICD-11: 2C60.3] | |||
| Sensitive Drug | Glucosamine | |||
| Molecule Alteration | Expression | Down-regulation |
||
| Differential expression of the molecule in resistant disease | ||||
| Classification of Disease | Breast cancer [ICD-11: 2C60] | |||
| The Specified Disease | Breast cancer | |||
| The Studied Tissue | Breast tissue | |||
| The Expression Level of Disease Section Compare with the Healthy Individual Tissue | p-value: 1.46E-65 Fold-change: -3.29E-01 Z-score: -2.17E+01 |
|||
| Experimental Note | Revealed Based on the Cell Line Data | |||
| In Vitro Model | HCC827 cells | Lung | Homo sapiens (Human) | CVCL_2063 |
| MDA PCa 2b cells | Prostate | Homo sapiens (Human) | CVCL_4748 | |
| Experiment for Molecule Alteration |
Quantitative RT-PCR assay | |||
| Experiment for Drug Resistance |
MTT assay; Flow cytometry | |||
| Mechanism Description | This study was aimed at investigating the cytotoxicity and multi-drug resistance (MDR) reversal effect of Glucosamine (GlcN) on resistant BCRP-overexpressing breast cancer MCF-7/MX cells. These results proposed that glucosamine as a natural sugar could down regulate the BCRP expression and increased MX cytotoxicity in breast cancer cells. These results proposed that glucosamine as a natural sugar could down regulate the BCRP expression and increased MX cytotoxicity in breast cancer cells. | |||
| Drug Sensitivity Data Categorized by Their Corresponding Mechanisms | ||||
|
|
||||
| Disease Class: Colon cancer [ICD-11: 2B90.1] | [11] | |||
| Sensitive Disease | Colon cancer [ICD-11: 2B90.1] | |||
| Sensitive Drug | Fluorouracil | |||
| Molecule Alteration | Expression | Down-regulation |
||
| Differential expression of the molecule in resistant disease | ||||
| Classification of Disease | Colon cancer [ICD-11: 2B90] | |||
| The Specified Disease | Colon cancer | |||
| The Studied Tissue | Colon tissue | |||
| The Expression Level of Disease Section Compare with the Healthy Individual Tissue | p-value: 1.83E-95 Fold-change: -9.70E-01 Z-score: -4.32E+01 |
|||
| Experimental Note | Revealed Based on the Cell Line Data | |||
| In Vitro Model | CaCo2 cells | Colon | Homo sapiens (Human) | CVCL_0025 |
| SW1116 cells | Colon | Homo sapiens (Human) | CVCL_0544 | |
| In Vivo Model | HT-29 xenograft mouse model | Mus musculus | ||
| Experiment for Molecule Alteration |
Western blot analysis | |||
| Experiment for Drug Resistance |
Annexin V assay | |||
| Mechanism Description | The miR-142-3p was markedly decreased in coloncancer specimens, in which it was negatively correlated withthe expression of CD133, Lgr5, and ABCG2. Transfection of miR-142-3p mimics in colon cancer cells downregulated cyclin D1expression, induced G1phase cell cycle arrest, and elevatedthe sensitivity of the cells to 5-fluorouracil. Furthermore,OCT4 suppressed miR-142-3p, and hypomethylation of theOCT4promoter was associated with a reduction in miR-142-3p. | |||
| Drug Sensitivity Data Categorized by Their Corresponding Mechanisms | ||||
|
|
||||
| Disease Class: Retinoblastoma [ICD-11: 2D02.2] | [5] | |||
| Sensitive Disease | Retinoblastoma [ICD-11: 2D02.2] | |||
| Sensitive Drug | Carboplatin | |||
| Molecule Alteration | Expression | Down-regulation |
||
| Experimental Note | Revealed Based on the Cell Line Data | |||
| Cell Pathway Regulation | Cell apoptosis | Activation | hsa04210 | |
| Cell proliferation | Inhibition | hsa05200 | ||
| In Vitro Model | WERI-Rb-1 cells | Retina | Homo sapiens (Human) | CVCL_1792 |
| In Vivo Model | Nude mouse xenograft model | Mus musculus | ||
| Experiment for Molecule Alteration |
Western blot analysis | |||
| Experiment for Drug Resistance |
CCK8 assay | |||
| Mechanism Description | Silencing of ABCG2 by MicroRNA-3163 inhibits multidrug resistance in retinoblastoma cancer stem cells. | |||
| Drug Resistance Data Categorized by Their Corresponding Mechanisms | ||||
|
|
||||
| Disease Class: Rheumatoid arthritis [ICD-11: FA20.0] | [14] | |||
| Resistant Disease | Rheumatoid arthritis [ICD-11: FA20.0] | |||
| Resistant Drug | Celecoxib | |||
| Molecule Alteration | Expression | Up-regulation |
||
| Experimental Note | Identified from the Human Clinical Data | |||
| Mechanism Description | MTX is a substrate for eight ABC transporters. In vitro studies demonstrated that RAFLS treated with MTX had higher ABCB1 expression levels than controls, with a positive correlation between ABCB1 expression levels and RA treatment duration. In addition to MTX, other DMARDs (e.g. sulfasalazine, leflunomide, bucillamine, azathioprine), glucocorticoids (e.g. betamethasone, dexamethasone), and NSAIDs (e.g. celecoxib and indomethacin) are also substrates of ABC transporters. | |||
| Drug Resistance Data Categorized by Their Corresponding Mechanisms | ||||
|
|
||||
| Disease Class: Chronic myeloid leukemia [ICD-11: 2A20.0] | [17] | |||
| Resistant Disease | Chronic myeloid leukemia [ICD-11: 2A20.0] | |||
| Resistant Drug | Dasatinib | |||
| Molecule Alteration | Expression | Up-regulation |
||
| Experimental Note | Revealed Based on the Cell Line Data | |||
| In Vitro Model | K562-ABCG2 cells | Bone marrow | Homo sapiens (Human) | N.A. |
| Experiment for Molecule Alteration |
Western blot assay | |||
| Experiment for Drug Resistance |
CCK8 assay | |||
| Mechanism Description | Overexpression of ABCG2 on the membrane surface of CML cells contributes to decreased TKI efficacy. This study demonstrates for the first time that the concomitant use of febuxostat enhances the efficacy of dasatinib in patients with CML. This is at least, in part, by the inhibition of ABCG2-mediated dasatinib excretion from CML cells. | |||
| Drug Resistance Data Categorized by Their Corresponding Mechanisms | ||||
|
|
||||
| Disease Class: Breast cancer [ICD-11: 2C60.3] | [18] | |||
| Resistant Disease | Breast cancer [ICD-11: 2C60.3] | |||
| Resistant Drug | Daunorubicin | |||
| Molecule Alteration | Expression | Up-regulation |
||
| Experimental Note | Revealed Based on the Cell Line Data | |||
| In Vitro Model | MCF-7 cells | Breast | Homo sapiens (Human) | CVCL_0031 |
| MCF-7/AdrVp cells | Breast | Homo sapiens (Human) | CVCL_4Y46 | |
| Experiment for Molecule Alteration |
Northern blot analysis | |||
| Experiment for Drug Resistance |
Flow cytometric assay | |||
| Mechanism Description | The mRNA encodes a 663-aa member of the ATP-binding cassette superfamily of transporters that we term breast cancer resistance protein (BCRP). Enforced expression of the full-length BCRP cDNA in MCF-7 breast cancer cells confers resistance to mitoxantrone, doxorubicin, and daunorubicin, reduces daunorubicin accumulation and retention, and causes an ATP-dependent enhancement of the efflux of rhodamine 123 in the cloned transfected. | |||
| Drug Resistance Data Categorized by Their Corresponding Mechanisms | ||||
|
|
||||
| Disease Class: Breast cancer bone metastasis [ICD-11: 2E03.1] | [19] | |||
| Resistant Disease | Breast cancer bone metastasis [ICD-11: 2E03.1] | |||
| Resistant Drug | Docetaxel | |||
| Molecule Alteration | Expression | Up-regulation |
||
| Experimental Note | Revealed Based on the Cell Line Data | |||
| In Vitro Model | MCF-7 cells | Breast | Homo sapiens (Human) | CVCL_0031 |
| MDA-MB-231 cells | Breast | Homo sapiens (Human) | CVCL_0062 | |
| Experiment for Molecule Alteration |
RT-PCR | |||
| Experiment for Drug Resistance |
Flow cytometric | |||
| Mechanism Description | Studies have shown that resistance can occur from altered expression of apoptosis regulatory proteins (p53, Bcl-2), and overexpression of ATP binding cassette (ABC) transporters/ multidrug resistance-related proteins such as multidrug resistance-associated protein 1 (MRP1), ATP-binding cassette super-family G member 2 (ABCG2). | |||
| Drug Resistance Data Categorized by Their Corresponding Mechanisms | ||||
|
|
||||
| Disease Class: Sarcoma [ICD-11: 2C35.0] | [4] | |||
| Resistant Disease | Sarcoma [ICD-11: 2C35.0] | |||
| Resistant Drug | Epirubicin | |||
| Molecule Alteration | Expression | Up-regulation |
||
| Experimental Note | Revealed Based on the Cell Line Data | |||
| In Vitro Model | SW-872 cells | Skin | Homo sapiens (Human) | CVCL_1730 |
| SW-1353 cells | Brain | Homo sapiens (Human) | CVCL_0543 | |
| TE-671 cells | Peripheral blood | Homo sapiens (Human) | CVCL_1756 | |
| SW-684 cells | Skin | Homo sapiens (Human) | CVCL_1726 | |
| SW-982 cells | Testicular | Homo sapiens (Human) | CVCL_1734 | |
| Experiment for Molecule Alteration |
Western blot analysis | |||
| Experiment for Drug Resistance |
MTS assay | |||
| Mechanism Description | By investigating of important regulators of stem cell biology, real-time RT-PCR data showed an increased expression of c-Myc, beta-catenin, and SOX-2 in the ALDH1high population and a significant higher level of ABCG2. Statistical analysis of data demonstrated that ALDH1high cells of SW-982 and SW-1353 showed higher resistance to commonly used chemotherapeutic agents like doxorubicin, epirubicin, and cisplatin than ALDH1low cells. This study demonstrates that in different sarcoma cell lines, high ALDH1 activity can be used to identify a subpopulation of cells characterized by a significantly higher proliferation rate, increased colony forming, increased expression of ABC transporter genes and stemness markers compared to control cells. In addition, enhanced drug resistance was demonstrated. | |||
| Drug Resistance Data Categorized by Their Corresponding Mechanisms | ||||
|
|
||||
| Disease Class: Natural killer/T-cell lymphoma [ICD-11: 2A90.2] | [22] | |||
| Resistant Disease | Natural killer/T-cell lymphoma [ICD-11: 2A90.2] | |||
| Resistant Drug | Gemcitabine | |||
| Molecule Alteration | Expression | Up-regulation |
||
| Experimental Note | Revealed Based on the Cell Line Data | |||
| In Vitro Model | SNK-6 cells | Oral | Homo sapiens (Human) | CVCL_A673 |
| In Vivo Model | Balb/c athymic nude mouse xenograft model | Mus musculus | ||
| Experiment for Molecule Alteration |
Western blot analysis | |||
| Experiment for Drug Resistance |
CCK8 assay | |||
| Mechanism Description | ABCG2 upregulated cell proliferation, increased clonogenicity, increased invasive ability and decreased apoptosis, in vivo and in vitro, when cells were treated with gemcitabine. | |||
| Drug Sensitivity Data Categorized by Their Corresponding Mechanisms | ||||
|
|
||||
| Disease Class: Chronic myeloid leukemia [ICD-11: 2A20.0] | [13] | |||
| Sensitive Disease | Chronic myeloid leukemia [ICD-11: 2A20.0] | |||
| Sensitive Drug | Idarubicin | |||
| Molecule Alteration | Expression | Up-regulation |
||
| Experimental Note | Revealed Based on the Cell Line Data | |||
| Cell Pathway Regulation | p-glycoprotein | Regulation | N.A. | |
| In Vitro Model | K562 cells | Blood | Homo sapiens (Human) | CVCL_0004 |
| K562 ABCG2 overexpression cells | Bone marrow | Homo sapiens (Human) | N.A. | |
| Experiment for Molecule Alteration |
Western blot assay | |||
| Experiment for Drug Resistance |
Cell viability assay; Flow Cytometry assay; DNA dye competition assay | |||
| Mechanism Description | Induction of DNA double-strand breaks and chromatin damage through histone eviction;Less affected by ABCG2-mediated drug export. | |||
| Drug Resistance Data Categorized by Their Corresponding Mechanisms | ||||
|
|
||||
| Disease Class: Chronic myeloid leukemia [ICD-11: 2A20.0] | [17] | |||
| Resistant Disease | Chronic myeloid leukemia [ICD-11: 2A20.0] | |||
| Resistant Drug | Imatinib | |||
| Molecule Alteration | Expression | Up-regulation |
||
| Experimental Note | Revealed Based on the Cell Line Data | |||
| In Vitro Model | K562-ABCG2 cells | Bone marrow | Homo sapiens (Human) | N.A. |
| Experiment for Molecule Alteration |
Western blot assay | |||
| Experiment for Drug Resistance |
CCK8 assay | |||
| Mechanism Description | Overexpression of ABCG2 on the membrane surface of CML cells contributes to decreased TKI efficacy. This study demonstrates for the first time that the concomitant use of febuxostat enhances the efficacy of dasatinib in patients with CML. This is at least, in part, by the inhibition of ABCG2-mediated dasatinib excretion from CML cells. | |||
| Drug Sensitivity Data Categorized by Their Corresponding Mechanisms | ||||
|
|
||||
| Disease Class: Chronic myeloid leukemia [ICD-11: 2A20.0] | [23] | |||
| Sensitive Disease | Chronic myeloid leukemia [ICD-11: 2A20.0] | |||
| Sensitive Drug | Imatinib | |||
| Molecule Alteration | Expression | Down-regulation |
||
| Experimental Note | Identified from the Human Clinical Data | |||
| Cell Pathway Regulation | Cell apoptosis | Activation | hsa04210 | |
| Cell proliferation | Inhibition | hsa05200 | ||
| In Vitro Model | K562 cells | Blood | Homo sapiens (Human) | CVCL_0004 |
| Experiment for Molecule Alteration |
Western blot analysis | |||
| Experiment for Drug Resistance |
CCK8 assay; Annexin V-FITC/PI Apoptosis Detection assay | |||
| Mechanism Description | Overexpression of MEG3 in imatinib-resistant k562 cells markedly decreased cell proliferation, increased cell apoptosis, reversed imatinib resistance, and reduced the expression of MRP1, MDR1, and ABCG2. | |||
| Drug Resistance Data Categorized by Their Corresponding Mechanisms | ||||
|
|
||||
| Disease Class: Epilepsy [ICD-11: 8A60.0] | [24] | |||
| Resistant Disease | Epilepsy [ICD-11: 8A60.0] | |||
| Resistant Drug | Lamotrigine | |||
| Molecule Alteration | Missense mutation | p.V2424G |
||
| Experiment for Molecule Alteration |
Genotyping assay; RT-PCR | |||
| Experiment for Drug Resistance |
High-performance liquid chromatography assay; Diode-array assay | |||
| Mechanism Description | Polymorphism ABCG2 c.421C>A moderately reduces lamotrigine concentrations in adults with epilepsy. | |||
| Drug Resistance Data Categorized by Their Corresponding Mechanisms | ||||
|
|
||||
| Disease Class: Rheumatoid arthritis [ICD-11: FA20.0] | [14] | |||
| Resistant Disease | Rheumatoid arthritis [ICD-11: FA20.0] | |||
| Resistant Drug | Leflunomide | |||
| Molecule Alteration | Expression | Up-regulation |
||
| Experimental Note | Identified from the Human Clinical Data | |||
| Mechanism Description | MTX is a substrate for eight ABC transporters. In vitro studies demonstrated that RAFLS treated with MTX had higher ABCB1 expression levels than controls, with a positive correlation between ABCB1 expression levels and RA treatment duration. In addition to MTX, other DMARDs (e.g. sulfasalazine, leflunomide, bucillamine, azathioprine), glucocorticoids (e.g. betamethasone, dexamethasone), and NSAIDs (e.g. celecoxib and indomethacin) are also substrates of ABC transporters. | |||
| Drug Resistance Data Categorized by Their Corresponding Mechanisms | ||||
|
|
||||
| Disease Class: Retinoblastoma [ICD-11: 2D02.2] | [25] | |||
| Resistant Disease | Retinoblastoma [ICD-11: 2D02.2] | |||
| Resistant Drug | Melphalan | |||
| Molecule Alteration | Expression | Up-regulation |
||
| Experimental Note | Discovered Using In-vivo Testing Model | |||
| Experiment for Molecule Alteration |
qRT-PCR | |||
| Experiment for Drug Resistance |
MTT assay | |||
| Mechanism Description | Similar Genomic Alterations but Distinctive Expression of Influx/Efflux Transporters Between Chemoresistant and Parental Cells | |||
| Drug Resistance Data Categorized by Their Corresponding Mechanisms | ||||
|
|
||||
| Disease Class: Breast cancer [ICD-11: 2C60.3] | [26] | |||
| Resistant Disease | Breast cancer [ICD-11: 2C60.3] | |||
| Resistant Drug | Mitoxantrone | |||
| Molecule Alteration | Expression | Up-regulation |
||
| Experimental Note | Revealed Based on the Cell Line Data | |||
| Cell Pathway Regulation | Cell apoptosis | Inhibition | hsa04210 | |
| Cell viability | Activation | hsa05200 | ||
| In Vitro Model | MCF-7 cells | Breast | Homo sapiens (Human) | CVCL_0031 |
| In Vivo Model | BALB/c nude mouse xenograft model | Mus musculus | ||
| Experiment for Molecule Alteration |
Western blot analysis | |||
| Experiment for Drug Resistance |
MTT assay | |||
| Mechanism Description | Overexpression of miR-181a down-regulated BCRP expression, and sensitized MX-resistant MCF-7/MX cells to MX. | |||
| Disease Class: Breast cancer [ICD-11: 2C60.3] | [26] | |||
| Resistant Disease | Breast cancer [ICD-11: 2C60.3] | |||
| Resistant Drug | Mitoxantrone | |||
| Molecule Alteration | Expression | Up-regulation |
||
| Experimental Note | Revealed Based on the Cell Line Data | |||
| Cell Pathway Regulation | Cell proliferation | Activation | hsa05200 | |
| Cell viability | Activation | hsa05200 | ||
| In Vitro Model | MCF-7 cells | Breast | Homo sapiens (Human) | CVCL_0031 |
| In Vivo Model | BALB/c nude mouse xenograft model | Mus musculus | ||
| Experiment for Molecule Alteration |
Western blot analysis | |||
| Experiment for Drug Resistance |
MTT assay | |||
| Mechanism Description | Overexpression of miR-181a down-regulated BCRP expression, and sensitized MX-resistant MCF-7/MX cells to MX. | |||
| Disease Class: Breast cancer [ICD-11: 2C60.3] | [27] | |||
| Resistant Disease | Breast cancer [ICD-11: 2C60.3] | |||
| Resistant Drug | Mitoxantrone | |||
| Molecule Alteration | Expression | Up-regulation |
||
| Experimental Note | Revealed Based on the Cell Line Data | |||
| In Vitro Model | MCF-7 cells | Breast | Homo sapiens (Human) | CVCL_0031 |
| MCF-7/MX100 cells | Breast | Homo sapiens (Human) | CVCL_LB54 | |
| Experiment for Molecule Alteration |
Immunoblotting analysis | |||
| Experiment for Drug Resistance |
Sulforhodamine B assay | |||
| Mechanism Description | miR-328 targets ABCG2 3'-UTR and, consequently, controls ABCG2 protein expression and influences drug disposition in human breast cancer cells. miR-328-directed down-regulation of ABCG2 expression in MCF-7/MX100 cells resulted in an increased mitoxantrone sensitivity. | |||
| Disease Class: Breast cancer [ICD-11: 2C60.3] | [18] | |||
| Resistant Disease | Breast cancer [ICD-11: 2C60.3] | |||
| Resistant Drug | Mitoxantrone | |||
| Molecule Alteration | Expression | Up-regulation |
||
| Experimental Note | Revealed Based on the Cell Line Data | |||
| In Vitro Model | MCF-7 cells | Breast | Homo sapiens (Human) | CVCL_0031 |
| MCF-7/AdrVp cells | Breast | Homo sapiens (Human) | CVCL_4Y46 | |
| MCF-7/AdrVpPR cells | Breast | Homo sapiens (Human) | CVCL_4Y46 | |
| Experiment for Molecule Alteration |
Northern blot analysis | |||
| Experiment for Drug Resistance |
Flow cytometric assay | |||
| Mechanism Description | The overexpression of BCRP mRNA in MCF-7/AdrVp cells, which is diminished in MCF-7/AdrVpPR, suggests an important role for BCRP in resistance to cytotoxic agents. Furthermore, the enforced overexpression of BCRP in MCF-7 cells diminished daunorubicin cellular accumulation and imparted a pattern of drug crossresistance to the transfected cells that was virtually identical to that of MCF-7/AdrVp. | |||
| Drug Sensitivity Data Categorized by Their Corresponding Mechanisms | ||||
|
|
||||
| Disease Class: Breast cancer [ICD-11: 2C60.3] | [28] | |||
| Sensitive Disease | Breast cancer [ICD-11: 2C60.3] | |||
| Sensitive Drug | Mitoxantrone | |||
| Molecule Alteration | Expression | Down-regulation |
||
| Experimental Note | Revealed Based on the Cell Line Data | |||
| Cell Pathway Regulation | Cell proliferation | Inhibition | hsa05200 | |
| In Vitro Model | MCF-7 cells | Breast | Homo sapiens (Human) | CVCL_0031 |
| In Vivo Model | Nude mouse xenograft model | Mus musculus | ||
| Experiment for Molecule Alteration |
Western blot analysis | |||
| Experiment for Drug Resistance |
MTS assay | |||
| Mechanism Description | miR-302 inhibits BCRP expression via targeting the 3'-UTR of BCRP mRNA. miR-302 members may cooperatively downregulate BCRP expression to increase chemosensitivity of breast cancer cells. miR-302 gene cluster may be a potential target for reversing BCRP-mediated chemoresistance in breast cancer. | |||
| Disease Class: Breast cancer [ICD-11: 2C60.3] | [29] | |||
| Sensitive Disease | Breast cancer [ICD-11: 2C60.3] | |||
| Sensitive Drug | Mitoxantrone | |||
| Molecule Alteration | Expression | Down-regulation |
||
| Experimental Note | Revealed Based on the Cell Line Data | |||
| Cell Pathway Regulation | Cell viability | Inhibition | hsa05200 | |
| In Vitro Model | MCF-7 cells | Breast | Homo sapiens (Human) | CVCL_0031 |
| In Vivo Model | BALB/c nude mouse xenograft model | Mus musculus | ||
| Experiment for Molecule Alteration |
Western blot analysis | |||
| Experiment for Drug Resistance |
MTT assay | |||
| Mechanism Description | Ectopic miR-487a down-regulated BCRP expression at the mRNA and protein levels, increasing the intracellular accumulation and cytotoxicity of Mitoxantrone in resistant MCF-7/MX breast cancer cells. | |||
| Disease Class: Breast cancer [ICD-11: 2C60.3] | [29] | |||
| Sensitive Disease | Breast cancer [ICD-11: 2C60.3] | |||
| Sensitive Drug | Mitoxantrone | |||
| Molecule Alteration | Expression | Down-regulation |
||
| Experimental Note | Revealed Based on the Cell Line Data | |||
| Cell Pathway Regulation | Cell apoptosis | Inhibition | hsa04210 | |
| Cell survival | Activation | hsa05200 | ||
| In Vitro Model | MCF-7 cells | Breast | Homo sapiens (Human) | CVCL_0031 |
| In Vivo Model | BALB/c nude mouse xenograft model | Mus musculus | ||
| Experiment for Molecule Alteration |
Western blot analysis | |||
| Experiment for Drug Resistance |
MTT assay | |||
| Mechanism Description | Ectopic miR-487a down-regulated BCRP expression at the mRNA and protein levels, increasing the intracellular accumulation and cytotoxicity of Mitoxantrone in resistant MCF-7/MX breast cancer cells. | |||
| Disease Class: Chronic myeloid leukemia [ICD-11: 2A20.0] | [30] | |||
| Sensitive Disease | Chronic myeloid leukemia [ICD-11: 2A20.0] | |||
| Sensitive Drug | Mitoxantrone | |||
| Molecule Alteration | Expression | Down-regulation |
||
| Experimental Note | Revealed Based on the Cell Line Data | |||
| In Vitro Model | K562/BCRP cells | Blood | Homo sapiens (Human) | CVCL_0004 |
| K562/MDR cells | Blood | Homo sapiens (Human) | CVCL_0004 | |
| Experiment for Drug Resistance |
Growth inhibition assay | |||
| Mechanism Description | Some flavonoids have BCRP-inhibitory activity. 3',4',7-trimethoxyflavone showed the strongest anti-BCRP activity with RI50 values of 0.012 uM for SN-38 and 0.044 uM for mitoxantrone. 3',4',7-trimethoxyflavone and acacetin, showed only low anti-P-gp activity, with the remainder displaying no suppressive effects against P-gp. None of the flavonoids that we tested inhibite. | |||
| Disease Class: Solid tumour/cancer [ICD-11: 2A00-2F9Z] | [31] | |||
| Sensitive Disease | Solid tumour/cancer [ICD-11: 2A00-2F9Z] | |||
| Sensitive Drug | Mitoxantrone | |||
| Molecule Alteration | Missense mutation | p.C592A |
||
| Experimental Note | Revealed Based on the Cell Line Data | |||
| In Vitro Model | HEK293 cells | Kidney | Homo sapiens (Human) | CVCL_0045 |
| Experiment for Molecule Alteration |
Western blot analysis | |||
| Experiment for Drug Resistance |
Cytotoxicity assay | |||
| Mechanism Description | Cys-603 alone displayed mitoxantrone resistance close (although not identical) to the wt (-70%), whereas both Cys-608 alone and Cys-592 alone displayed an almost identical low resistance of -10 and 5% of the wt, respectively. For both C603A/C608A and C592A/C603A, we observed a marked decrease in resistance to mitoxantrone and a concomitant decrease in expr. | |||
| Disease Class: Solid tumour/cancer [ICD-11: 2A00-2F9Z] | [31] | |||
| Sensitive Disease | Solid tumour/cancer [ICD-11: 2A00-2F9Z] | |||
| Sensitive Drug | Mitoxantrone | |||
| Molecule Alteration | Missense mutation | p.C592A+p.C603A |
||
| Experimental Note | Revealed Based on the Cell Line Data | |||
| In Vitro Model | HEK293 cells | Kidney | Homo sapiens (Human) | CVCL_0045 |
| Experiment for Molecule Alteration |
Western blot analysis | |||
| Experiment for Drug Resistance |
Cytotoxicity assay | |||
| Mechanism Description | Cys-603 alone displayed mitoxantrone resistance close (although not identical) to the wt (-70%), whereas both Cys-608 alone and Cys-592 alone displayed an almost identical low resistance of -10 and 5% of the wt, respectively. For both C603A/C608A and C592A/C603A, we observed a marked decrease in resistance to mitoxantrone and a concomitant decrease in expr. | |||
| Disease Class: Solid tumour/cancer [ICD-11: 2A00-2F9Z] | [31] | |||
| Sensitive Disease | Solid tumour/cancer [ICD-11: 2A00-2F9Z] | |||
| Sensitive Drug | Mitoxantrone | |||
| Molecule Alteration | Missense mutation | p.C603A+p.C608A |
||
| Experimental Note | Revealed Based on the Cell Line Data | |||
| In Vitro Model | HEK293 cells | Kidney | Homo sapiens (Human) | CVCL_0045 |
| Experiment for Molecule Alteration |
Western blot analysis | |||
| Experiment for Drug Resistance |
Cytotoxicity assay | |||
| Mechanism Description | Cys-603 alone displayed mitoxantrone resistance close (although not identical) to the wt (-70%), whereas both Cys-608 alone and Cys-592 alone displayed an almost identical low resistance of -10 and 5% of the wt, respectively. For both C603A/C608A and C592A/C603A, we observed a marked decrease in resistance to mitoxantrone and a concomitant decrease in expr. | |||
| Disease Class: Solid tumour/cancer [ICD-11: 2A00-2F9Z] | [31] | |||
| Sensitive Disease | Solid tumour/cancer [ICD-11: 2A00-2F9Z] | |||
| Sensitive Drug | Mitoxantrone | |||
| Molecule Alteration | Missense mutation | p.C608A |
||
| Experimental Note | Revealed Based on the Cell Line Data | |||
| In Vitro Model | HEK293 cells | Kidney | Homo sapiens (Human) | CVCL_0045 |
| Experiment for Molecule Alteration |
Western blot analysis | |||
| Experiment for Drug Resistance |
Cytotoxicity assay | |||
| Mechanism Description | Cys-603 alone displayed mitoxantrone resistance close (although not identical) to the wt (-70%), whereas both Cys-608 alone and Cys-592 alone displayed an almost identical low resistance of -10 and 5% of the wt, respectively. For both C603A/C608A and C592A/C603A, we observed a marked decrease in resistance to mitoxantrone and a concomitant decrease in expr. | |||
| Disease Class: Solid tumour/cancer [ICD-11: 2A00-2F9Z] | [32] | |||
| Sensitive Disease | Solid tumour/cancer [ICD-11: 2A00-2F9Z] | |||
| Sensitive Drug | Mitoxantrone | |||
| Molecule Alteration | Missense mutation | p.K86M |
||
| Experimental Note | Revealed Based on the Cell Line Data | |||
| In Vitro Model | HEK293 cells | Kidney | Homo sapiens (Human) | CVCL_0045 |
| Experiment for Molecule Alteration |
Western blot analysis | |||
| Experiment for Drug Resistance |
Colorimetric cytotoxicity assy assay | |||
| Mechanism Description | Cells expressing ABCG2-wt or ABCG2-wt-MYC showed increased resistance to mitoxantrone as reflected in a sevenfold increase in IC50 value as compared to that observed for non-transfected cells (0.36 uM and 0.29 uM, for ABCG2-wt or ABCG2-wt-MYC expressing cells compared to 0.05 uM in non-transfected cells). ABCG2-k86M and ABCG2-k86M-HA displayed sensitivity comparable to that of non-transfected cells consistent with loss of function with IC50 values for mitoxantrone of 0.047 uM and and 0.043 uM | |||
| Drug Sensitivity Data Categorized by Their Corresponding Mechanisms | ||||
|
|
||||
| Disease Class: Breast cancer [ICD-11: 2C60.3] | [33] | |||
| Sensitive Disease | Breast cancer [ICD-11: 2C60.3] | |||
| Sensitive Drug | Paclitaxel | |||
| Molecule Alteration | Expression | Down-regulation |
||
| Experimental Note | Revealed Based on the Cell Line Data | |||
| In Vitro Model | MCF-7/PR cells | Breast | Homo sapiens (Human) | CVCL_0031 |
| Experiment for Molecule Alteration |
Western blot analysis | |||
| Experiment for Drug Resistance |
Sulforhodamine B assay | |||
| Mechanism Description | Down-regulation of LncRNA RP11-770J1.3 and TMEM25 enhanced the sensitivity of MCF-7/PR cells to paclitaxel, and inhibited the expression of MRP, BCRP and MDR1/P-gp. | |||
| Drug Resistance Data Categorized by Their Corresponding Mechanisms | ||||
|
|
||||
| Disease Class: Hepatocellular cancer [ICD-11: 2C12.4] | [21] | |||
| Resistant Disease | Hepatocellular cancer [ICD-11: 2C12.4] | |||
| Resistant Drug | Sorafenib | |||
| Molecule Alteration | Expression | Up-regulation |
||
| Experimental Note | Revealed Based on the Cell Line Data | |||
| Cell Pathway Regulation | Cell apoptosis | Inhibition | hsa04210 | |
| In Vitro Model | Huh-7 cells | Liver | Homo sapiens (Human) | CVCL_0336 |
| HepG2 cells | Liver | Homo sapiens (Human) | CVCL_0027 | |
| Hep3B cells | Liver | Homo sapiens (Human) | CVCL_0326 | |
| PLC/PRF-5 cells | Liver | Homo sapiens (Human) | CVCL_0485 | |
| In Vivo Model | Nude mouse xenograft model | Mus musculus | ||
| Experiment for Molecule Alteration |
Western blot analysis | |||
| Experiment for Drug Resistance |
MTS assay; Flow cytometry assay | |||
| Mechanism Description | LincRNA-VLDLR (linc-VLDLR) was significantly up-regulated in malignant hepatocytes. Exposure of HCC cells to diverse anti-cancer agents such as sorafenib, camptothecin, and doxorubicin increased linc-VLDLR expression in cells as well as within EVs released from these cells. Incubation with EVs reduced chemotherapy-induced cell death and also increased linc-VLDLR expression in recipient cells. RNAi-mediated knockdown of linc-VLDLR decreased cell viability and abrogated cell cycle progression. Moreover, knockdown of VLDLR reduced expression of ABCG2 (ATP-binding cassette, sub-family G member 2), whereas over-expression of this protein reduced the effects of VLDLR knockdown on sorafenib-induced cell death. Here, linc-VLDLR is identified as an extracellular vesicle enriched LncRNA that contributes to cellular stress responses. | |||
| Disease Class: Hepatocellular carcinoma [ICD-11: 2C12.2] | [21] | |||
| Resistant Disease | Hepatocellular carcinoma [ICD-11: 2C12.2] | |||
| Resistant Drug | Sorafenib | |||
| Molecule Alteration | Expression | Up-regulation |
||
| Experimental Note | Revealed Based on the Cell Line Data | |||
| Cell Pathway Regulation | Cell apoptosis | Inhibition | hsa04210 | |
| In Vitro Model | Huh-7 cells | Liver | Homo sapiens (Human) | CVCL_0336 |
| HepG2 cells | Liver | Homo sapiens (Human) | CVCL_0027 | |
| Hep3B cells | Liver | Homo sapiens (Human) | CVCL_0326 | |
| PLC/PRF-5 cells | Liver | Homo sapiens (Human) | CVCL_0485 | |
| In Vivo Model | Nude mouse xenograft model | Mus musculus | ||
| Experiment for Molecule Alteration |
Western blot analysis | |||
| Experiment for Drug Resistance |
MTS assay; Flow cytometry assay | |||
| Mechanism Description | LincRNA-VLDLR (linc-VLDLR) was significantly up-regulated in malignant hepatocytes. Exposure of HCC cells to diverse anti-cancer agents such as sorafenib, camptothecin, and doxorubicin increased linc-VLDLR expression in cells as well as within EVs released from these cells. Incubation with EVs reduced chemotherapy-induced cell death and also increased linc-VLDLR expression in recipient cells. RNAi-mediated knockdown of linc-VLDLR decreased cell viability and abrogated cell cycle progression. Moreover, knockdown of VLDLR reduced expression of ABCG2 (ATP-binding cassette, sub-family G member 2), whereas over-expression of this protein reduced the effects of VLDLR knockdown on sorafenib-induced cell death. Here, linc-VLDLR is identified as an extracellular vesicle enriched LncRNA that contributes to cellular stress responses. | |||
| Drug Resistance Data Categorized by Their Corresponding Mechanisms | ||||
|
|
||||
| Disease Class: Rheumatoid arthritis [ICD-11: FA20.0] | [14] | |||
| Resistant Disease | Rheumatoid arthritis [ICD-11: FA20.0] | |||
| Resistant Drug | Sulfasalazine | |||
| Molecule Alteration | Expression | Up-regulation |
||
| Experimental Note | Identified from the Human Clinical Data | |||
| Mechanism Description | MTX is a substrate for eight ABC transporters. In vitro studies demonstrated that RAFLS treated with MTX had higher ABCB1 expression levels than controls, with a positive correlation between ABCB1 expression levels and RA treatment duration. In addition to MTX, other DMARDs (e.g. sulfasalazine, leflunomide, bucillamine, azathioprine), glucocorticoids (e.g. betamethasone, dexamethasone), and NSAIDs (e.g. celecoxib and indomethacin) are also substrates of ABC transporters. | |||
| Drug Sensitivity Data Categorized by Their Corresponding Mechanisms | ||||
|
|
||||
| Disease Class: Ulcerative colitis [ICD-11: DD71.0] | [6] | |||
| Sensitive Disease | Ulcerative colitis [ICD-11: DD71.0] | |||
| Sensitive Drug | Sulfasalazine | |||
| Molecule Alteration | Expression | Down-regulation |
||
| Experimental Note | Identified from the Human Clinical Data | |||
| In Vitro Model | CaCo2 cells | Colon | Homo sapiens (Human) | CVCL_0025 |
| IPS cells | Colon | Homo sapiens (Human) | N.A. | |
| Experiment for Molecule Alteration |
qPCR | |||
| Experiment for Drug Resistance |
Ussing chamber system assay | |||
| Mechanism Description | Digoxin and fexofenadine (each 5 uM) were selected as P-gp substrates, and sulfasalazine and rosuvastatin (each 5 uM) were selected as BCRP substrates to evaluate the efflux transport mediated by P-gp and BCRP. PSC833 (15 uM) and ko143 (15 uM) were used as typical inhibitors of P-gp and BCRP, respectively. Serosal-to-mucosal transport of all the tested P-gp and BCRP substrate drugs was significantly decreased or tended to decrease in the presence of P-gp/BCRP inhibitor cocktail. | |||
| Drug Sensitivity Data Categorized by Their Corresponding Mechanisms | ||||
|
|
||||
| Disease Class: Multiple sclerosis [ICD-11: 8A40.0] | [34] | |||
| Sensitive Disease | Multiple sclerosis [ICD-11: 8A40.0] | |||
| Sensitive Drug | Teriflunomide | |||
| Molecule Alteration | Expression | Down-regulation |
||
| Experimental Note | Revealed Based on the Cell Line Data | |||
| Cell Pathway Regulation | Cell apoptosis | Activation | hsa04210 | |
| Cell proliferation | Inhibition | hsa05200 | ||
| In Vitro Model | C57BL/6J cells(Mus musculus (Mouse)) | Lymph | Homo sapiens (Human) | CVCL_5U84 |
| In Vivo Model | EAE mice model | Mus musculus | ||
| Experiment for Drug Resistance |
Annexin V staining assay | |||
| Mechanism Description | In vitro, intracellular teri concentration in T cells was 2.5-fold higher in abcg2-kO mice than in wt mice. Teri-induced inhibition of T cell proliferation was two fold increased in abcg2-kO cells compared to wt. | |||
| Disease Class: Multiple sclerosis [ICD-11: 8A40.0] | [34] | |||
| Sensitive Disease | Multiple sclerosis [ICD-11: 8A40.0] | |||
| Sensitive Drug | Teriflunomide | |||
| Molecule Alteration | Expression | Down-regulation |
||
| Experimental Note | Revealed Based on the Cell Line Data | |||
| Cell Pathway Regulation | Cell apoptosis | Activation | hsa04210 | |
| Cell proliferation | Inhibition | hsa05200 | ||
| In Vitro Model | C57BL/6J cells(Mus musculus (Mouse)) | Lymph | Homo sapiens (Human) | CVCL_5U84 |
| In Vivo Model | EAE mice model | Mus musculus | ||
| Experiment for Drug Resistance |
Annexin V staining assay | |||
| Mechanism Description | Pharmacological abcg2 inhibition in T cells from wt mice led to an increase of teri-induced apoptosis (Ko143 vs. DMSO: 3.1-fold, p < 0.05; FTC vs. DMSO: 2.8-fold, p > 0.05). | |||
| Drug Resistance Data Categorized by Their Corresponding Mechanisms | ||||
|
|
||||
| Disease Class: Retinoblastoma [ICD-11: 2D02.2] | [25] | |||
| Resistant Disease | Retinoblastoma [ICD-11: 2D02.2] | |||
| Resistant Drug | Topotecan | |||
| Molecule Alteration | Expression | Up-regulation |
||
| Experimental Note | Discovered Using In-vivo Testing Model | |||
| Experiment for Molecule Alteration |
qRT-PCR | |||
| Experiment for Drug Resistance |
MTT assay | |||
| Mechanism Description | Similar Genomic Alterations but Distinctive Expression of Influx/Efflux Transporters Between Chemoresistant and Parental Cells | |||
| Drug Sensitivity Data Categorized by Their Corresponding Mechanisms | ||||
|
|
||||
| Disease Class: Retinoblastoma [ICD-11: 2D02.2] | [5] | |||
| Sensitive Disease | Retinoblastoma [ICD-11: 2D02.2] | |||
| Sensitive Drug | Vincristine | |||
| Molecule Alteration | Expression | Down-regulation |
||
| Experimental Note | Revealed Based on the Cell Line Data | |||
| Cell Pathway Regulation | Cell apoptosis | Activation | hsa04210 | |
| Cell proliferation | Inhibition | hsa05200 | ||
| In Vitro Model | WERI-Rb-1 cells | Retina | Homo sapiens (Human) | CVCL_1792 |
| In Vivo Model | Nude mouse xenograft model | Mus musculus | ||
| Experiment for Molecule Alteration |
Western blot analysis | |||
| Experiment for Drug Resistance |
CCK8 assay | |||
| Mechanism Description | Silencing of ABCG2 by MicroRNA-3163 inhibits multidrug resistance in retinoblastoma cancer stem cells. | |||
Clinical Trial Drug(s)
2 drug(s) in total
| Drug Resistance Data Categorized by Their Corresponding Mechanisms | ||||
|
|
||||
| Disease Class: Hepatocellular cancer [ICD-11: 2C12.4] | [21] | |||
| Resistant Disease | Hepatocellular cancer [ICD-11: 2C12.4] | |||
| Resistant Drug | Camptothecin | |||
| Molecule Alteration | Expression | Up-regulation |
||
| Experimental Note | Revealed Based on the Cell Line Data | |||
| Cell Pathway Regulation | Cell apoptosis | Inhibition | hsa04210 | |
| In Vitro Model | Huh-7 cells | Liver | Homo sapiens (Human) | CVCL_0336 |
| HepG2 cells | Liver | Homo sapiens (Human) | CVCL_0027 | |
| Hep3B cells | Liver | Homo sapiens (Human) | CVCL_0326 | |
| PLC/PRF-5 cells | Liver | Homo sapiens (Human) | CVCL_0485 | |
| In Vivo Model | Nude mouse xenograft model | Mus musculus | ||
| Experiment for Molecule Alteration |
Western blot analysis | |||
| Experiment for Drug Resistance |
MTS assay; Flow cytometry assay | |||
| Mechanism Description | LincRNA-VLDLR (linc-VLDLR) was significantly up-regulated in malignant hepatocytes. Exposure of HCC cells to diverse anti-cancer agents such as sorafenib, camptothecin, and doxorubicin increased linc-VLDLR expression in cells as well as within EVs released from these cells. Incubation with EVs reduced chemotherapy-induced cell death and also increased linc-VLDLR expression in recipient cells. RNAi-mediated knockdown of linc-VLDLR decreased cell viability and abrogated cell cycle progression. Moreover, knockdown of VLDLR reduced expression of ABCG2 (ATP-binding cassette, sub-family G member 2), whereas over-expression of this protein reduced the effects of VLDLR knockdown on sorafenib-induced cell death. Here, linc-VLDLR is identified as an extracellular vesicle enriched LncRNA that contributes to cellular stress responses. | |||
| Drug Sensitivity Data Categorized by Their Corresponding Mechanisms | ||||
|
|
||||
| Disease Class: Colorectal cancer [ICD-11: 2B91.1] | [35] | |||
| Sensitive Disease | Colorectal cancer [ICD-11: 2B91.1] | |||
| Sensitive Drug | Hydroxycamptothecin | |||
| Molecule Alteration | Expression | Down-regulation |
||
| Experimental Note | Identified from the Human Clinical Data | |||
| Cell Pathway Regulation | Cell migration | Inhibition | hsa04670 | |
| In Vitro Model | SW480 cells | Colon | Homo sapiens (Human) | CVCL_0546 |
| SW620 cells | Colon | Homo sapiens (Human) | CVCL_0547 | |
| HCT116 cells | Colon | Homo sapiens (Human) | CVCL_0291 | |
| LOVO cells | Colon | Homo sapiens (Human) | CVCL_0399 | |
| SW1116 cells | Colon | Homo sapiens (Human) | CVCL_0544 | |
| In Vivo Model | Nude mouse xenograft model | Mus musculus | ||
| Experiment for Molecule Alteration |
Western blot analysis | |||
| Experiment for Drug Resistance |
CCK8 assay | |||
| Mechanism Description | MMP16 is one member of the matrix metalloproteinase (MMP) family and can degrade type III collagen, gelatin, fibronectin and laminin-1, enhance the growth and invasiveness. ABCG2 is a member of ATP-binding cassette transporters. miR-328 downregulation may contribute to the overexpression of ABCG2 and MMP16 and cause drug resistance. | |||
Investigative Drug(s)
1 drug(s) in total
| Drug Sensitivity Data Categorized by Their Corresponding Mechanisms | ||||
|
|
||||
| Disease Class: Chronic myeloid leukemia [ICD-11: 2A20.0] | [13] | |||
| Sensitive Disease | Chronic myeloid leukemia [ICD-11: 2A20.0] | |||
| Sensitive Drug | Anthracyclines | |||
| Molecule Alteration | Expression | Up-regulation |
||
| Experimental Note | Revealed Based on the Cell Line Data | |||
| Cell Pathway Regulation | p-glycoprotein | Regulation | N.A. | |
| In Vitro Model | K562 cells | Blood | Homo sapiens (Human) | CVCL_0004 |
| K562 ABCG2 overexpression cells | Bone marrow | Homo sapiens (Human) | N.A. | |
| Experiment for Molecule Alteration |
Western blot assay | |||
| Experiment for Drug Resistance |
Cell viability assay; Flow Cytometry assay; DNA dye competition assay | |||
| Mechanism Description | Exert their activity exclusively through histone eviction and are generally more cytotoxic to tumor cells than their parent compound;DNA double-strand break generation versus histone eviction;Anthracyclines featuring an N,N-dimethyl aminosugar in general are poor substrates for the ABCB1 drug transporter as compared to their non-alkylated counterparts. | |||
Disease- and Tissue-specific Abundances of This Molecule
ICD Disease Classification 02

| Differential expression of molecule in resistant diseases | ||
| The Studied Tissue | Nervous tissue | |
| The Specified Disease | Brain cancer | |
| The Expression Level of Disease Section Compare with the Healthy Individual Tissue | p-value: 7.63E-03; Fold-change: -2.10E-01; Z-score: -2.66E-01 | |
|
Molecule expression in the diseased tissue of patients
Molecule expression in the normal tissue of healthy individuals
|
||
| Disease-specific Molecule Abundances |

|
Click to View the Clearer Original Diagram |
| The Studied Tissue | Brainstem tissue | |
| The Specified Disease | Glioma | |
| The Expression Level of Disease Section Compare with the Healthy Individual Tissue | p-value: 6.87E-01; Fold-change: -2.51E-01; Z-score: -3.23E-01 | |
|
Molecule expression in the diseased tissue of patients
Molecule expression in the normal tissue of healthy individuals
|
||
| Disease-specific Molecule Abundances |
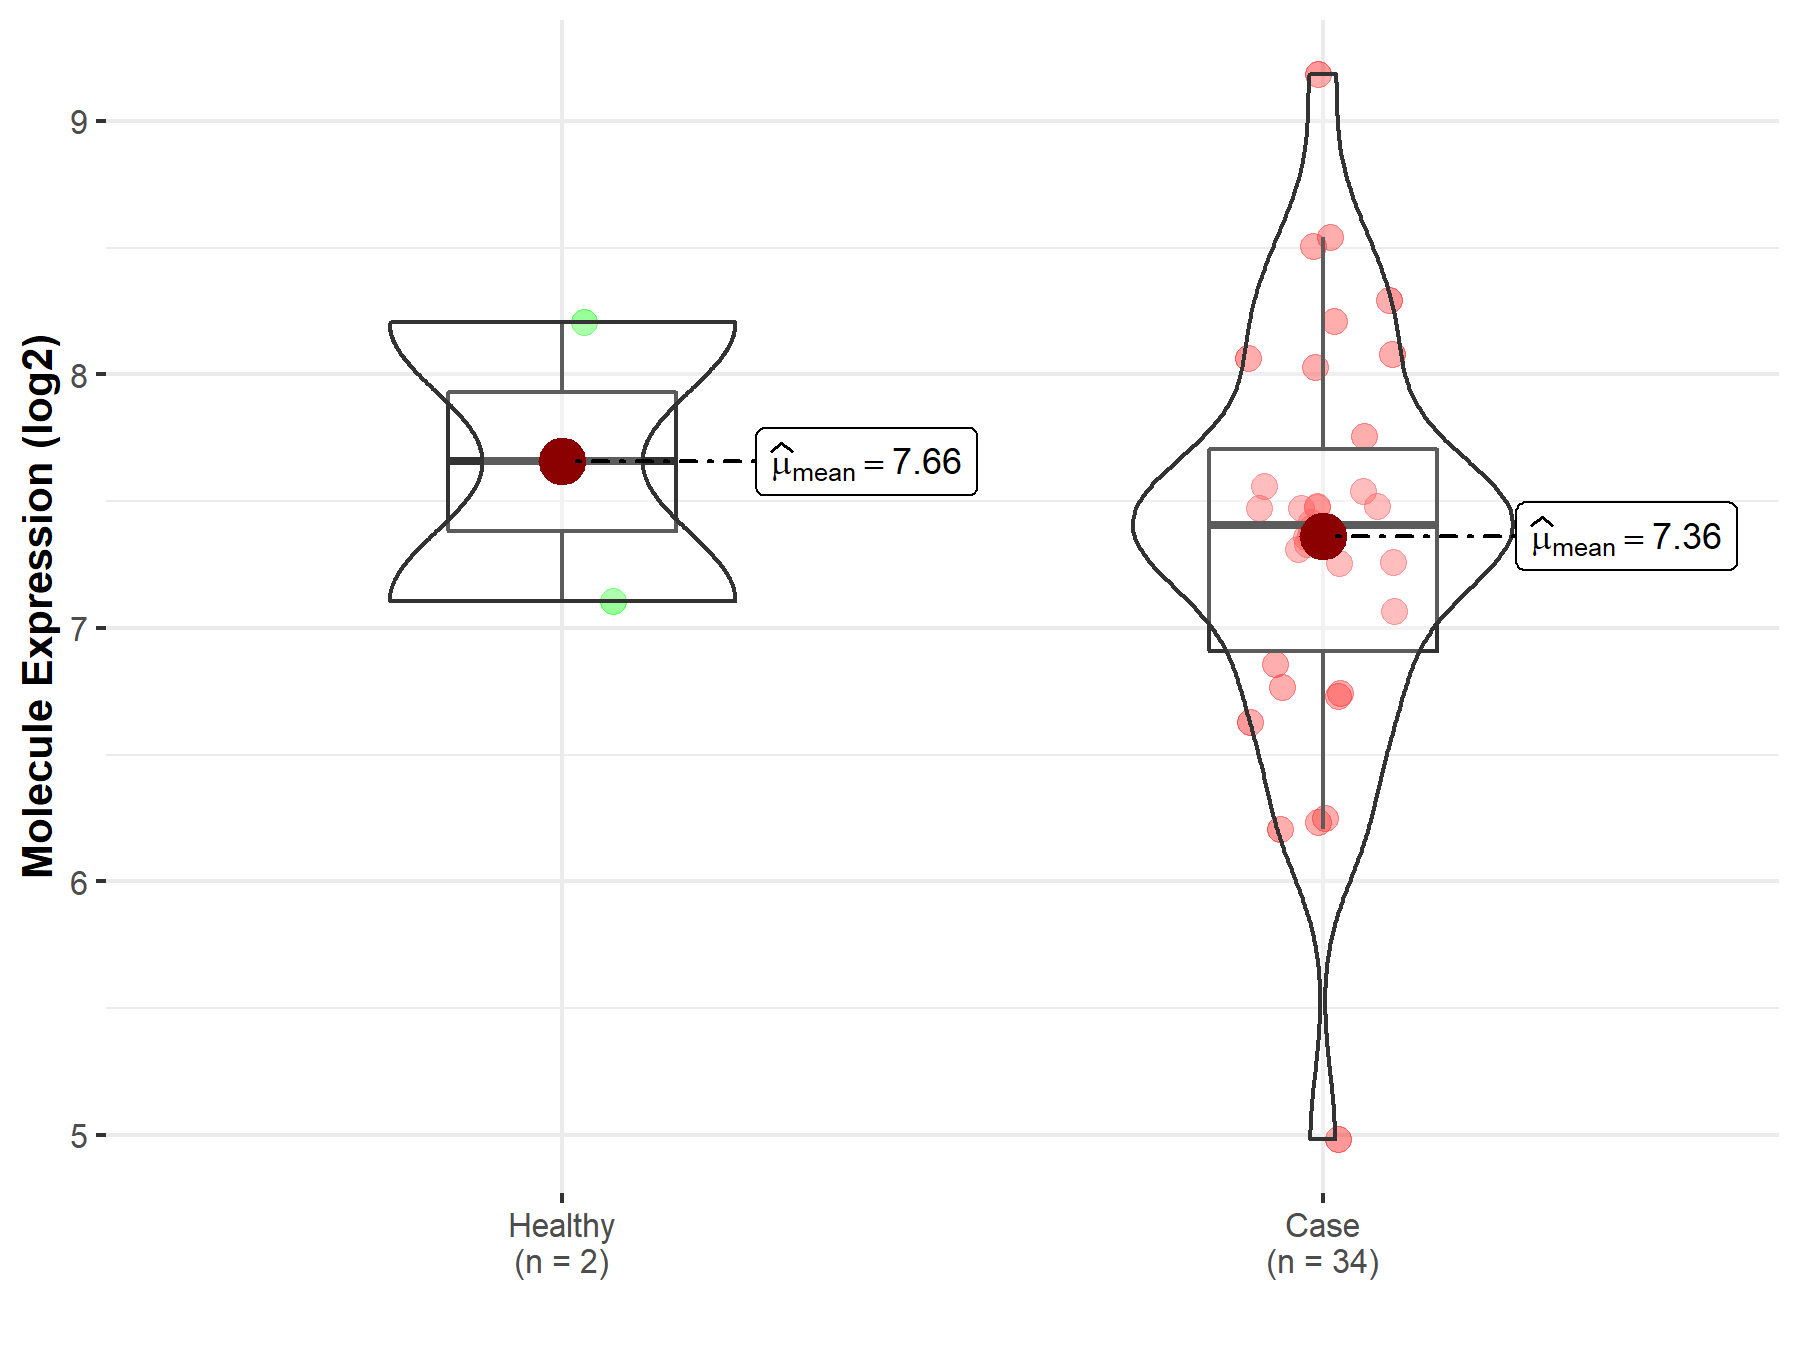
|
Click to View the Clearer Original Diagram |
| The Studied Tissue | White matter | |
| The Specified Disease | Glioma | |
| The Expression Level of Disease Section Compare with the Healthy Individual Tissue | p-value: 9.24E-02; Fold-change: -8.49E-01; Z-score: -5.22E-01 | |
|
Molecule expression in the diseased tissue of patients
Molecule expression in the normal tissue of healthy individuals
|
||
| Disease-specific Molecule Abundances |
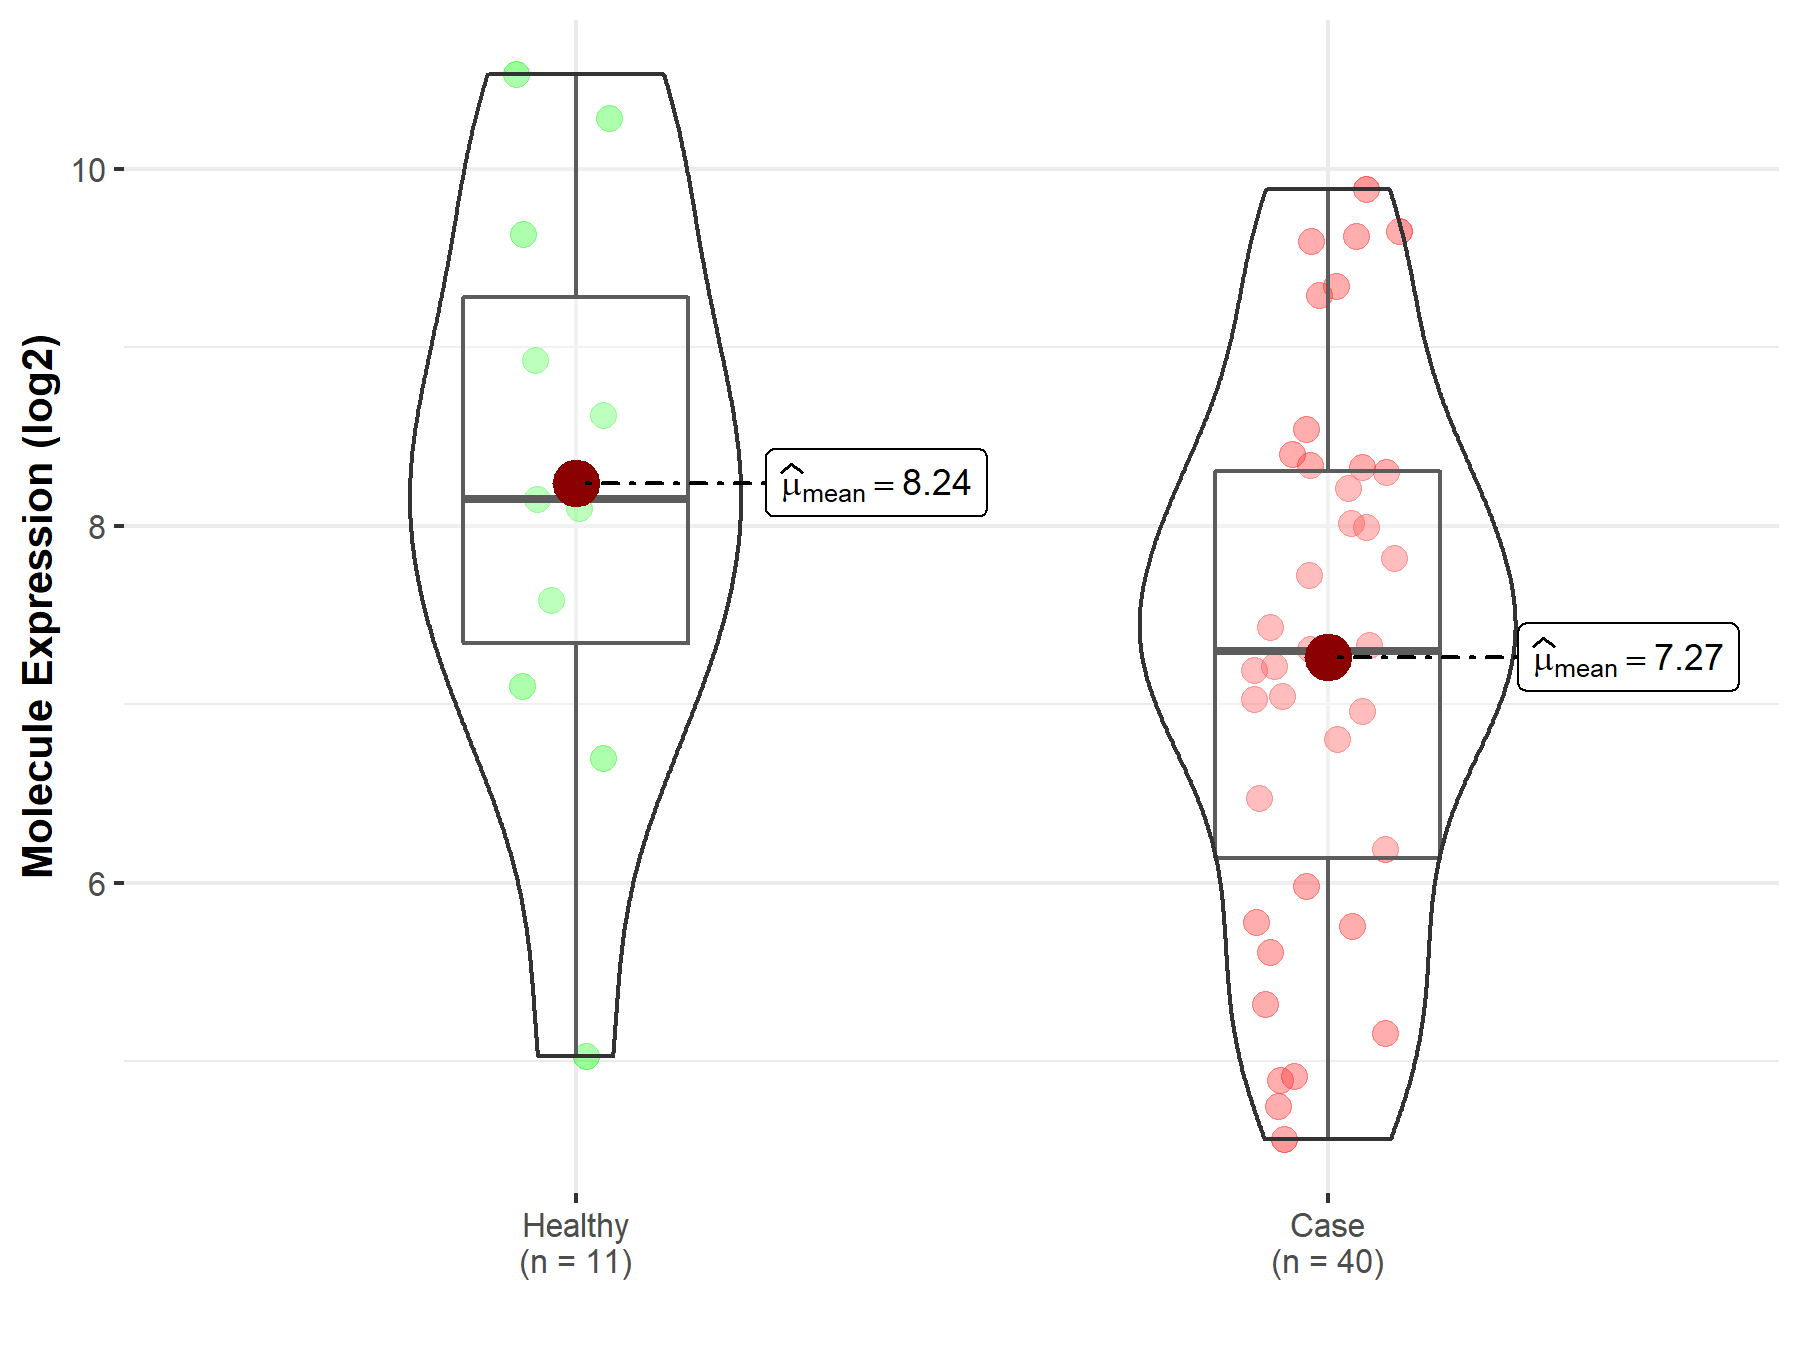
|
Click to View the Clearer Original Diagram |
| The Studied Tissue | Brainstem tissue | |
| The Specified Disease | Neuroectodermal tumor | |
| The Expression Level of Disease Section Compare with the Healthy Individual Tissue | p-value: 1.01E-01; Fold-change: -2.88E-01; Z-score: -6.33E-01 | |
|
Molecule expression in the diseased tissue of patients
Molecule expression in the normal tissue of healthy individuals
|
||
| Disease-specific Molecule Abundances |
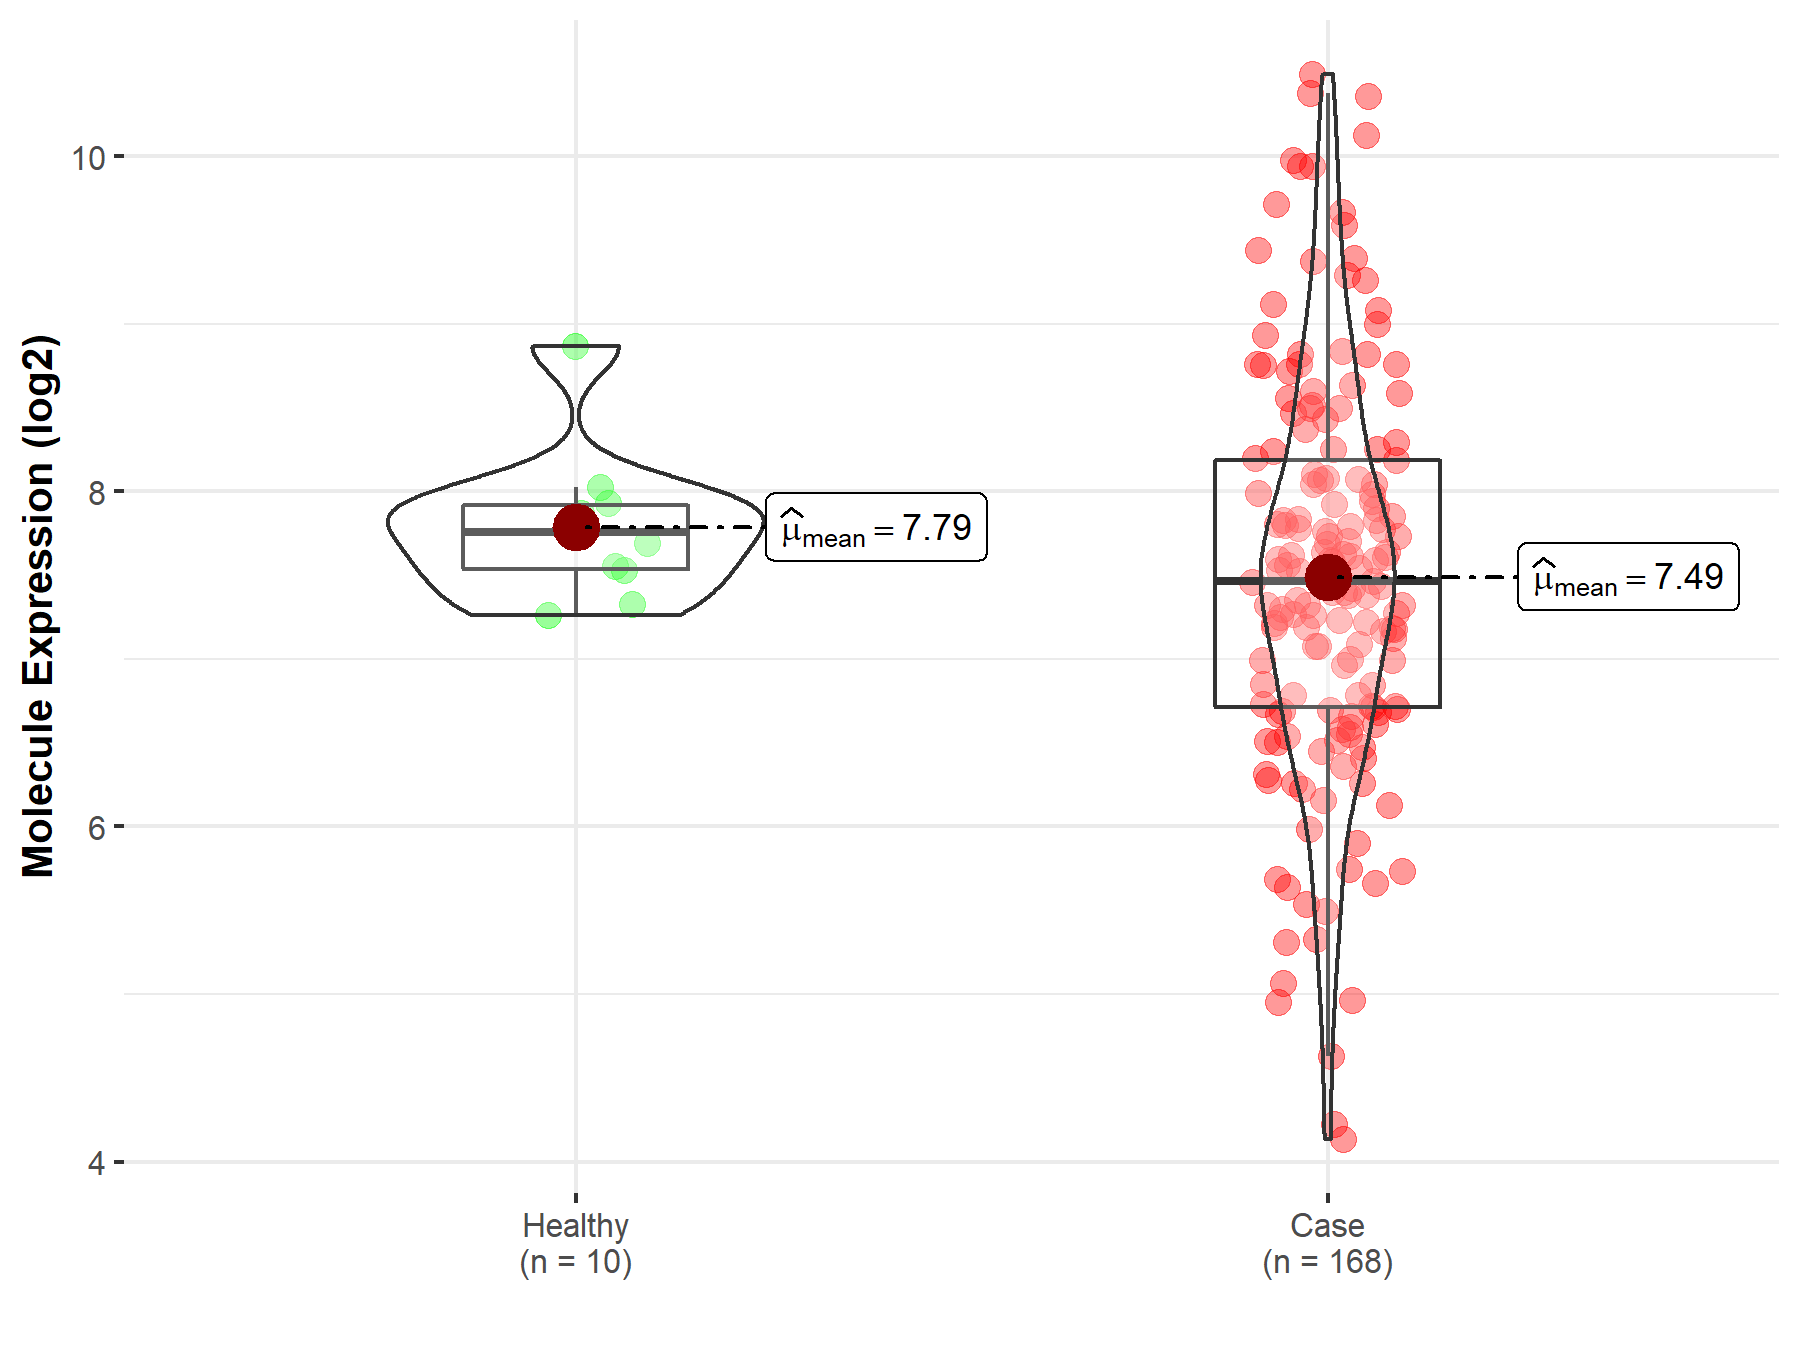
|
Click to View the Clearer Original Diagram |
| Differential expression of molecule in resistant diseases | ||
| The Studied Tissue | Whole blood | |
| The Specified Disease | Myelofibrosis | |
| The Expression Level of Disease Section Compare with the Healthy Individual Tissue | p-value: 8.22E-03; Fold-change: 1.38E+00; Z-score: 4.26E+00 | |
|
Molecule expression in the diseased tissue of patients
Molecule expression in the normal tissue of healthy individuals
|
||
| Disease-specific Molecule Abundances |
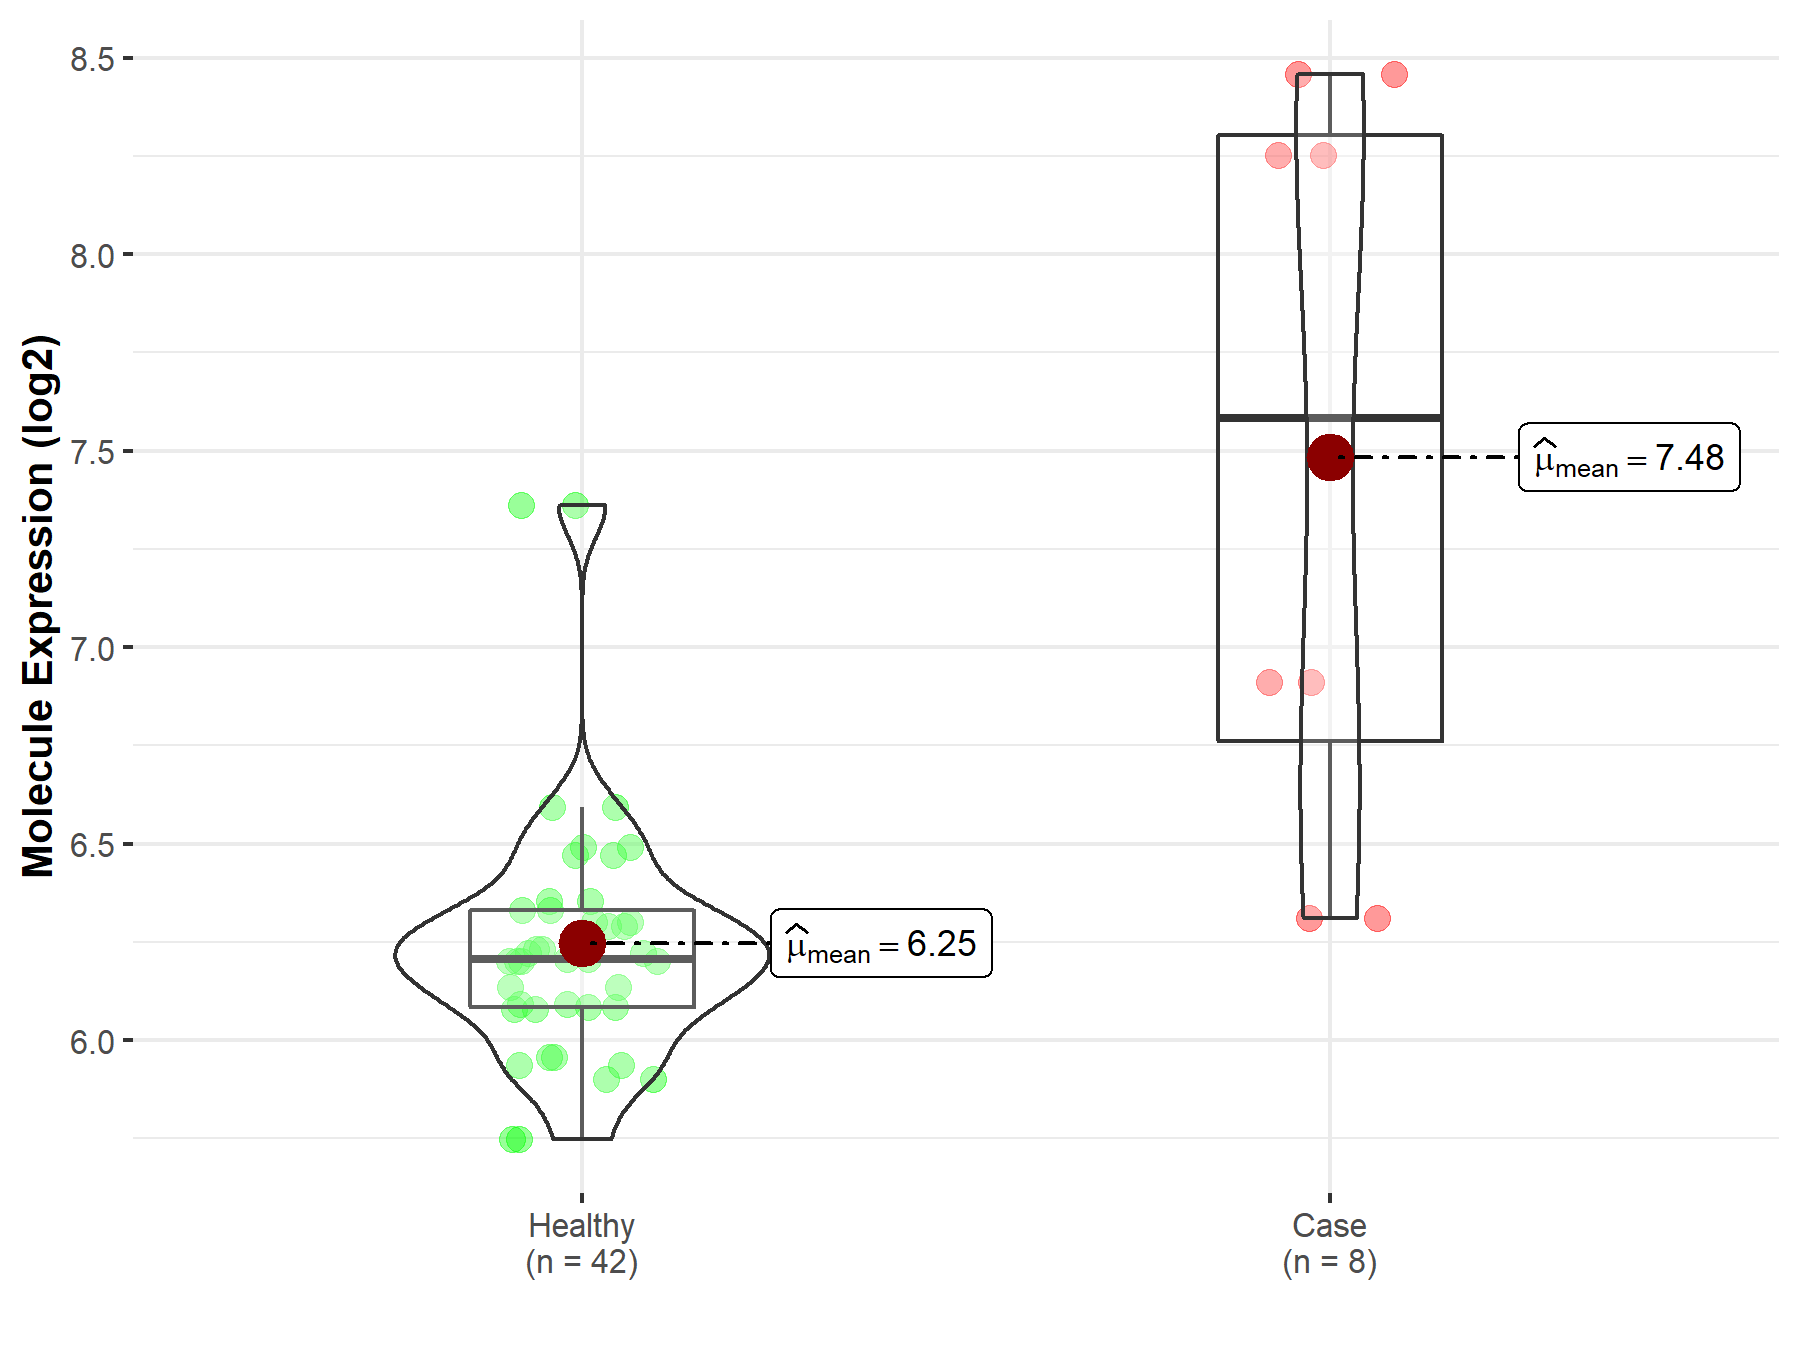
|
Click to View the Clearer Original Diagram |
| The Studied Tissue | Whole blood | |
| The Specified Disease | Polycythemia vera | |
| The Expression Level of Disease Section Compare with the Healthy Individual Tissue | p-value: 6.04E-15; Fold-change: 5.83E-01; Z-score: 1.90E+00 | |
|
Molecule expression in the diseased tissue of patients
Molecule expression in the normal tissue of healthy individuals
|
||
| Disease-specific Molecule Abundances |
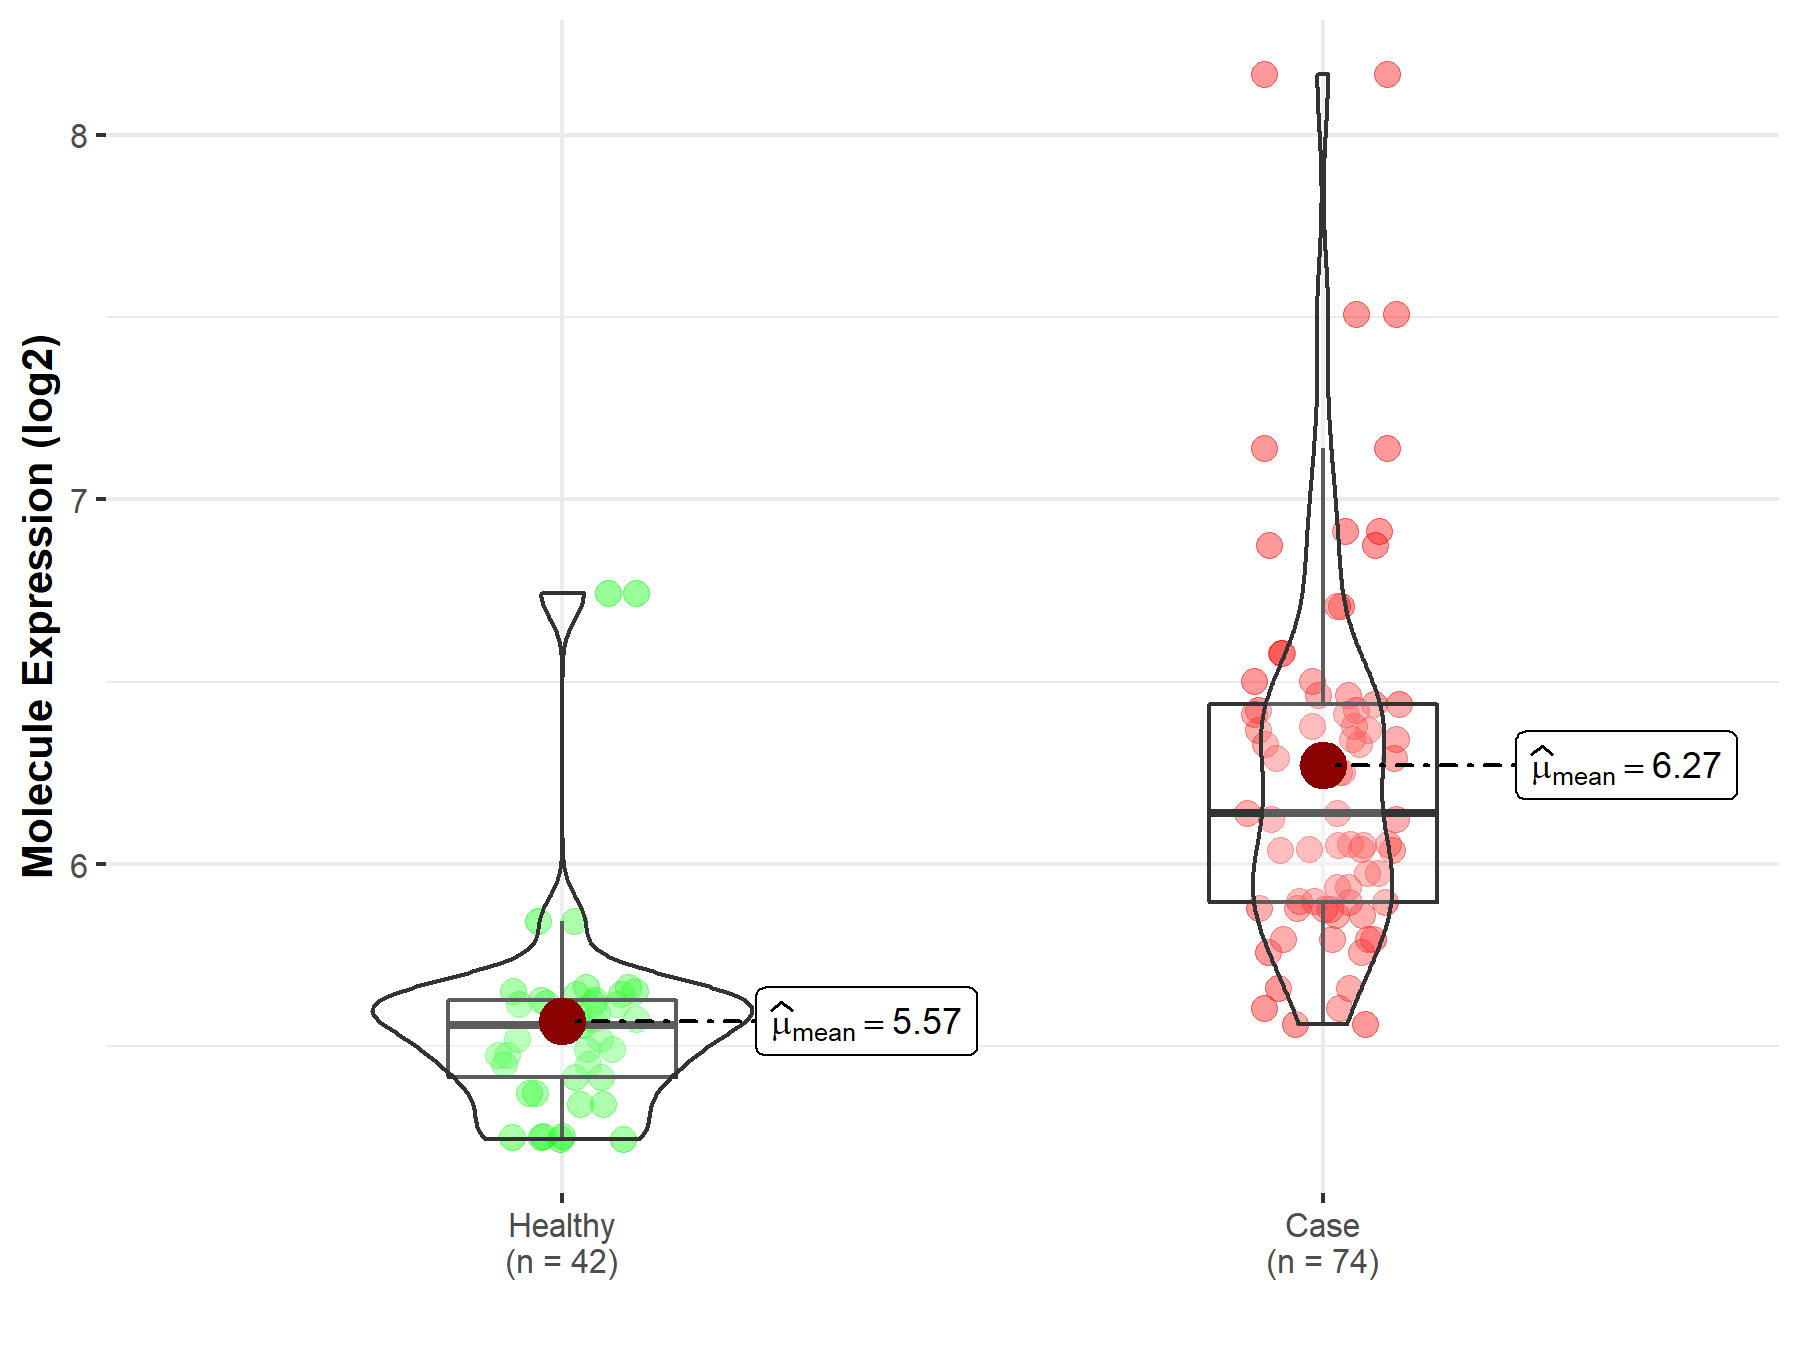
|
Click to View the Clearer Original Diagram |
| Differential expression of molecule in resistant diseases | ||
| The Studied Tissue | Oral tissue | |
| The Specified Disease | Oral squamous cell carcinoma | |
| The Expression Level of Disease Section Compare with the Healthy Individual Tissue | p-value: 1.32E-01; Fold-change: 3.44E-01; Z-score: 4.51E-01 | |
| The Expression Level of Disease Section Compare with the Adjacent Tissue | p-value: 1.29E-03; Fold-change: -3.08E-01; Z-score: -6.42E-01 | |
|
Molecule expression in the normal tissue adjacent to the diseased tissue of patients
Molecule expression in the diseased tissue of patients
Molecule expression in the normal tissue of healthy individuals
|
||
| Disease-specific Molecule Abundances |

|
Click to View the Clearer Original Diagram |
| Differential expression of molecule in resistant diseases | ||
| The Studied Tissue | Esophagus | |
| The Specified Disease | Esophageal cancer | |
| The Expression Level of Disease Section Compare with the Adjacent Tissue | p-value: 2.82E-01; Fold-change: -3.51E-01; Z-score: -4.33E-01 | |
|
Molecule expression in the normal tissue adjacent to the diseased tissue of patients
Molecule expression in the diseased tissue of patients
|
||
| Disease-specific Molecule Abundances |

|
Click to View the Clearer Original Diagram |
| Differential expression of molecule in resistant diseases | ||
| The Studied Tissue | Gastric tissue | |
| The Specified Disease | Gastric cancer | |
| The Expression Level of Disease Section Compare with the Healthy Individual Tissue | p-value: 2.57E-03; Fold-change: 1.18E+00; Z-score: 6.01E+00 | |
| The Expression Level of Disease Section Compare with the Adjacent Tissue | p-value: 5.31E-01; Fold-change: 7.41E-01; Z-score: 5.74E-01 | |
|
Molecule expression in the normal tissue adjacent to the diseased tissue of patients
Molecule expression in the diseased tissue of patients
Molecule expression in the normal tissue of healthy individuals
|
||
| Disease-specific Molecule Abundances |
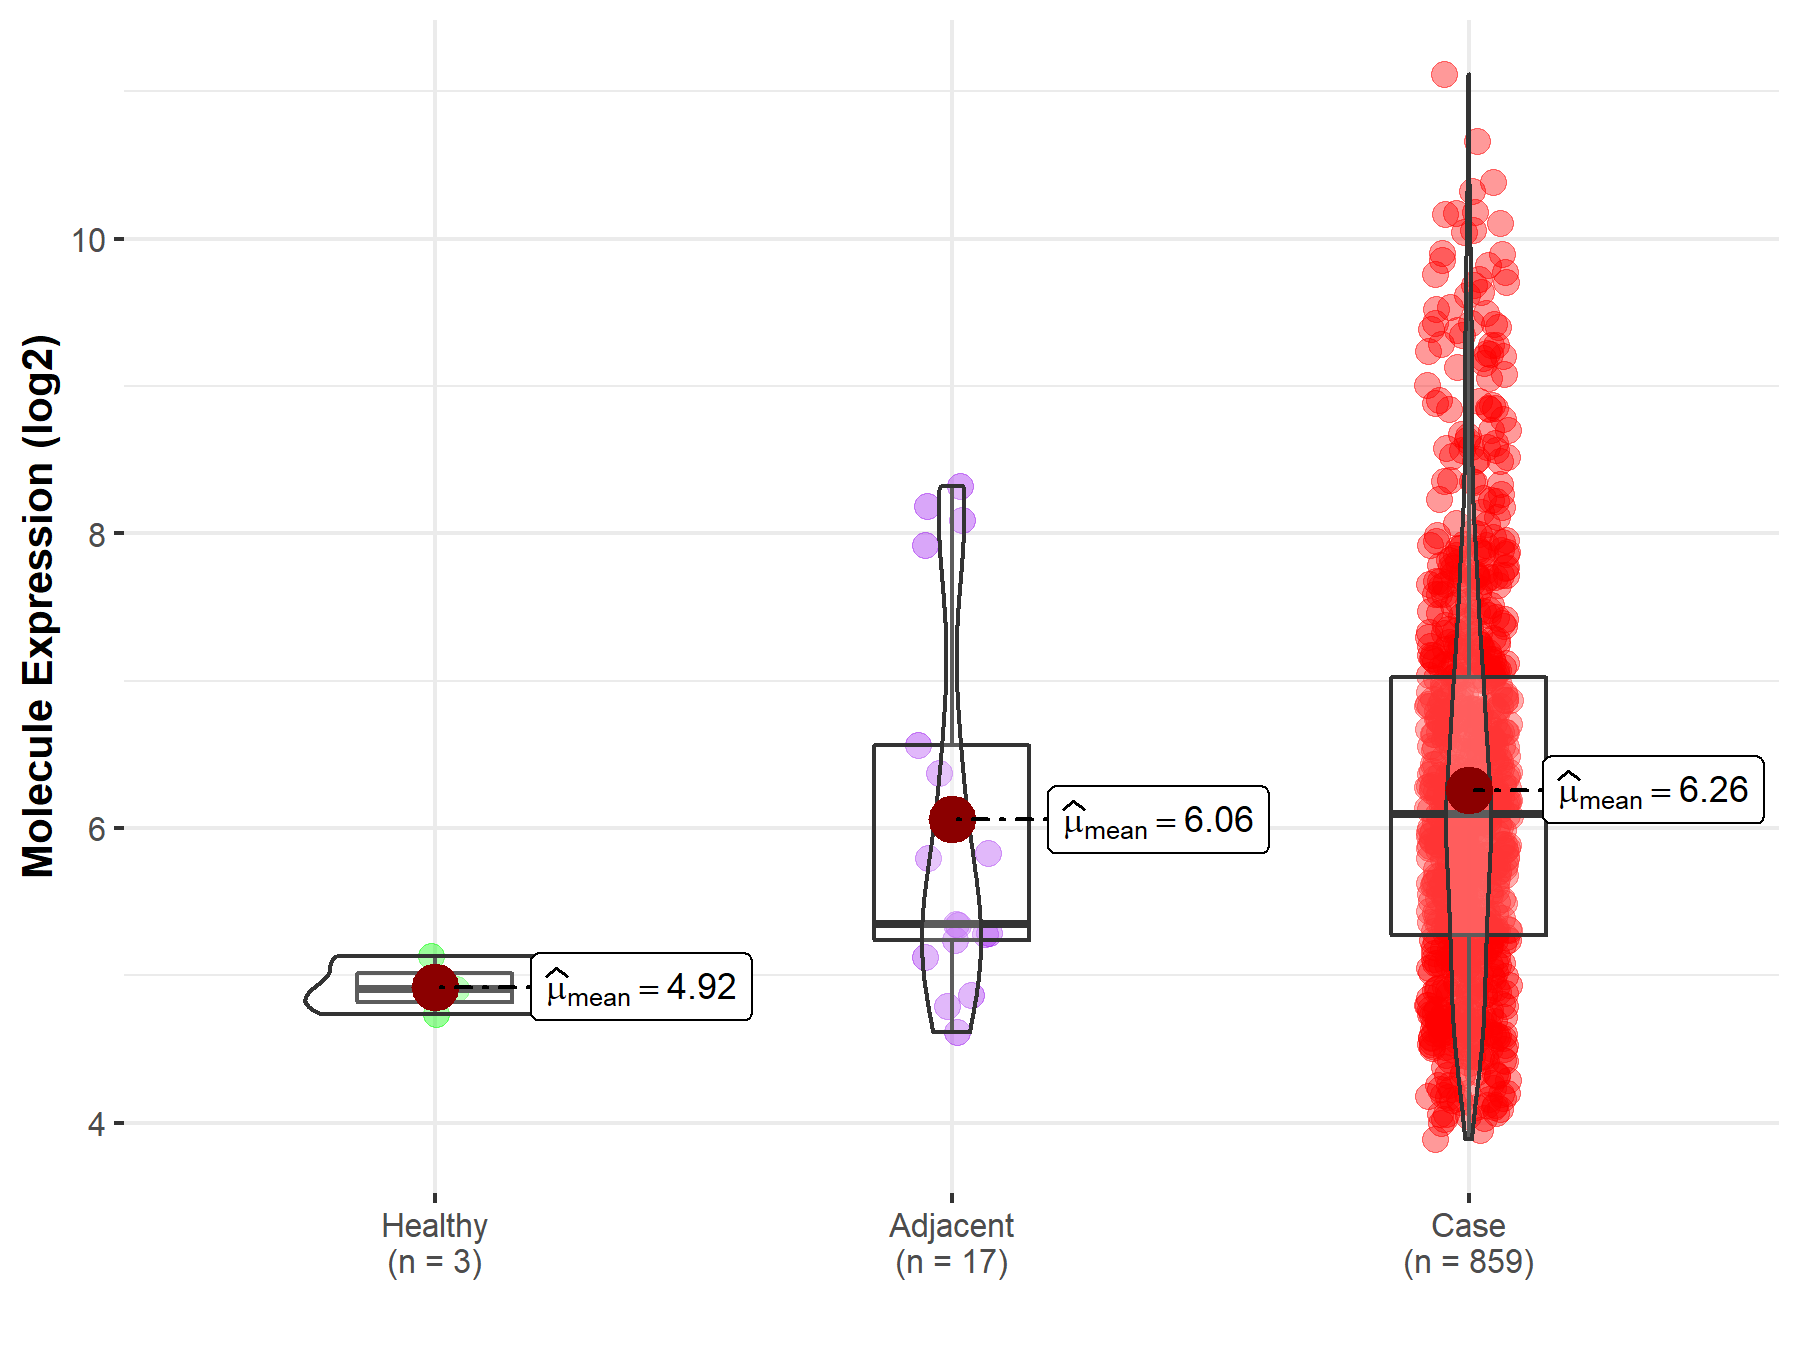
|
Click to View the Clearer Original Diagram |
| Differential expression of molecule in resistant diseases | ||
| The Studied Tissue | Colon | |
| The Specified Disease | Colon cancer | |
| The Expression Level of Disease Section Compare with the Healthy Individual Tissue | p-value: 1.83E-95; Fold-change: -5.61E+00; Z-score: -4.08E+00 | |
| The Expression Level of Disease Section Compare with the Adjacent Tissue | p-value: 5.43E-51; Fold-change: -4.63E+00; Z-score: -2.62E+00 | |
|
Molecule expression in the normal tissue adjacent to the diseased tissue of patients
Molecule expression in the diseased tissue of patients
Molecule expression in the normal tissue of healthy individuals
|
||
| Disease-specific Molecule Abundances |
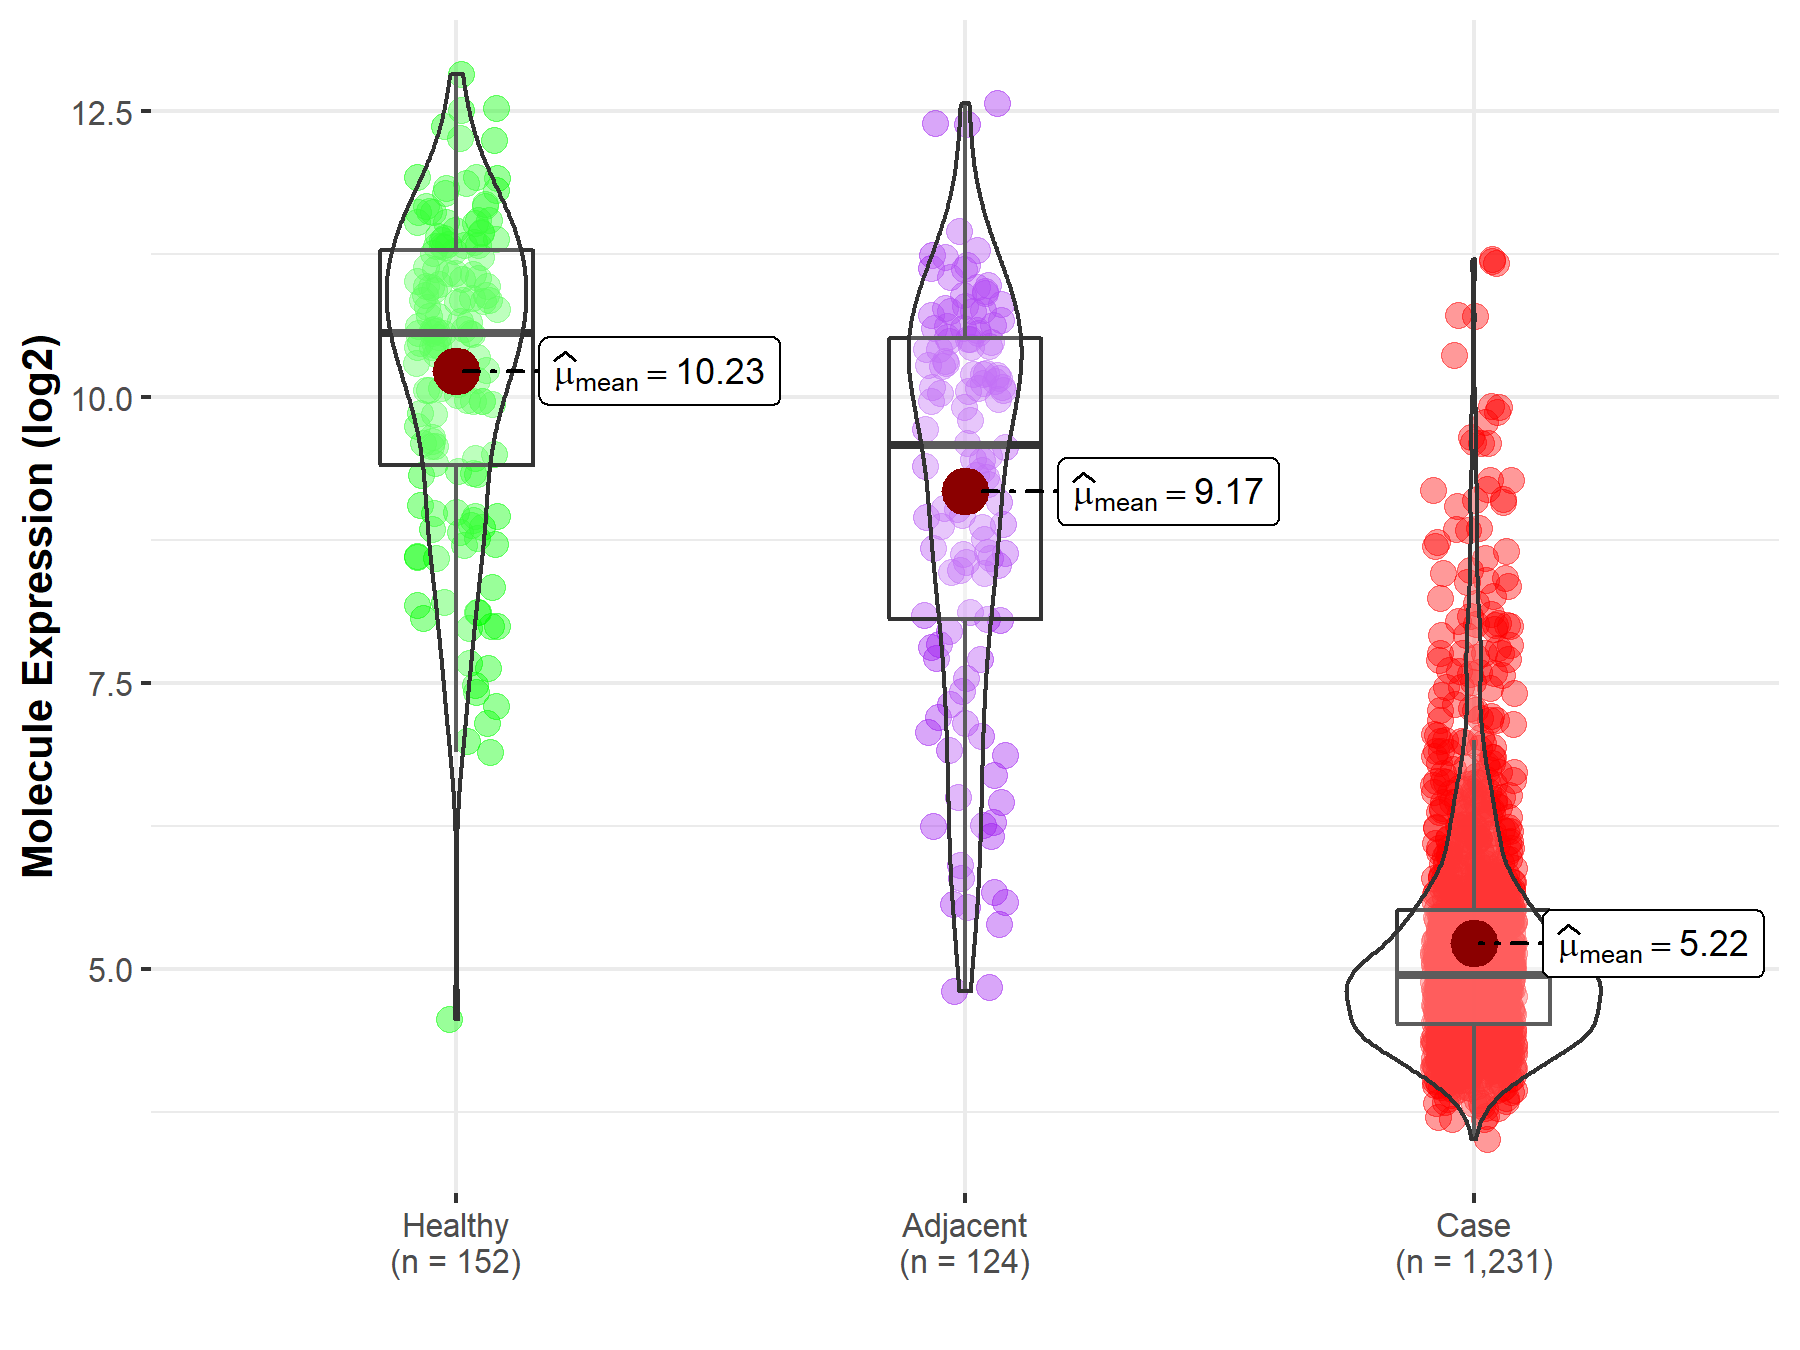
|
Click to View the Clearer Original Diagram |
| Differential expression of molecule in resistant diseases | ||
| The Studied Tissue | Liver | |
| The Specified Disease | Liver cancer | |
| The Expression Level of Disease Section Compare with the Healthy Individual Tissue | p-value: 9.85E-09; Fold-change: -1.57E+00; Z-score: -1.47E+00 | |
| The Expression Level of Disease Section Compare with the Adjacent Tissue | p-value: 4.18E-31; Fold-change: -1.31E+00; Z-score: -1.79E+00 | |
| The Expression Level of Disease Section Compare with the Other Disease Section | p-value: 2.57E-02; Fold-change: -1.38E+00; Z-score: -2.02E+00 | |
|
Molecule expression in the normal tissue adjacent to the diseased tissue of patients
Molecule expression in the diseased tissue of patients
Molecule expression in the normal tissue of healthy individuals
Molecule expression in tissue other than the diseased tissue of patients
|
||
| Disease-specific Molecule Abundances |
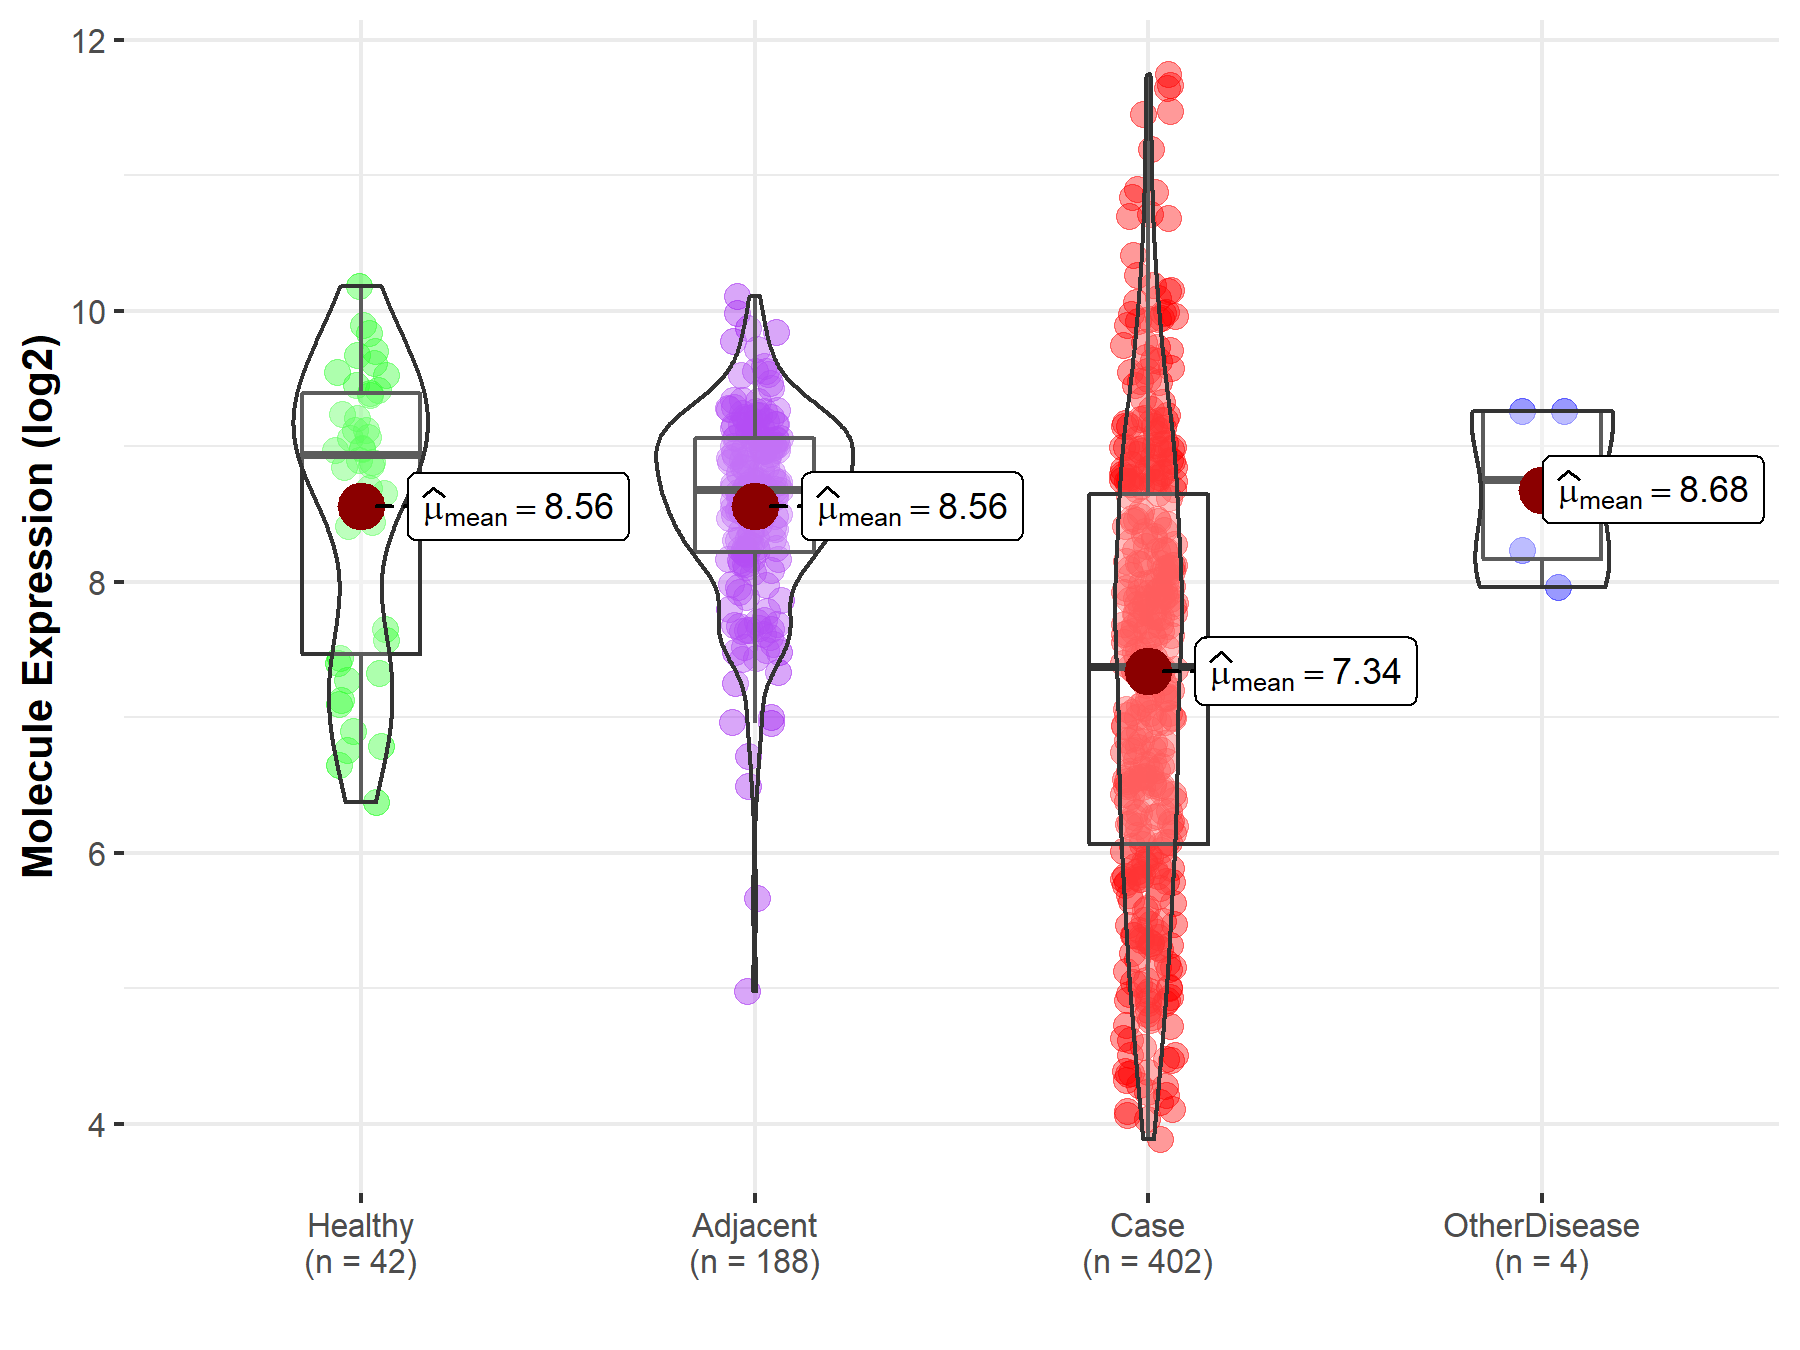
|
Click to View the Clearer Original Diagram |
| Differential expression of molecule in resistant diseases | ||
| The Studied Tissue | Lung | |
| The Specified Disease | Lung cancer | |
| The Expression Level of Disease Section Compare with the Healthy Individual Tissue | p-value: 3.87E-47; Fold-change: -1.28E+00; Z-score: -1.63E+00 | |
| The Expression Level of Disease Section Compare with the Adjacent Tissue | p-value: 1.29E-43; Fold-change: -1.56E+00; Z-score: -2.12E+00 | |
|
Molecule expression in the normal tissue adjacent to the diseased tissue of patients
Molecule expression in the diseased tissue of patients
Molecule expression in the normal tissue of healthy individuals
|
||
| Disease-specific Molecule Abundances |
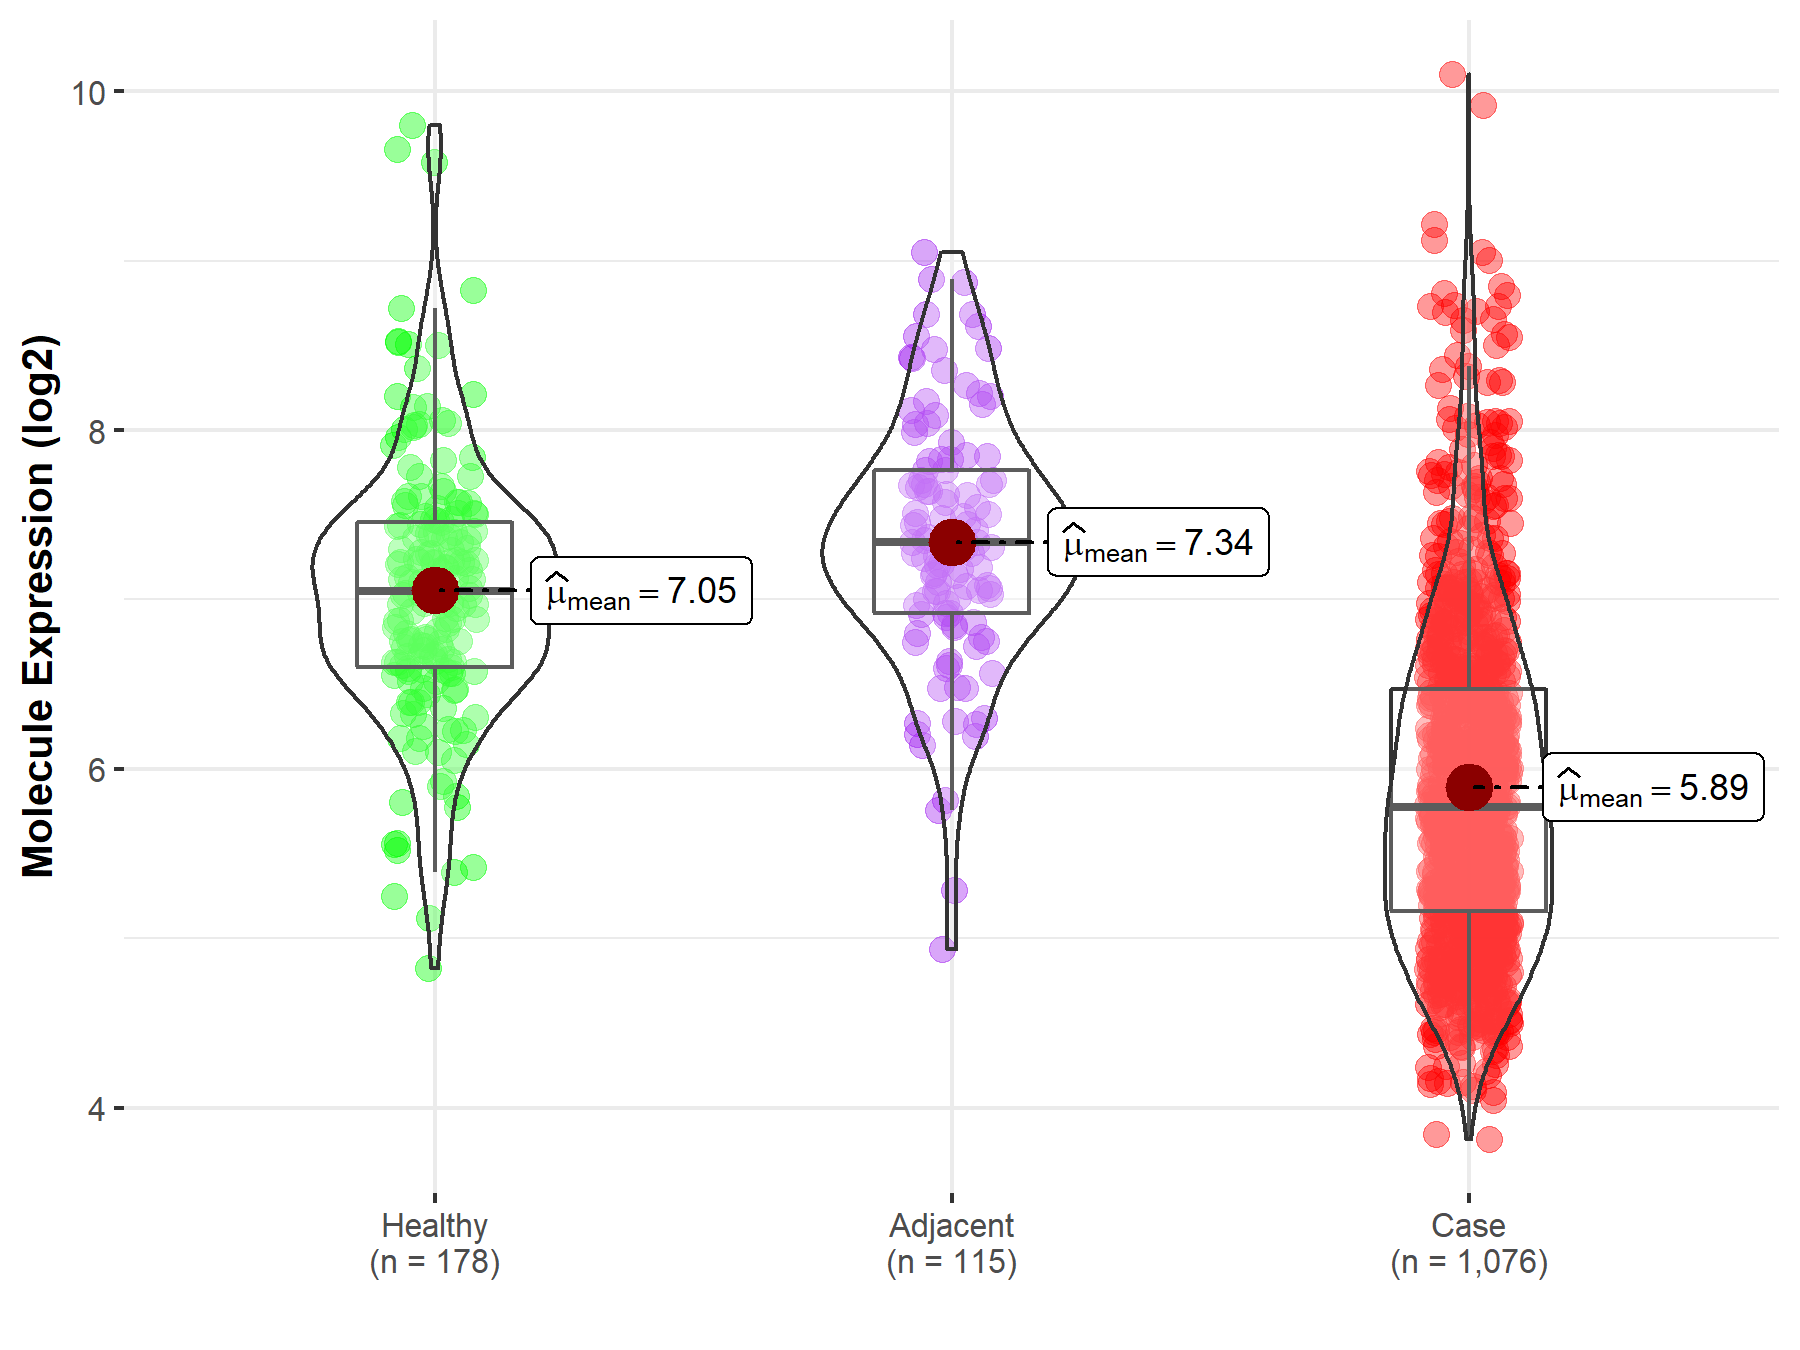
|
Click to View the Clearer Original Diagram |
| Differential expression of molecule in resistant diseases | ||
| The Studied Tissue | Muscle | |
| The Specified Disease | Sarcoma | |
| The Expression Level of Disease Section Compare with the Healthy Individual Tissue | p-value: 7.58E-56; Fold-change: 5.96E-01; Z-score: 1.15E+00 | |
| The Expression Level of Disease Section Compare with the Adjacent Tissue | p-value: 3.57E-05; Fold-change: 6.59E-01; Z-score: 5.57E+00 | |
|
Molecule expression in the normal tissue adjacent to the diseased tissue of patients
Molecule expression in the diseased tissue of patients
Molecule expression in the normal tissue of healthy individuals
|
||
| Disease-specific Molecule Abundances |
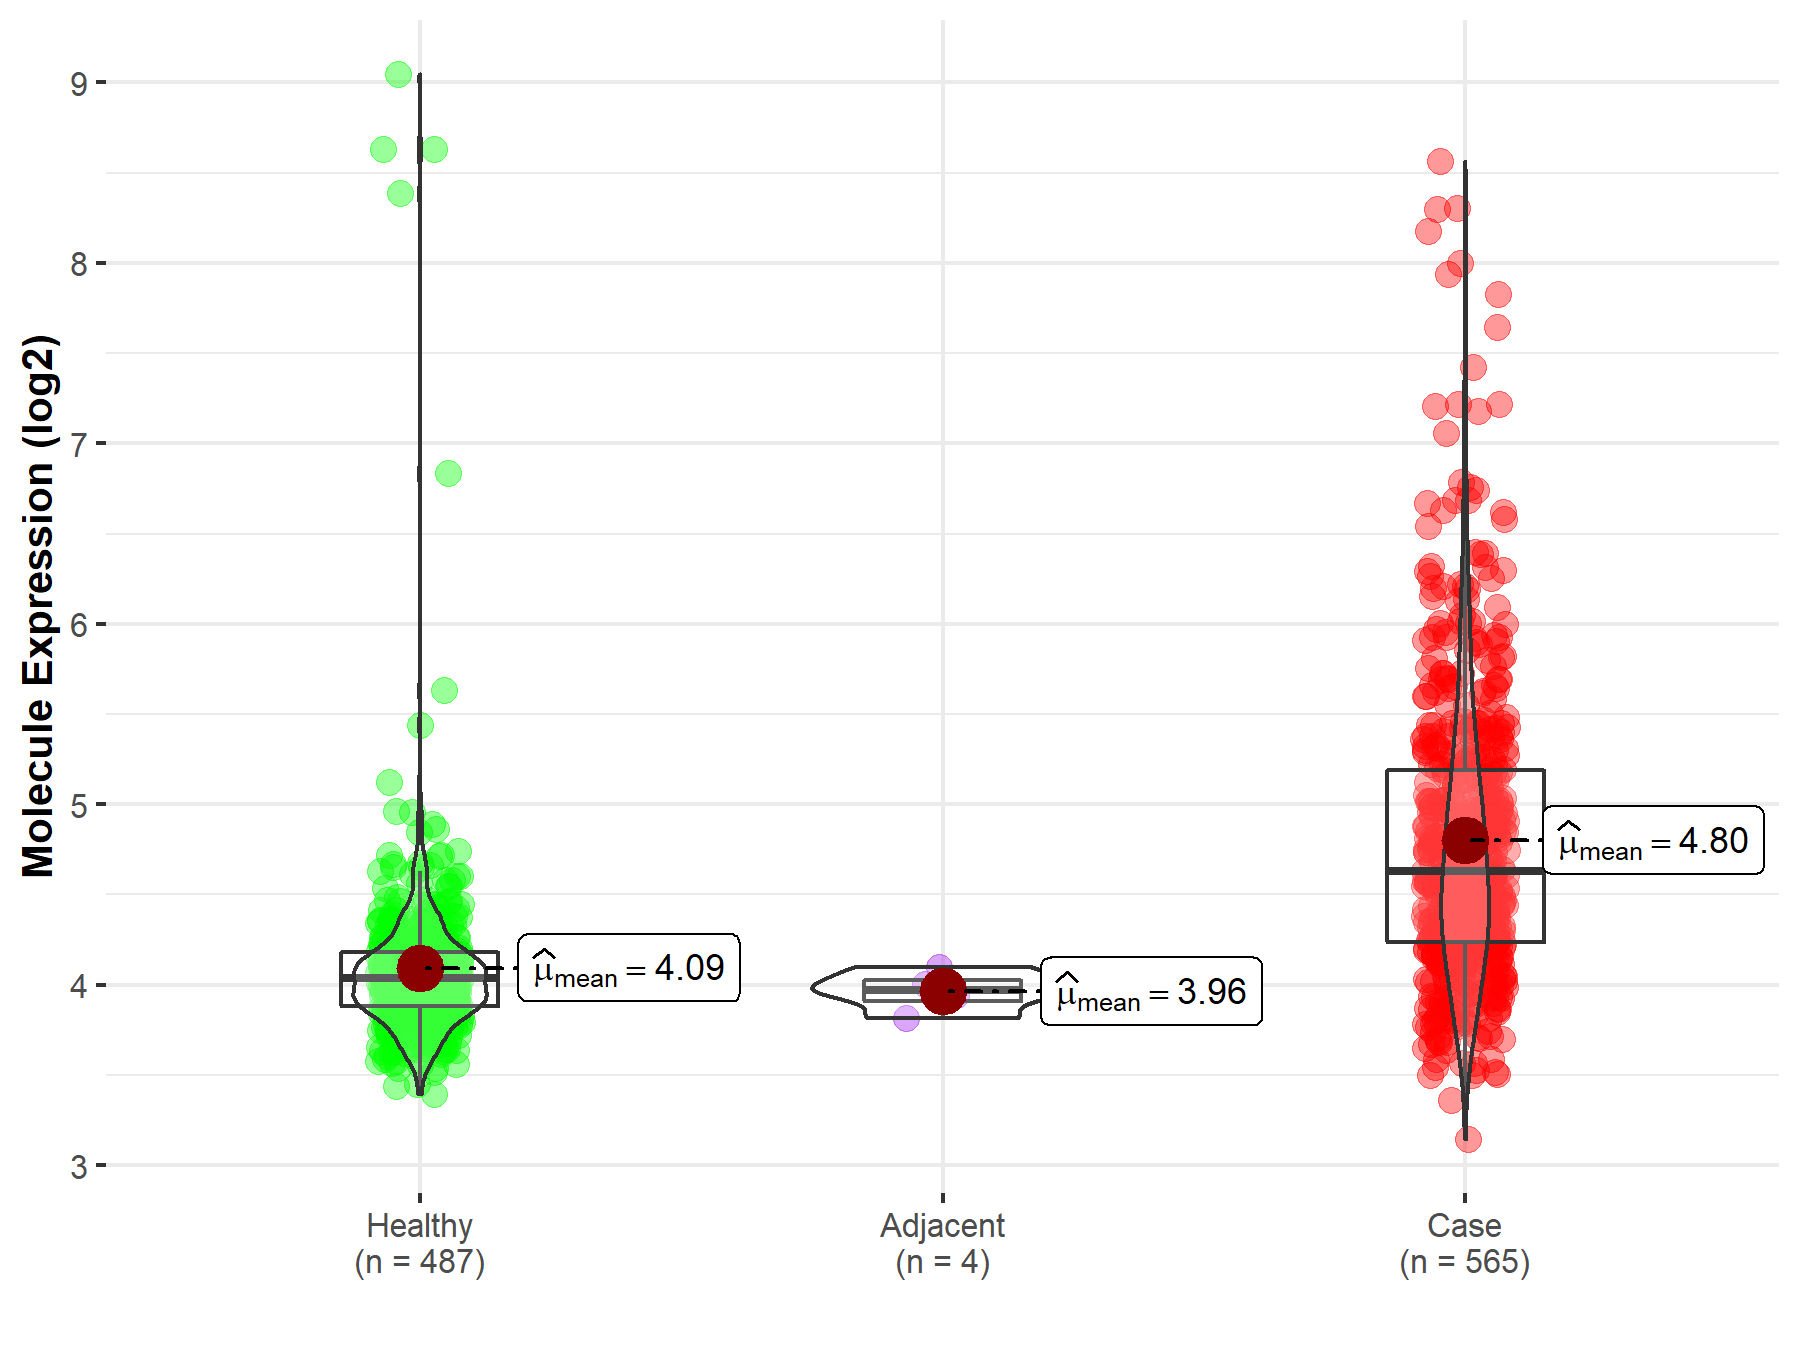
|
Click to View the Clearer Original Diagram |
| Differential expression of molecule in resistant diseases | ||
| The Studied Tissue | Breast tissue | |
| The Specified Disease | Breast cancer | |
| The Expression Level of Disease Section Compare with the Healthy Individual Tissue | p-value: 1.46E-65; Fold-change: -1.41E+00; Z-score: -1.41E+00 | |
| The Expression Level of Disease Section Compare with the Adjacent Tissue | p-value: 5.44E-13; Fold-change: -1.33E+00; Z-score: -1.59E+00 | |
|
Molecule expression in the normal tissue adjacent to the diseased tissue of patients
Molecule expression in the diseased tissue of patients
Molecule expression in the normal tissue of healthy individuals
|
||
| Disease-specific Molecule Abundances |
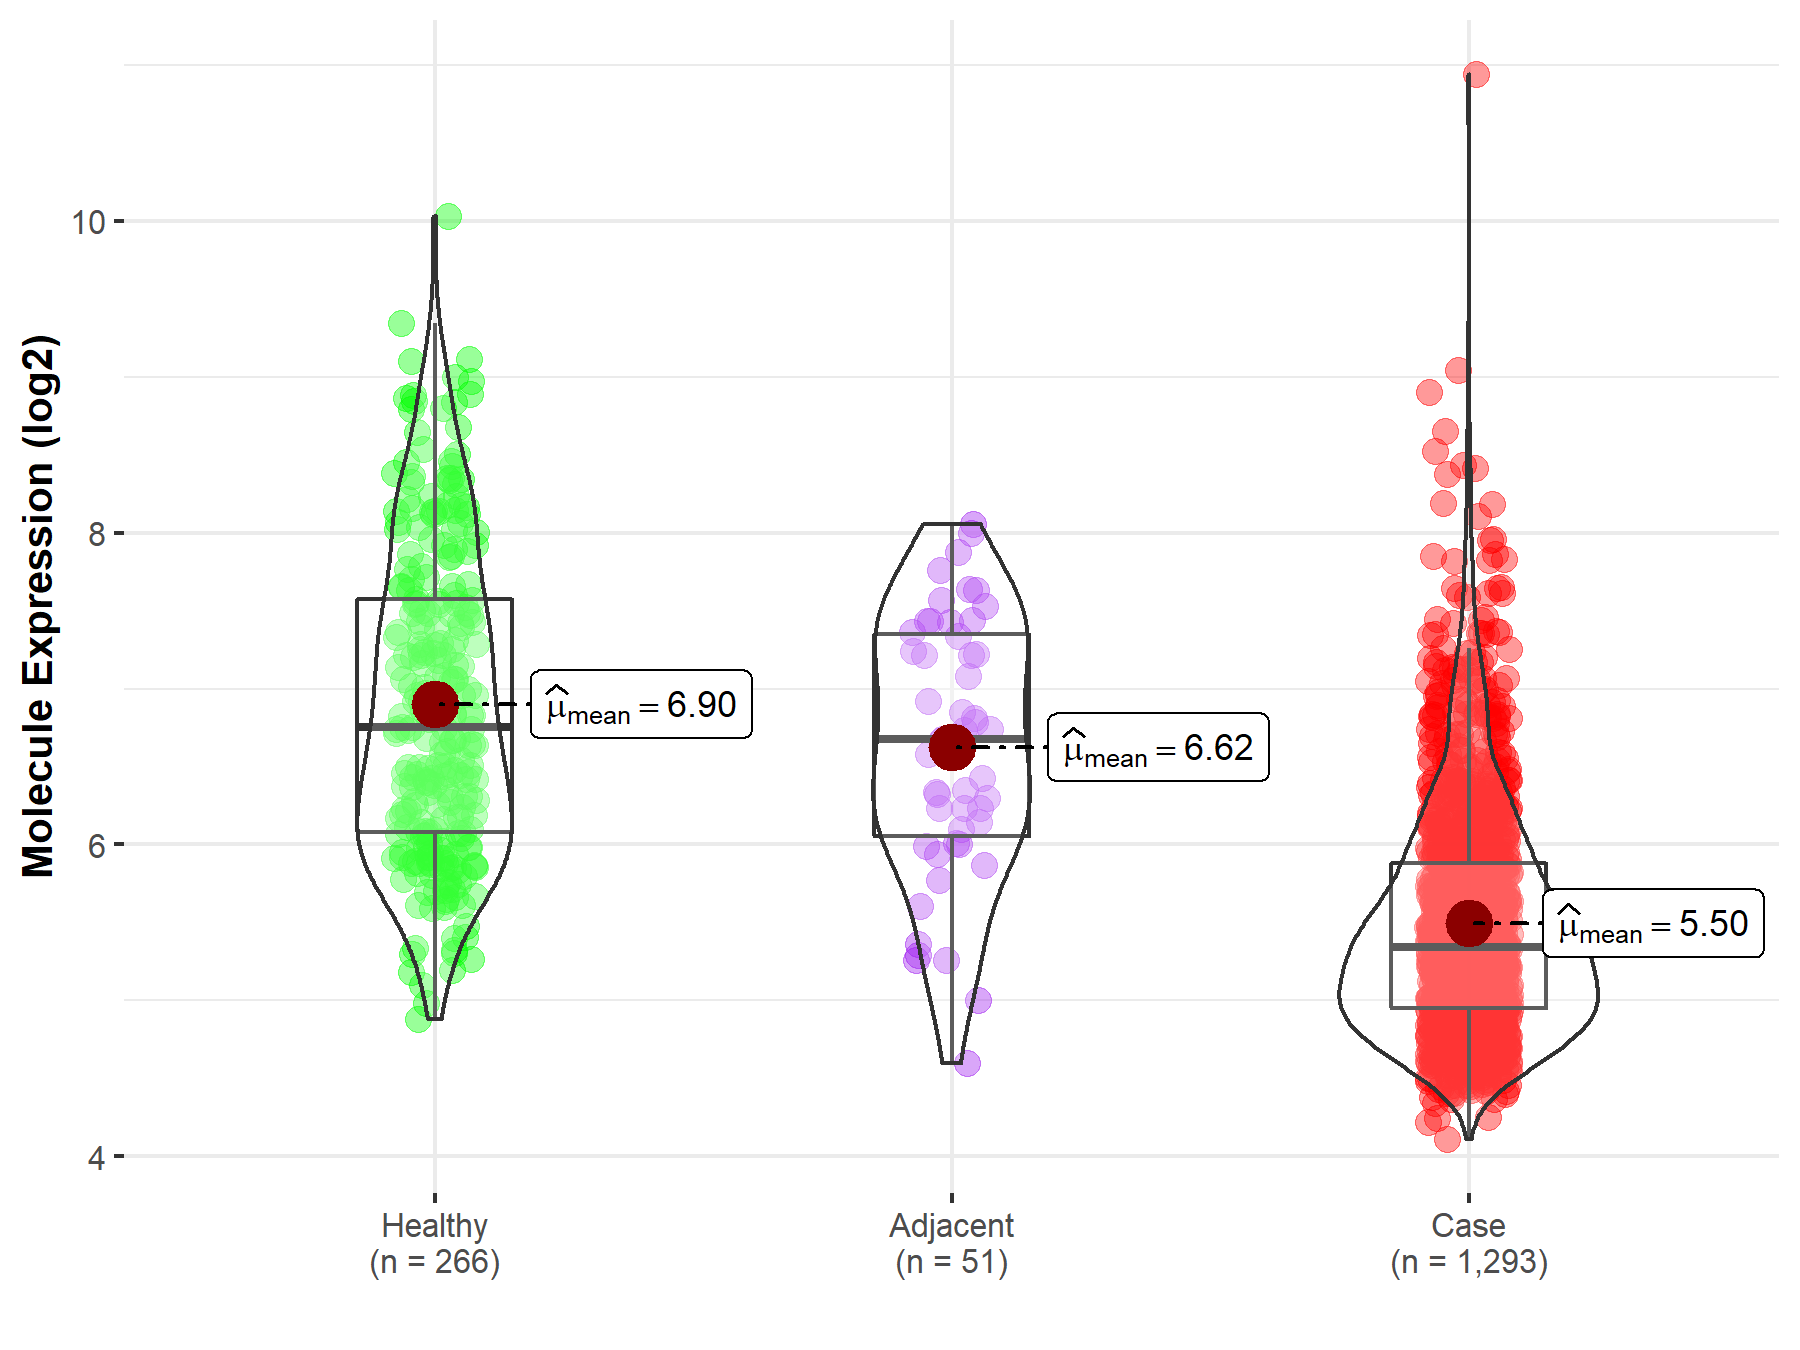
|
Click to View the Clearer Original Diagram |
| Differential expression of molecule in resistant diseases | ||
| The Studied Tissue | Ovary | |
| The Specified Disease | Ovarian cancer | |
| The Expression Level of Disease Section Compare with the Healthy Individual Tissue | p-value: 1.76E-03; Fold-change: -1.19E+00; Z-score: -1.71E+00 | |
| The Expression Level of Disease Section Compare with the Adjacent Tissue | p-value: 5.34E-02; Fold-change: -5.11E-01; Z-score: -7.50E-01 | |
|
Molecule expression in the normal tissue adjacent to the diseased tissue of patients
Molecule expression in the diseased tissue of patients
Molecule expression in the normal tissue of healthy individuals
|
||
| Disease-specific Molecule Abundances |
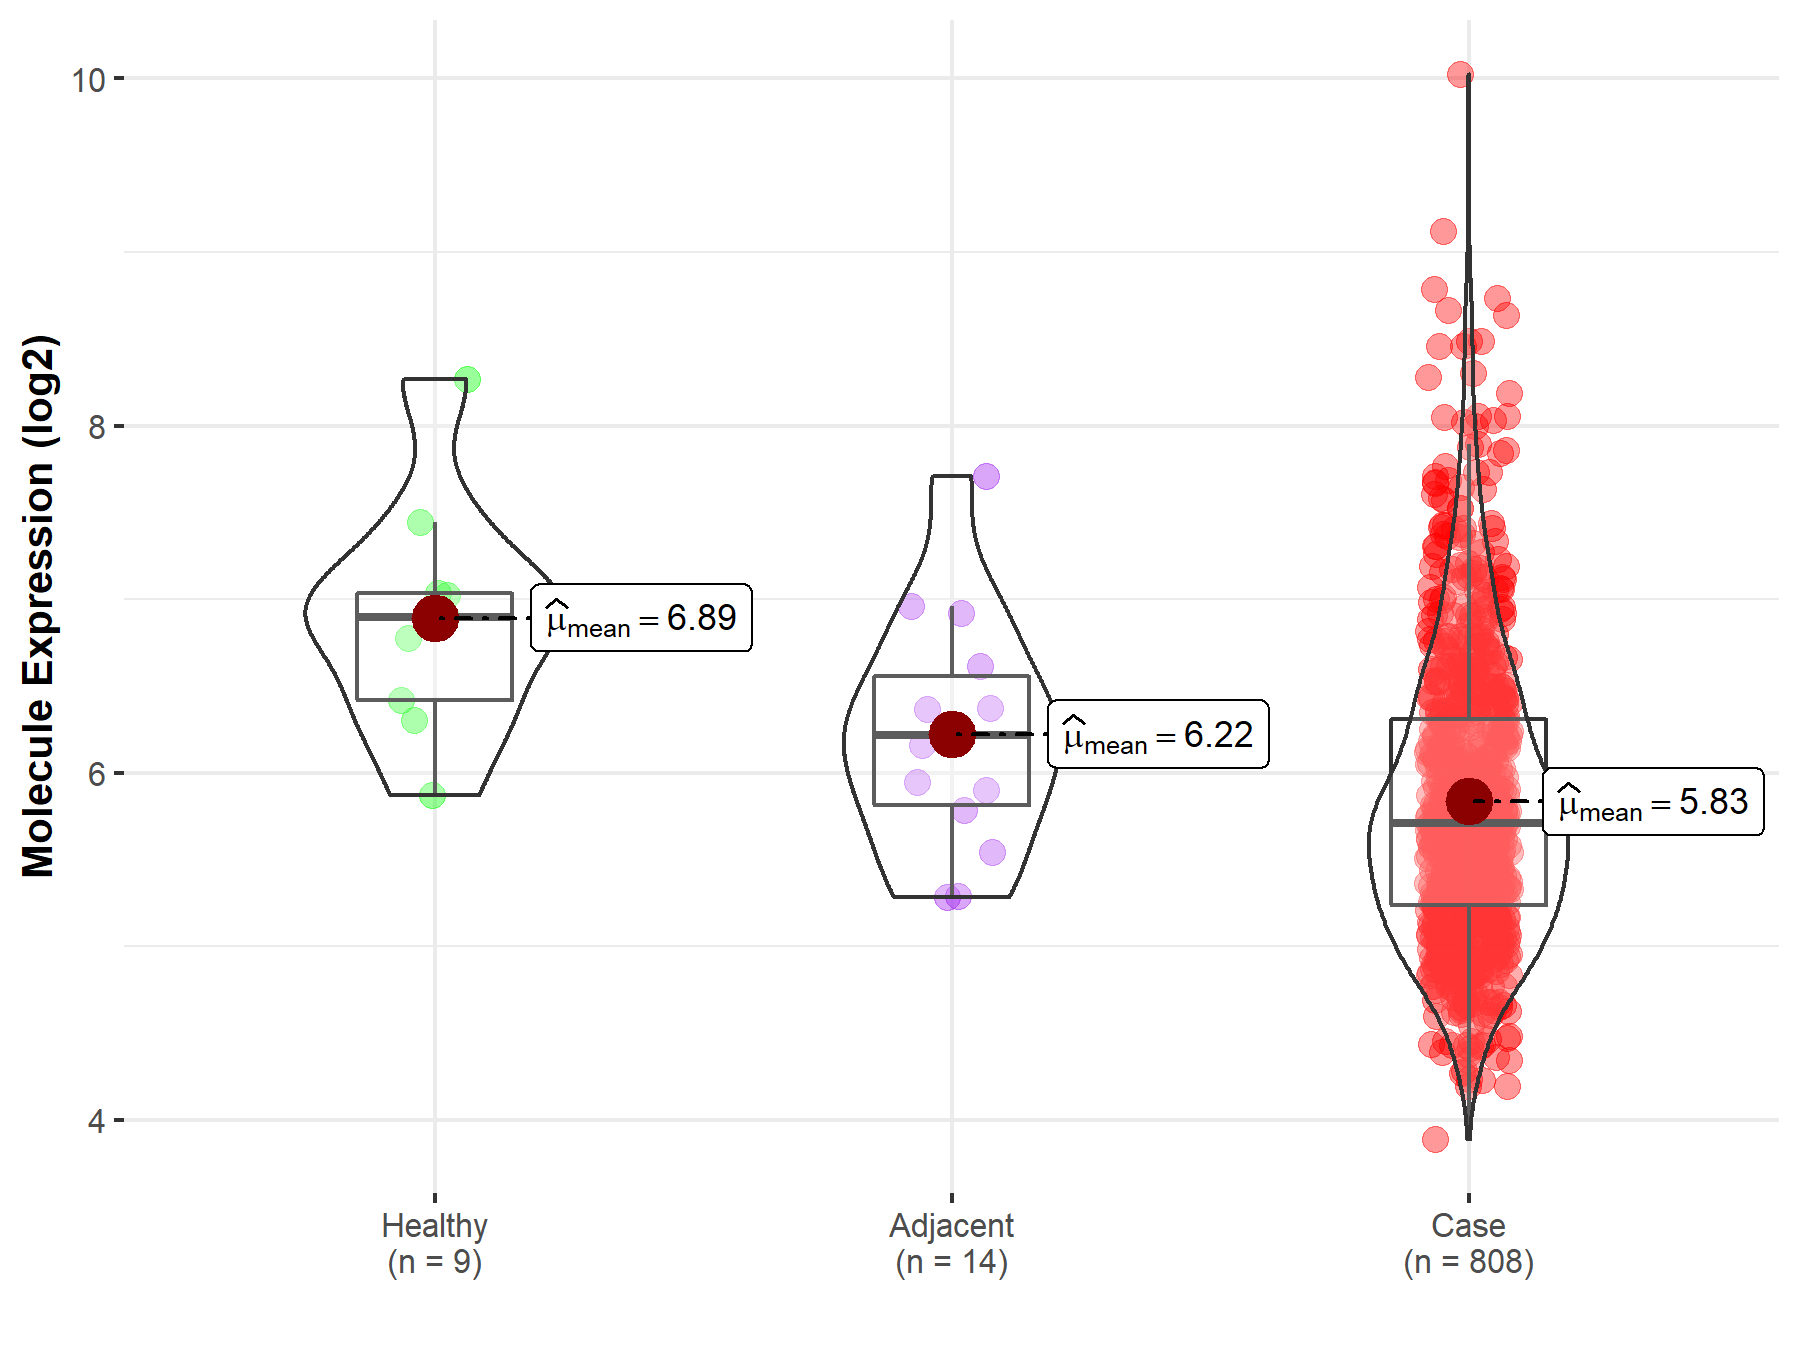
|
Click to View the Clearer Original Diagram |
| Differential expression of molecule in resistant diseases | ||
| The Studied Tissue | Uvea | |
| The Specified Disease | Retinoblastoma tumor | |
| The Expression Level of Disease Section Compare with the Healthy Individual Tissue | p-value: 1.43E-02; Fold-change: -3.15E-01; Z-score: -6.12E-01 | |
|
Molecule expression in the diseased tissue of patients
Molecule expression in the normal tissue of healthy individuals
|
||
| Disease-specific Molecule Abundances |
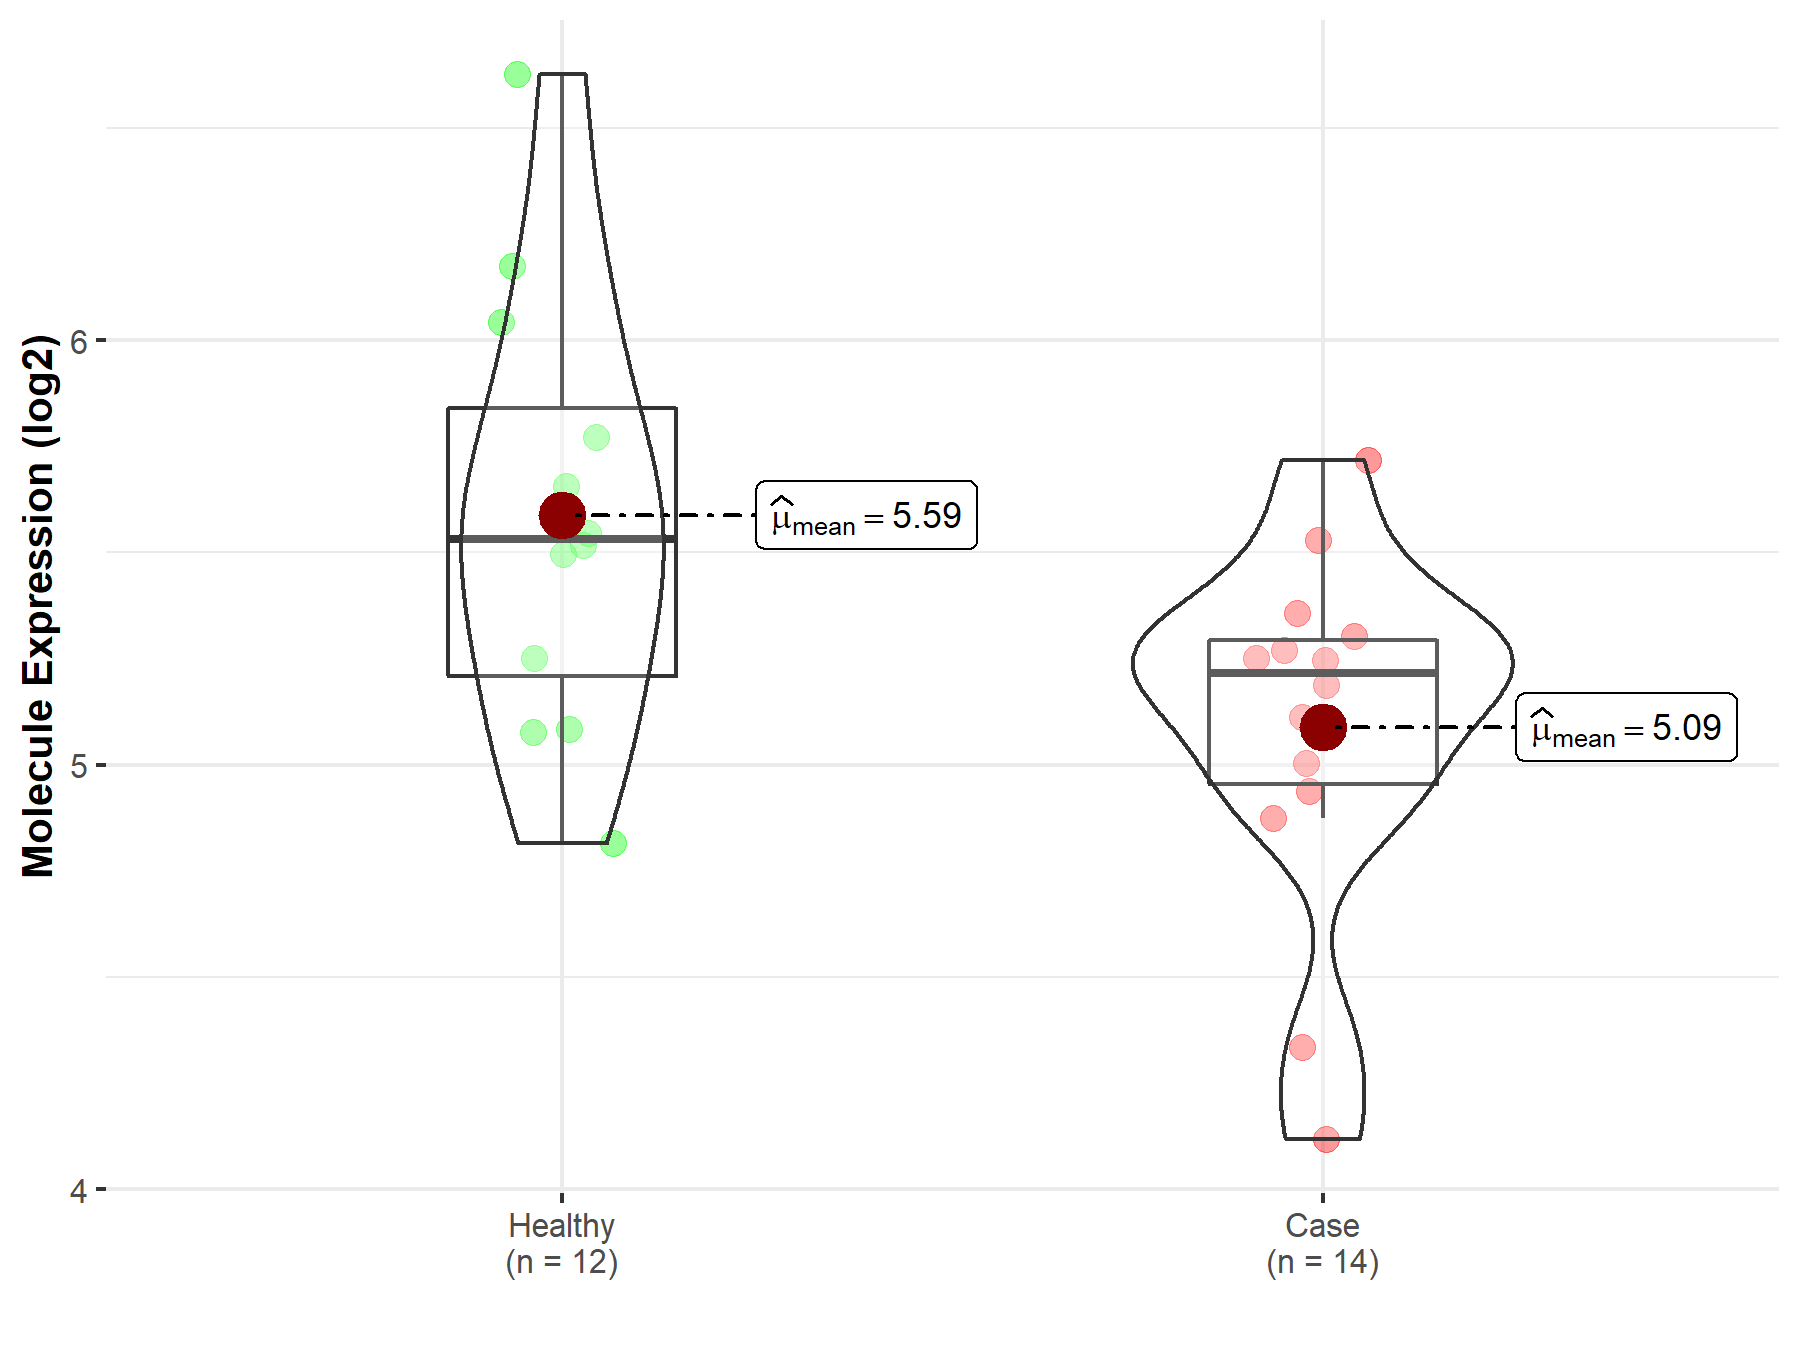
|
Click to View the Clearer Original Diagram |
ICD Disease Classification 05

| Differential expression of molecule in resistant diseases | ||
| The Studied Tissue | Whole blood | |
| The Specified Disease | Familial hypercholesterolemia | |
| The Expression Level of Disease Section Compare with the Healthy Individual Tissue | p-value: 2.28E-08; Fold-change: -3.66E-01; Z-score: -8.07E-01 | |
|
Molecule expression in the diseased tissue of patients
Molecule expression in the normal tissue of healthy individuals
|
||
| Disease-specific Molecule Abundances |
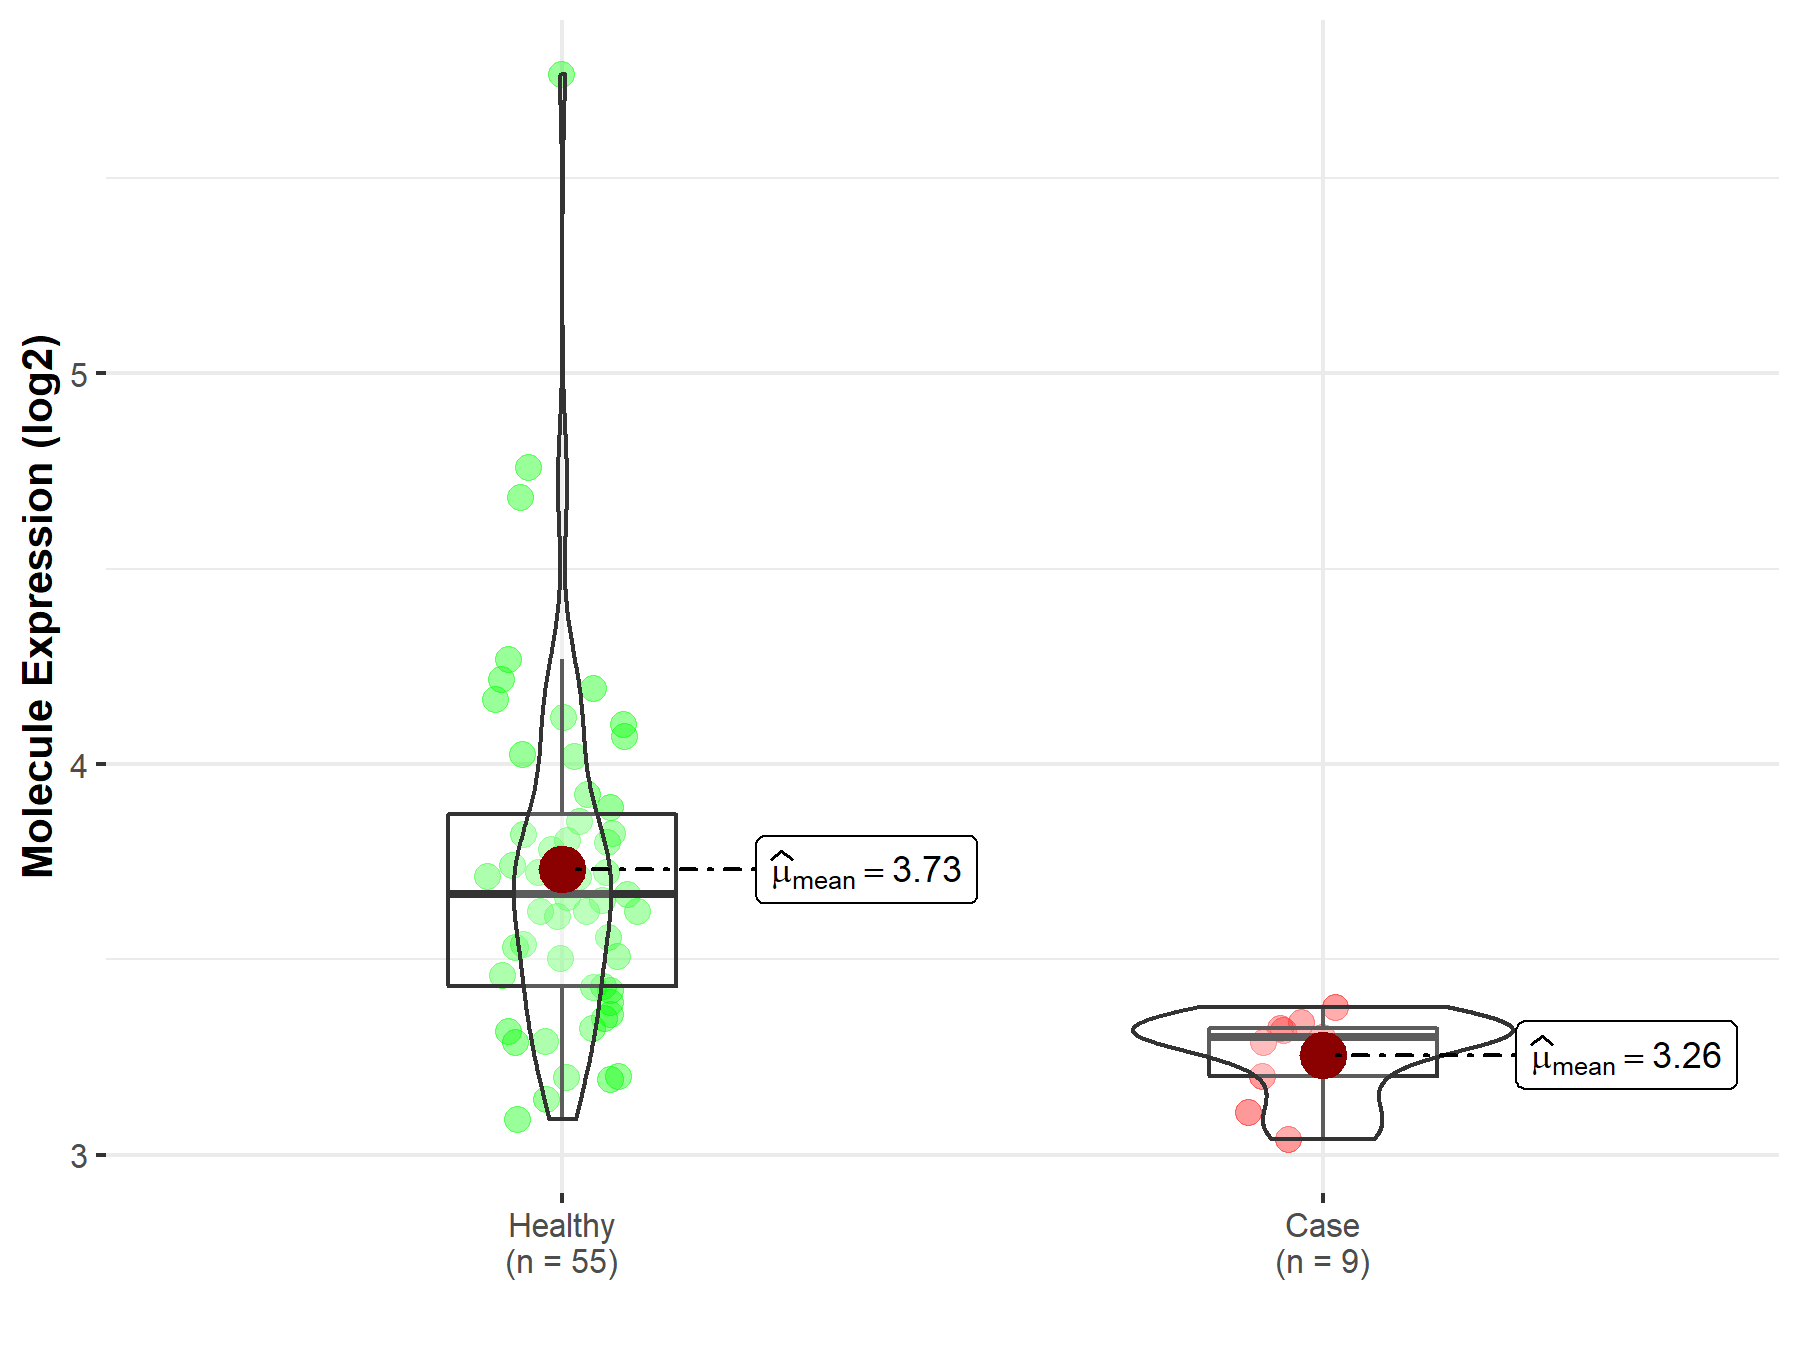
|
Click to View the Clearer Original Diagram |
ICD Disease Classification 08

| Differential expression of molecule in resistant diseases | ||
| The Studied Tissue | Plasmacytoid dendritic cells | |
| The Specified Disease | Multiple sclerosis | |
| The Expression Level of Disease Section Compare with the Healthy Individual Tissue | p-value: 9.93E-01; Fold-change: -1.09E-01; Z-score: -5.77E-01 | |
|
Molecule expression in the diseased tissue of patients
Molecule expression in the normal tissue of healthy individuals
|
||
| Disease-specific Molecule Abundances |

|
Click to View the Clearer Original Diagram |
| The Studied Tissue | Spinal cord | |
| The Specified Disease | Multiple sclerosis | |
| The Expression Level of Disease Section Compare with the Adjacent Tissue | p-value: 9.64E-01; Fold-change: 1.69E-02; Z-score: 1.22E-02 | |
|
Molecule expression in the normal tissue adjacent to the diseased tissue of patients
Molecule expression in the diseased tissue of patients
|
||
| Disease-specific Molecule Abundances |
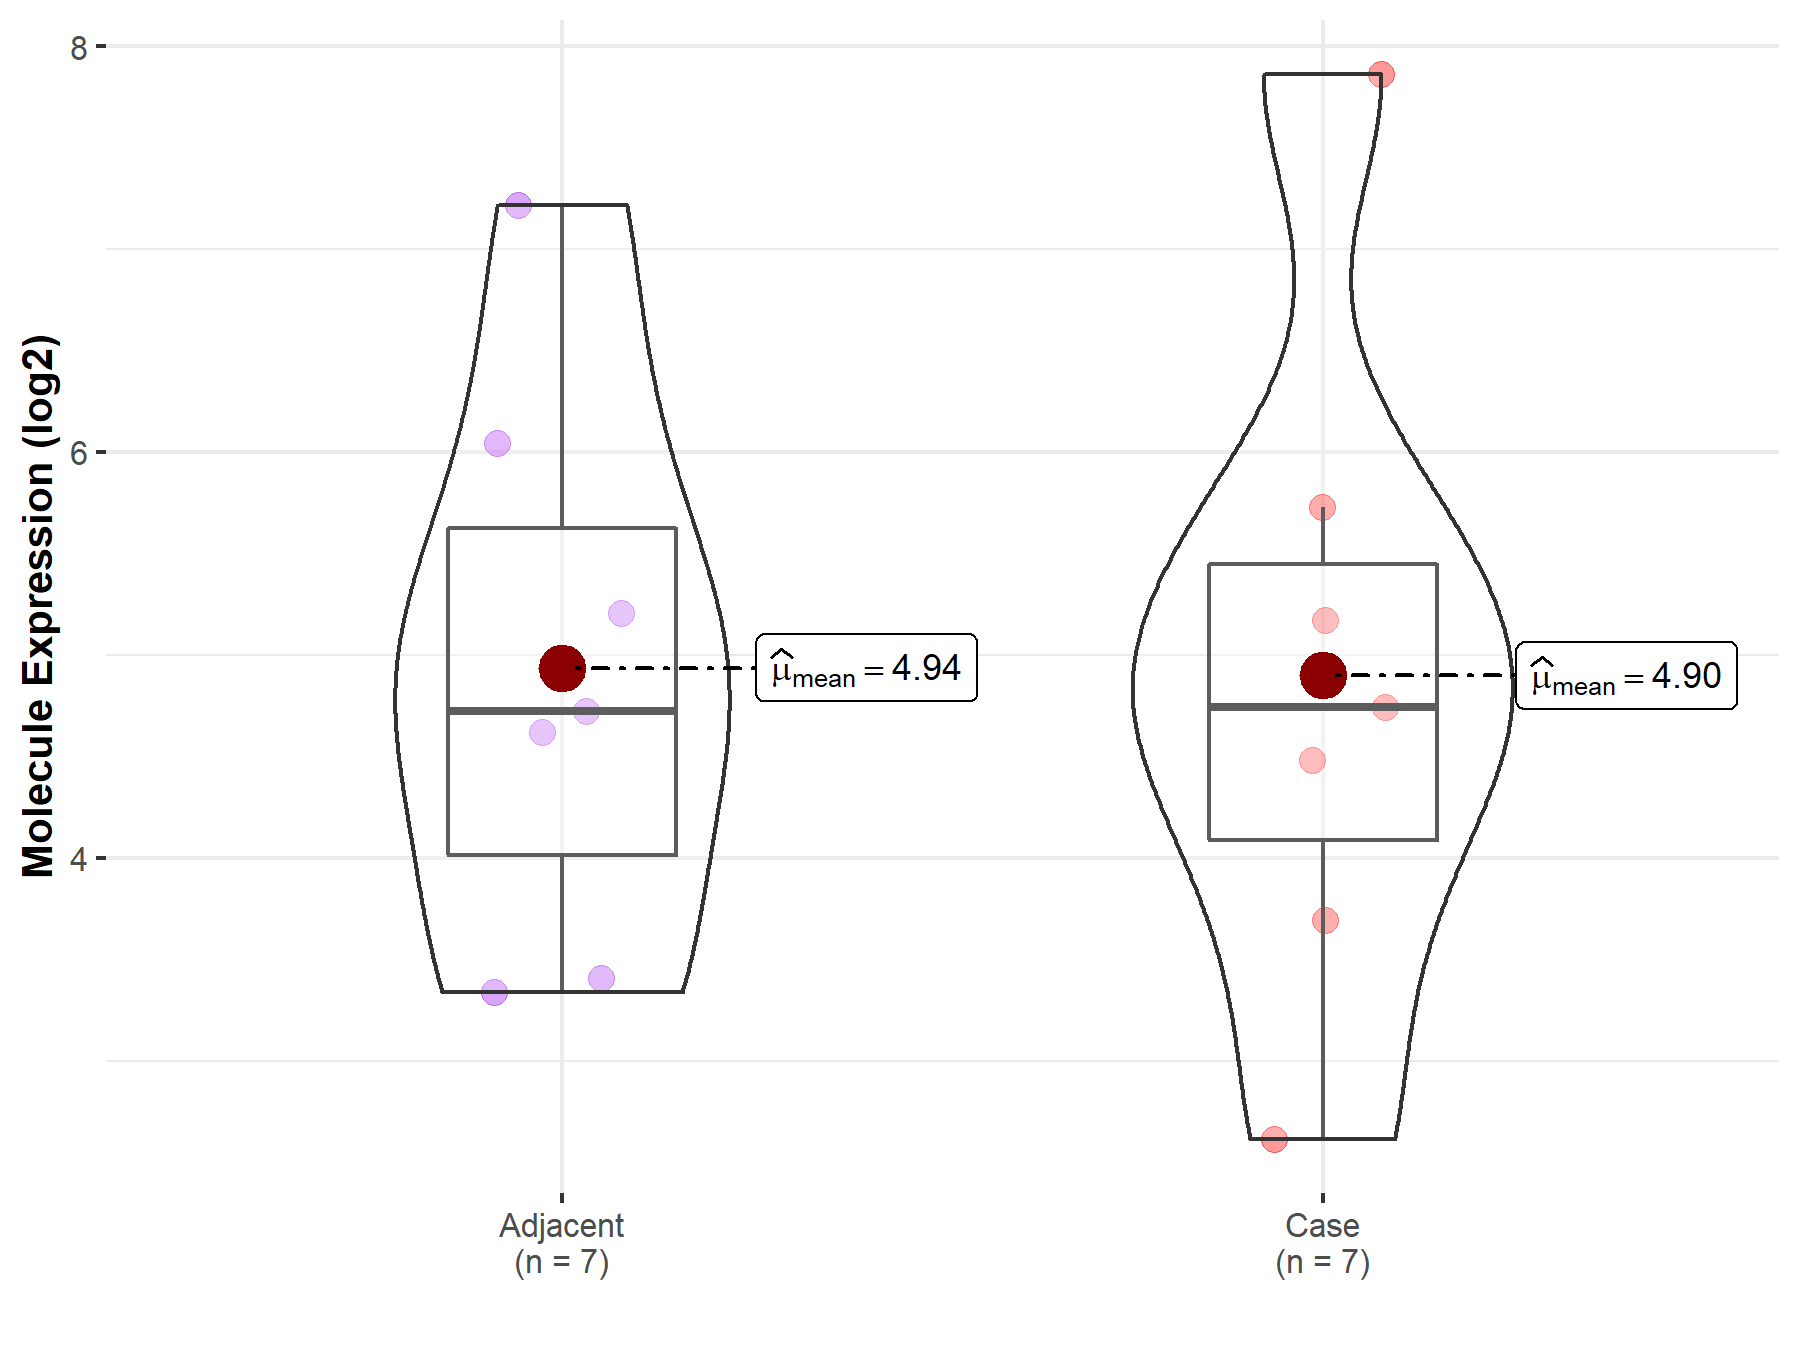
|
Click to View the Clearer Original Diagram |
ICD Disease Classification 13

| Differential expression of molecule in resistant diseases | ||
| The Studied Tissue | Colon mucosa | |
| The Specified Disease | Ulcerative colitis | |
| The Expression Level of Disease Section Compare with the Adjacent Tissue | p-value: 4.91E-02; Fold-change: -2.00E+00; Z-score: -1.13E+00 | |
|
Molecule expression in the normal tissue adjacent to the diseased tissue of patients
Molecule expression in the diseased tissue of patients
|
||
| Disease-specific Molecule Abundances |
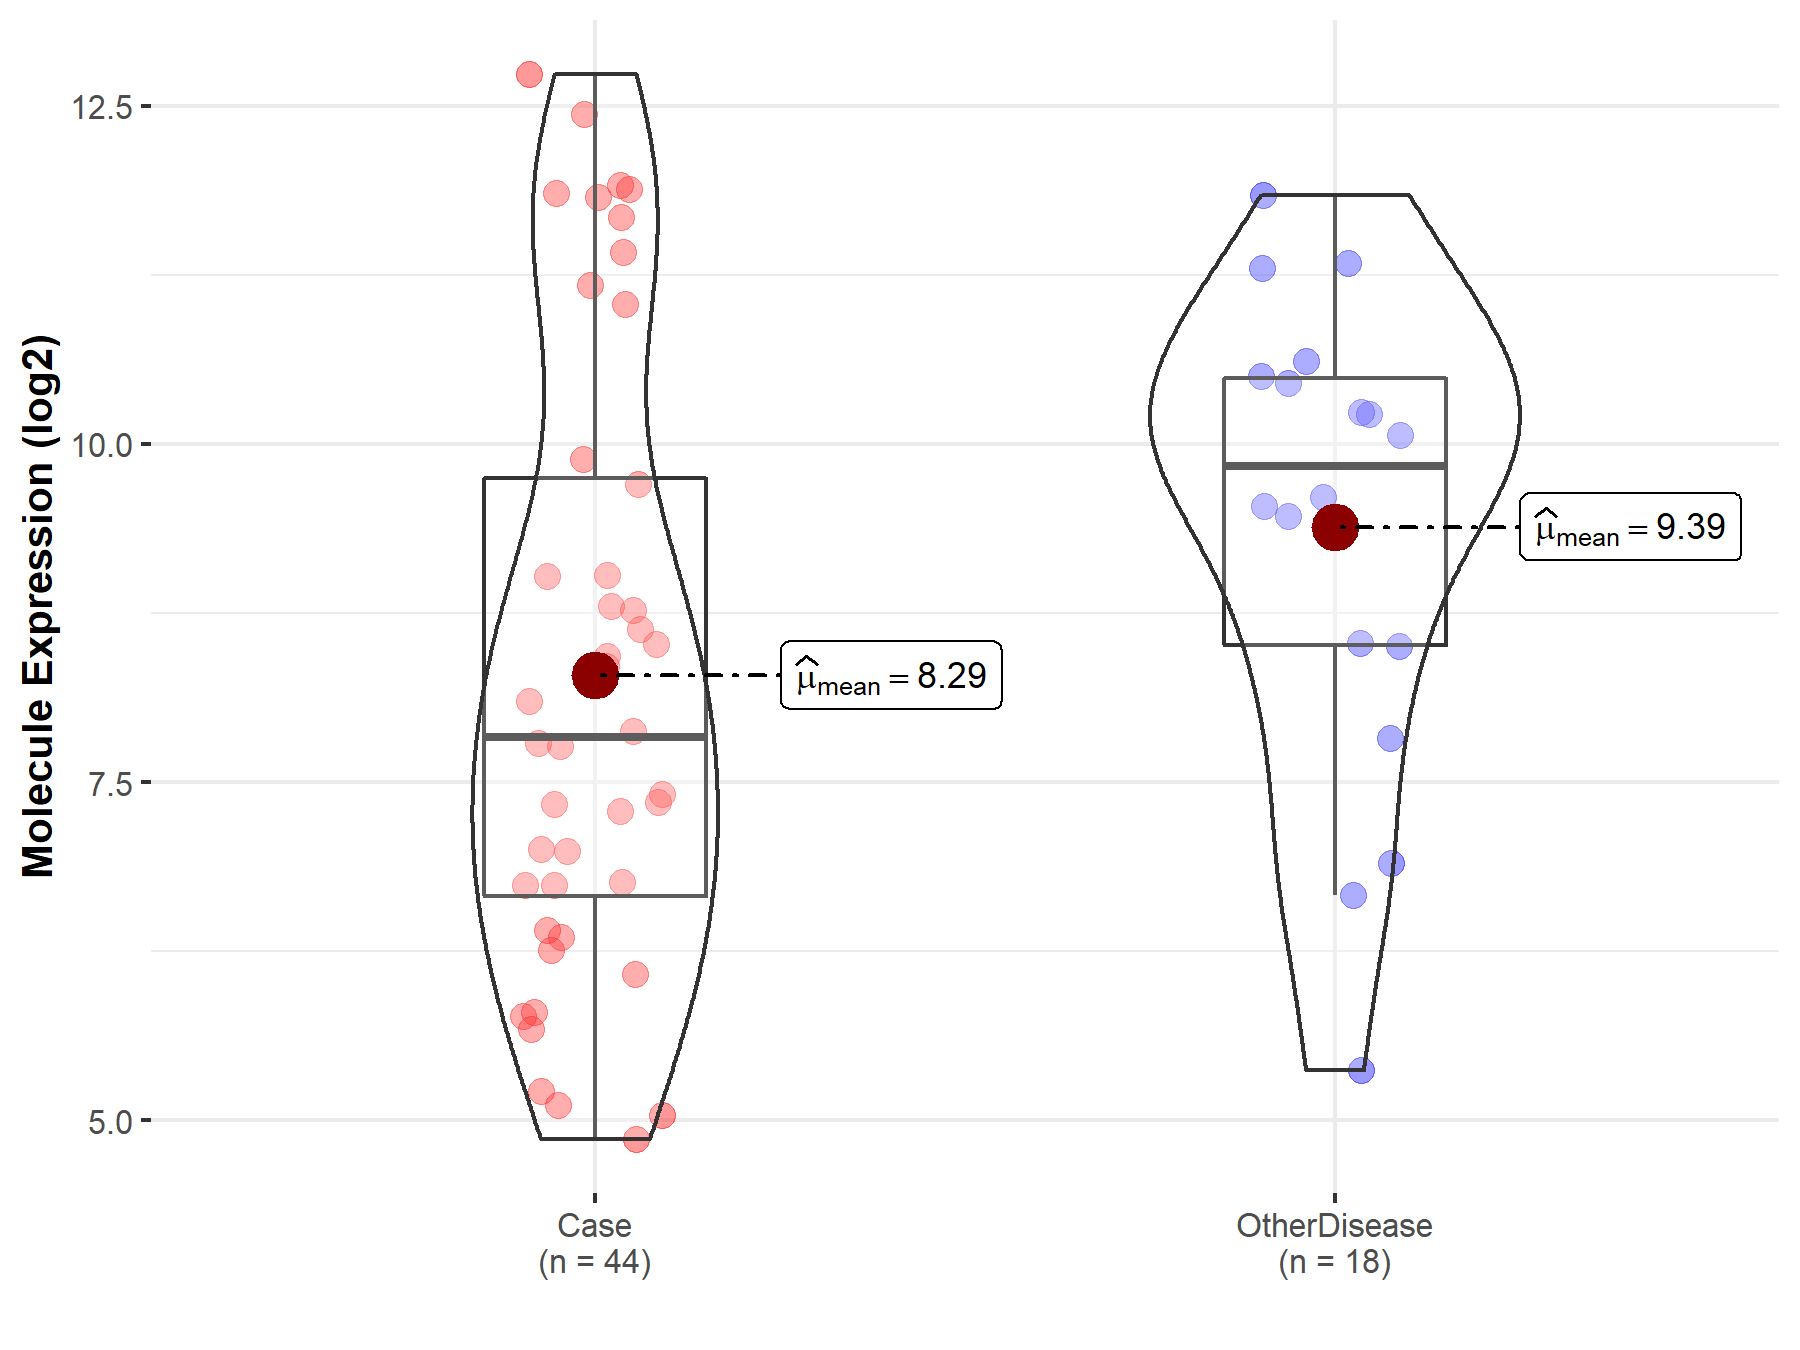
|
Click to View the Clearer Original Diagram |
ICD Disease Classification 15

| Differential expression of molecule in resistant diseases | ||
| The Studied Tissue | Peripheral blood | |
| The Specified Disease | Rheumatoid arthritis | |
| The Expression Level of Disease Section Compare with the Healthy Individual Tissue | p-value: 9.69E-07; Fold-change: 1.39E-01; Z-score: 3.45E-01 | |
|
Molecule expression in the diseased tissue of patients
Molecule expression in the normal tissue of healthy individuals
|
||
| Disease-specific Molecule Abundances |
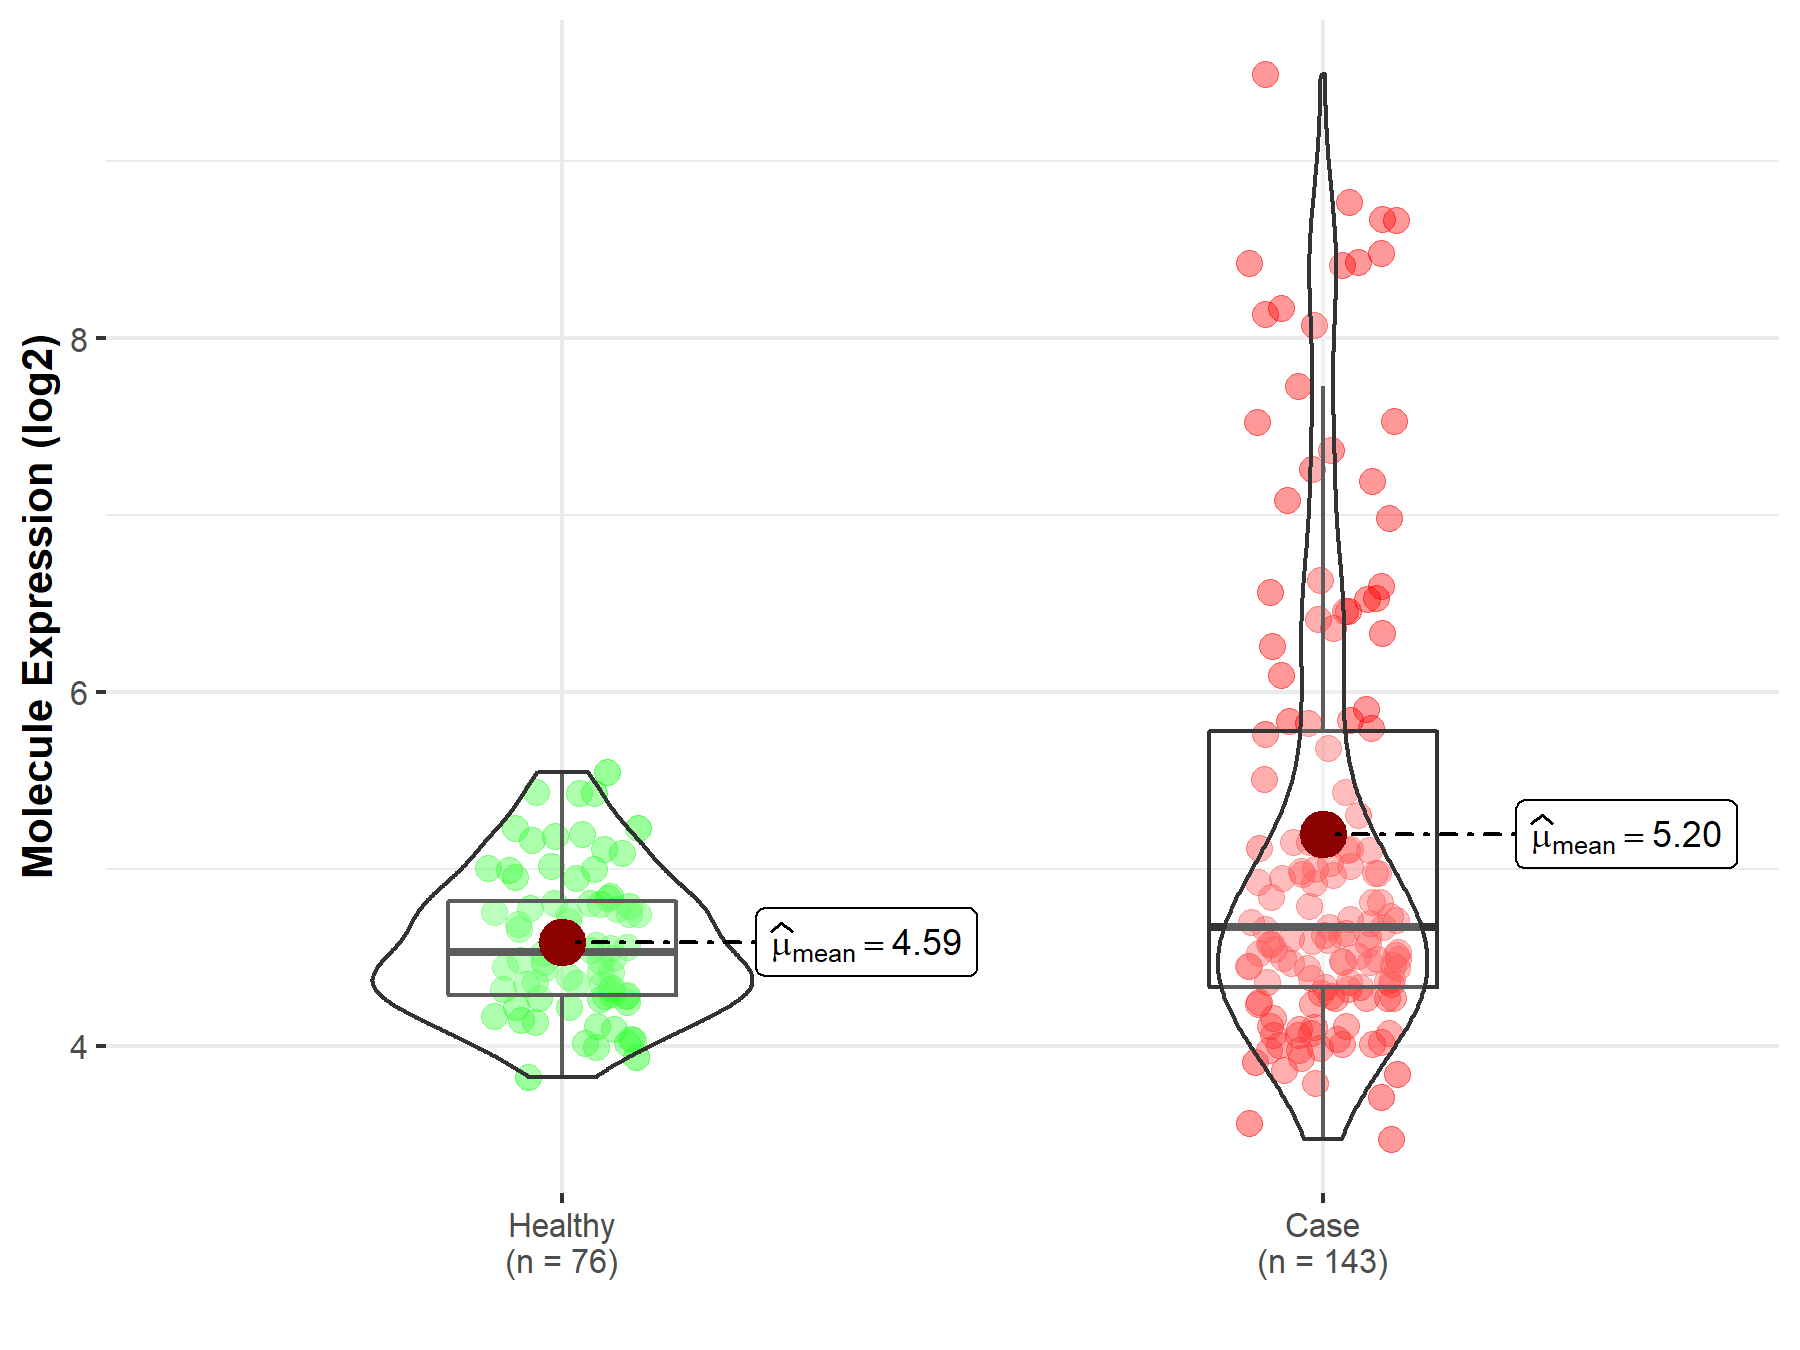
|
Click to View the Clearer Original Diagram |
| The Studied Tissue | Synovial tissue | |
| The Specified Disease | Rheumatoid arthritis | |
| The Expression Level of Disease Section Compare with the Healthy Individual Tissue | p-value: 4.63E-01; Fold-change: -1.31E-01; Z-score: -2.30E-01 | |
|
Molecule expression in the diseased tissue of patients
Molecule expression in the normal tissue of healthy individuals
|
||
| Disease-specific Molecule Abundances |
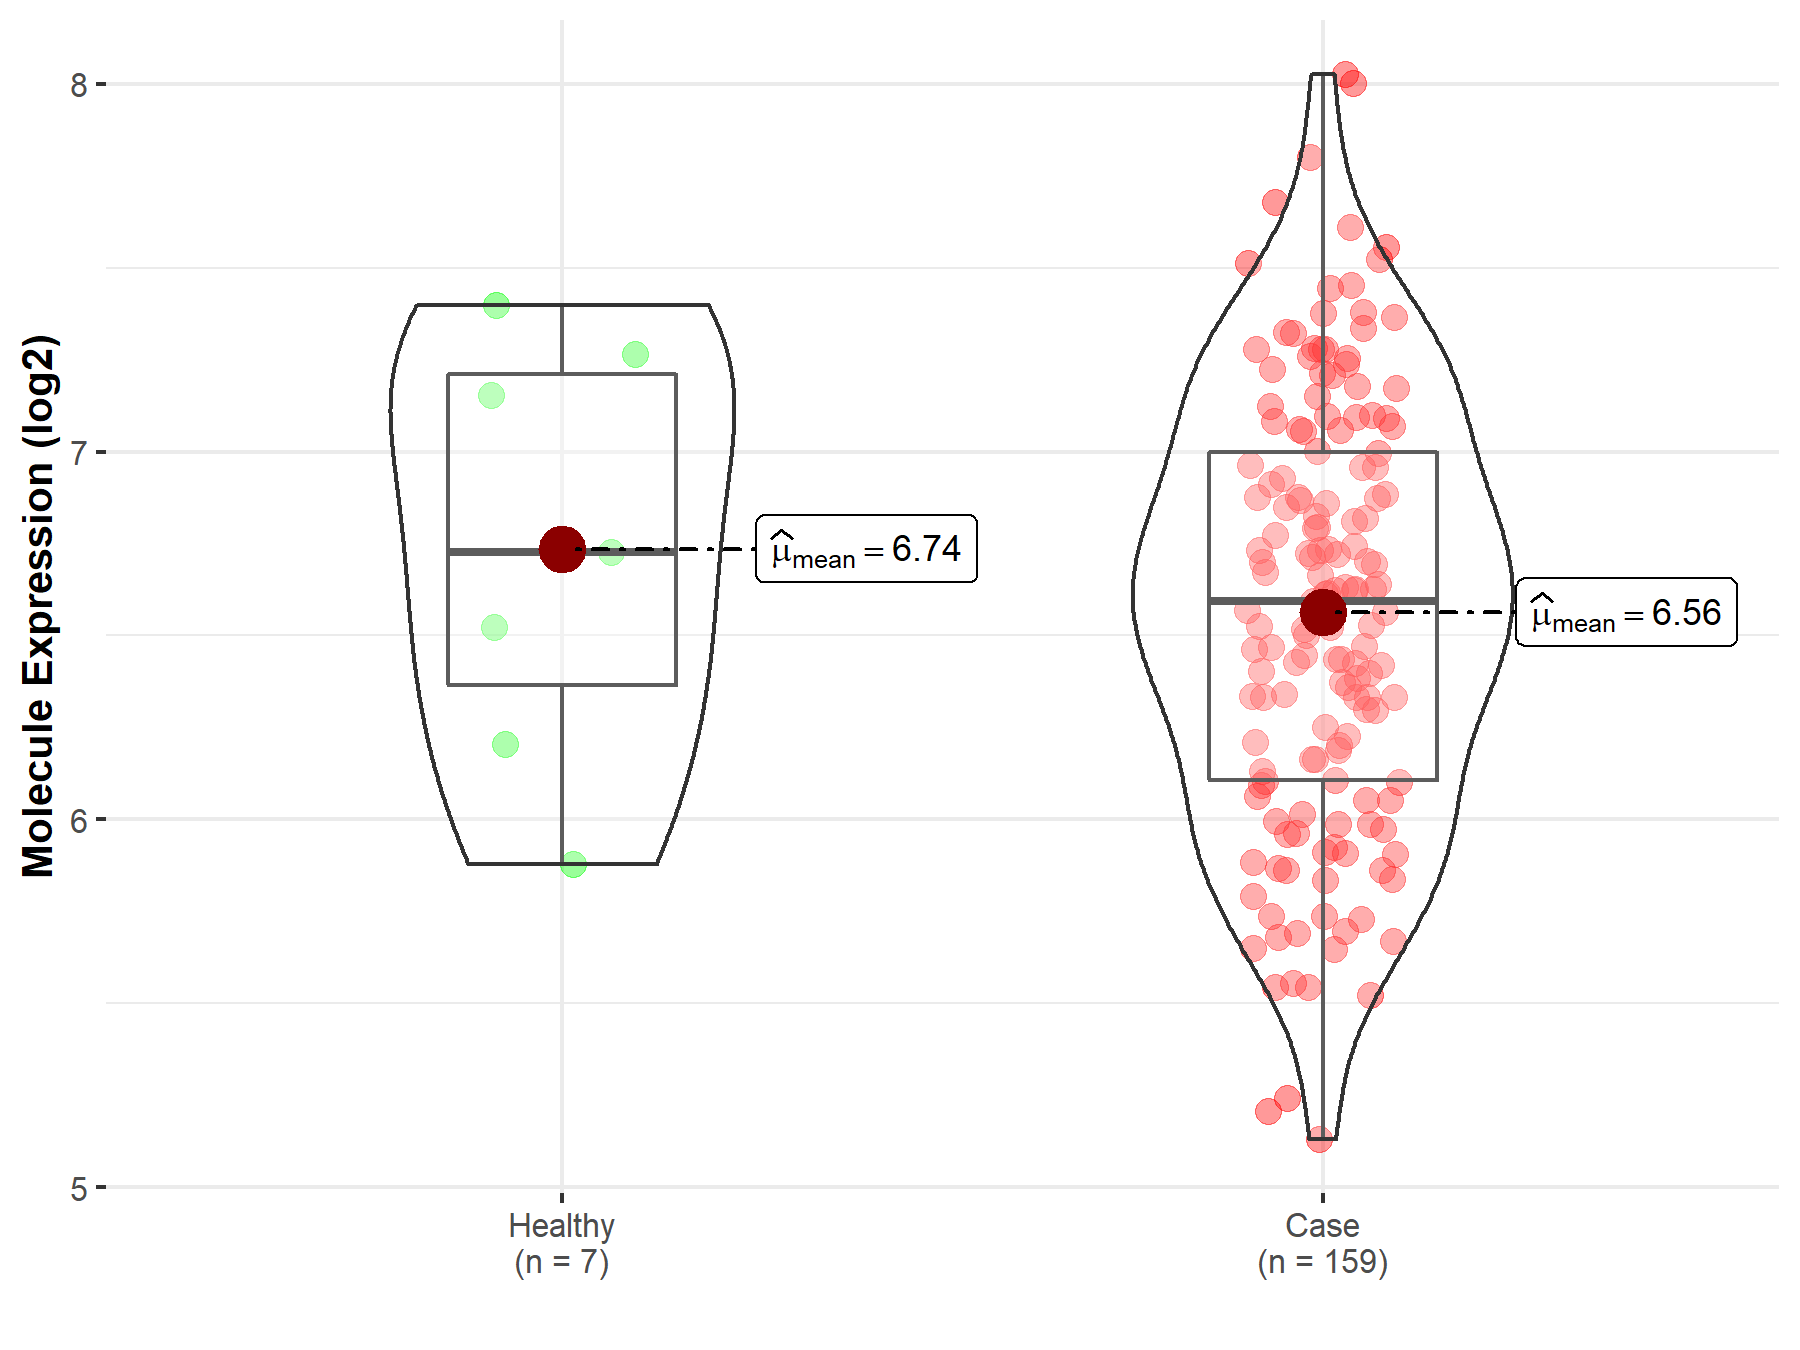
|
Click to View the Clearer Original Diagram |
Tissue-specific Molecule Abundances in Healthy Individuals

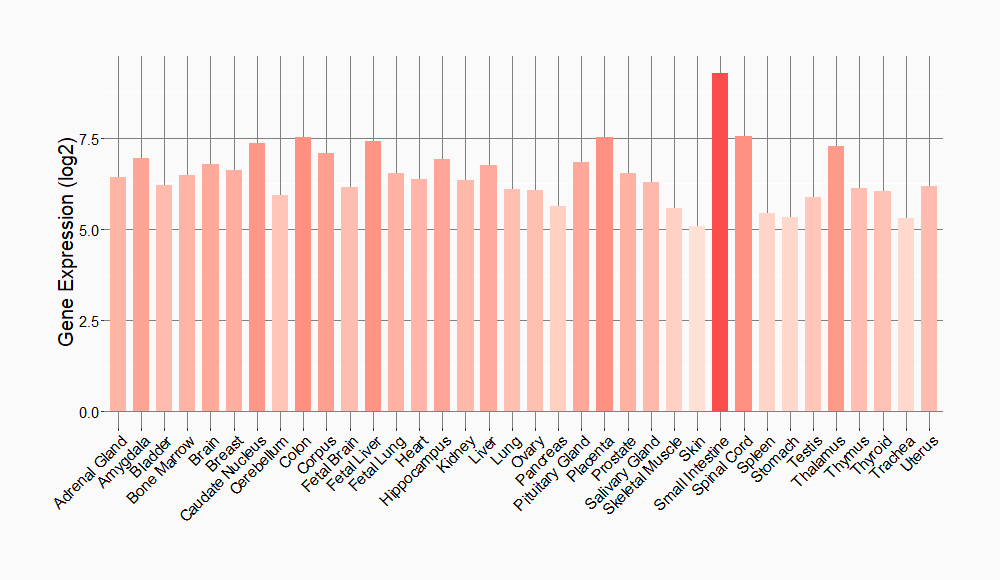
|
||
References
If you find any error in data or bug in web service, please kindly report it to Dr. Sun and Dr. Yu.
