Molecule Information
General Information of the Molecule (ID: Mol01231)
| Name |
Maternally expressed 3 (MEG3)
,Homo sapiens
|
||||
|---|---|---|---|---|---|
| Synonyms |
MEG3
Click to Show/Hide
|
||||
| Molecule Type |
LncRNA
|
||||
| Gene Name |
CUDR, LINC00178, UCAT1, onco-lncRNA-36
|
||||
| Gene ID | |||||
| Location |
chr14:100779410-100861031[+]
|
||||
| Ensembl ID | |||||
| HGNC ID | |||||
| Click to Show/Hide the Complete Species Lineage | |||||
Type(s) of Resistant Mechanism of This Molecule
Drug Resistance Data Categorized by Drug
Approved Drug(s)
7 drug(s) in total
| Drug Resistance Data Categorized by Their Corresponding Mechanisms | ||||
|
|
||||
| Disease Class: Lung cancer [ICD-11: 2C25.5] | [1] | |||
| Resistant Disease | Lung cancer [ICD-11: 2C25.5] | |||
| Resistant Drug | Cisplatin | |||
| Molecule Alteration | Expression | Down-regulation |
||
| Differential expression of the molecule in resistant disease | ||||
| Classification of Disease | Lung cancer [ICD-11: 2C25] | |||
| The Specified Disease | Lung adenocarcinoma | |||
| The Studied Tissue | Lung | |||
| The Expression Level of Disease Section Compare with the Healthy Individual Tissue | p-value: 1.94E-07 Fold-change: -1.26E+00 Z-score: -5.25E+00 |
|||
| Experimental Note | Identified from the Human Clinical Data | |||
| Cell Pathway Regulation | Cell apoptosis | Activation | hsa04210 | |
| Cell proliferation | Inhibition | hsa05200 | ||
| Wnt/Beta-catenin signaling pathway | Inhibition | hsa04310 | ||
| In Vitro Model | A549 cells | Lung | Homo sapiens (Human) | CVCL_0023 |
| Experiment for Molecule Alteration |
qPCR | |||
| Experiment for Drug Resistance |
MTT assay; Flow cytometry assay | |||
| Mechanism Description | Down-regulation of Meg3 enhances cisplatin resistance of lung cancer cells through activation of the WNT/beta-catenin signaling pathway.The present study detected that the expression levels of Meg3 were significantly lower in cisplatin-resistant A549/DDP lung cancer cells, compared with those in parental A549 cells. The results of the present study also demonstrated that the Meg3-mediated chemosensitivity enhancement was associated with the induction of cell-cycle arrest and increased apoptosis, through regulation of p53, beta-catenin and survivin, which is a target gene of the WNT/beta-catenin signaling pathway. | |||
| Drug Sensitivity Data Categorized by Their Corresponding Mechanisms | ||||
|
|
||||
| Disease Class: Non-small cell lung cancer [ICD-11: 2C25.Y] | [5] | |||
| Sensitive Disease | Non-small cell lung cancer [ICD-11: 2C25.Y] | |||
| Sensitive Drug | Cisplatin | |||
| Molecule Alteration | Expression | Up-regulation |
||
| Experimental Note | Identified from the Human Clinical Data | |||
| Cell Pathway Regulation | Cell apoptosis | Activation | hsa04210 | |
| Cell proliferation | Inhibition | hsa05200 | ||
| In Vitro Model | A549 cells | Lung | Homo sapiens (Human) | CVCL_0023 |
| H1299 cells | Lung | Homo sapiens (Human) | CVCL_0060 | |
| In Vivo Model | Nude mouse xenograft model | Mus musculus | ||
| Experiment for Molecule Alteration |
qRT-PCR | |||
| Experiment for Drug Resistance |
MTT assay; Flow cytometry assay; Caspase-3 activity analysis | |||
| Mechanism Description | LncRNA MEG3 enhances cisplatin sensitivity in non-small cell lung cancer by regulating miR21-5p/SOX7 axis. miR21-5p significantly abolished the effects of MEG3 on DDP resistance via modulating cell proliferation and apoptosis. SOX7 was identified as a direct target of miR21-5p and MEG3 positively regulated SOX7 expression by suppressing miR21-5p. | |||
| Disease Class: Glioma [ICD-11: 2A00.1] | [6] | |||
| Sensitive Disease | Glioma [ICD-11: 2A00.1] | |||
| Sensitive Drug | Cisplatin | |||
| Molecule Alteration | Expression | Up-regulation |
||
| Experimental Note | Revealed Based on the Cell Line Data | |||
| Cell Pathway Regulation | Cell autophagy | Inhibition | hsa04140 | |
| In Vitro Model | U87 cells | Brain | Homo sapiens (Human) | CVCL_0022 |
| Experiment for Molecule Alteration |
RT-qPCR | |||
| Experiment for Drug Resistance |
MTT assay | |||
| Mechanism Description | Long non coding RNA MEG3 contributes to cisplatin induced apoptosis via inhibition of autophagy in human glioma cells. | |||
| Disease Class: Lung cancer [ICD-11: 2C25.5] | [1] | |||
| Sensitive Disease | Lung cancer [ICD-11: 2C25.5] | |||
| Sensitive Drug | Cisplatin | |||
| Molecule Alteration | Expression | Up-regulation |
||
| Experimental Note | Identified from the Human Clinical Data | |||
| Cell Pathway Regulation | Cell apoptosis | Activation | hsa04210 | |
| Cell proliferation | Inhibition | hsa05200 | ||
| Wnt/Beta-catenin signaling pathway | Inhibition | hsa04310 | ||
| In Vitro Model | A549 cells | Lung | Homo sapiens (Human) | CVCL_0023 |
| Experiment for Molecule Alteration |
qPCR | |||
| Experiment for Drug Resistance |
MTT assay; Flow cytometry assay | |||
| Mechanism Description | Down-regulation of Meg3 enhances cisplatin resistance of lung cancer cells through activation of the WNT/beta-catenin signaling pathway.The present study detected that the expression levels of Meg3 were significantly lower in cisplatin-resistant A549/DDP lung cancer cells, compared with those in parental A549 cells. The results of the present study also demonstrated that the Meg3-mediated chemosensitivity enhancement was associated with the induction of cell-cycle arrest and increased apoptosis, through regulation of p53, beta-catenin and survivin, which is a target gene of the WNT/beta-catenin signaling pathway. | |||
|
|
||||
| Disease Class: Peripheral T-cell lymphoma [ICD-11: 2A90.0] | [7] | |||
| Sensitive Disease | Peripheral T-cell lymphoma [ICD-11: 2A90.0] | |||
| Sensitive Drug | Cisplatin | |||
| Molecule Alteration | Expression | Up-regulation |
||
| Experimental Note | Revealed Based on the Cell Line Data | |||
| Cell Pathway Regulation | Cell invasion | Inhibition | hsa05200 | |
| Cell migration | Inhibition | hsa04670 | ||
| Cell proliferation | Inhibition | hsa05200 | ||
| PI3K/mTOR signaling pathway | Inhibition | hsa04151 | ||
| In Vitro Model | Jurkat cells | Pleural effusion | Homo sapiens (Human) | CVCL_0065 |
| SUP-T1 cells | Pleural effusion | Homo sapiens (Human) | CVCL_1714 | |
| Experiment for Molecule Alteration |
qRT-PCR | |||
| Experiment for Drug Resistance |
CCK8 assay; Colony formation assays | |||
| Mechanism Description | MEG3 promotes the drug sensitivity of T-LBL to chemotherapeutic agents by affecting the PI3k/mTOR pathway. | |||
| Disease Class: Ovarian cancer [ICD-11: 2C73.0] | [8] | |||
| Sensitive Disease | Ovarian cancer [ICD-11: 2C73.0] | |||
| Sensitive Drug | Cisplatin | |||
| Molecule Alteration | Expression | Up-regulation |
||
| Experimental Note | Revealed Based on the Cell Line Data | |||
| In Vitro Model | SkOV3 cells | Ovary | Homo sapiens (Human) | CVCL_0532 |
| OVCAR3 cells | Ovary | Homo sapiens (Human) | CVCL_0465 | |
| Experiment for Molecule Alteration |
qRT-PCR | |||
| Experiment for Drug Resistance |
CCK8 assay; Flow cytometric analysis | |||
| Mechanism Description | MEG3 upregulation can decrease EVs mediated transfer of miR214 in ovarian cancer cells, thereby reducing drug resistance. | |||
| Drug Resistance Data Categorized by Their Corresponding Mechanisms | ||||
|
|
||||
| Disease Class: Pancreatic cancer [ICD-11: 2C10.3] | [2] | |||
| Resistant Disease | Pancreatic cancer [ICD-11: 2C10.3] | |||
| Resistant Drug | Gemcitabine | |||
| Molecule Alteration | Expression | Down-regulation |
||
| Differential expression of the molecule in resistant disease | ||||
| Classification of Disease | Pancreatic cancer [ICD-11: 2C10] | |||
| The Specified Disease | Pancreatic adenocarcinoma | |||
| The Studied Tissue | Pancreas | |||
| The Expression Level of Disease Section Compare with the Healthy Individual Tissue | p-value: 1.44E-13 Fold-change: -2.89E+00 Z-score: -7.99E+00 |
|||
| Experimental Note | Identified from the Human Clinical Data | |||
| Cell Pathway Regulation | Cell apoptosis | Inhibition | hsa04210 | |
| Cell migration | Activation | hsa04670 | ||
| Cell proliferation | Activation | hsa05200 | ||
| In Vitro Model | BxPC-3 cells | Pancreas | Homo sapiens (Human) | CVCL_0186 |
| MIA PaCa-2 cells | Pancreas | Homo sapiens (Human) | CVCL_0428 | |
| PANC-1 cells | Pancreas | Homo sapiens (Human) | CVCL_0480 | |
| Capan-1 cells | Pancreas | Homo sapiens (Human) | CVCL_0237 | |
| AsPC-1 cells | Pancreas | Homo sapiens (Human) | CVCL_0152 | |
| SW1990 cells | Pancreas | Homo sapiens (Human) | CVCL_1723 | |
| COLO357 cells | Pancreas | Homo sapiens (Human) | CVCL_0221 | |
| T3M4 cells | Pancreas | Homo sapiens (Human) | CVCL_4056 | |
| HTERT-HPNE cells | Pancreas | Homo sapiens (Human) | CVCL_C466 | |
| Experiment for Molecule Alteration |
RT-qPCR | |||
| Experiment for Drug Resistance |
CCK8 assay; Boyden chamber assay; Sphere formation assay; Flow cytometric analysis | |||
| Mechanism Description | Decreased expression of MEG3 could promote PC cell migration and invasion, as well as chemoresistance by regulating the EMT process and CSC properties. | |||
| Drug Resistance Data Categorized by Their Corresponding Mechanisms | ||||
|
|
||||
| Disease Class: Hepatocellular carcinoma [ICD-11: 2C12.2] | [4] | |||
| Resistant Disease | Hepatocellular carcinoma [ICD-11: 2C12.2] | |||
| Resistant Drug | Adenosine | |||
| Molecule Alteration | Up-regulation | Interaction |
||
| Experimental Note | Revealed Based on the Cell Line Data | |||
| Cell Pathway Regulation | PI3K/AKT/mTOR signaling pathway | Activation | hsa04151 | |
| In Vitro Model | HepG2 cells | Liver | Homo sapiens (Human) | CVCL_0027 |
| 293T cells | Breast | Homo sapiens (Human) | CVCL_0063 | |
| Experiment for Molecule Alteration |
Overexpression assay; Knockdown assay | |||
| Experiment for Drug Resistance |
CCK8 assay | |||
| Mechanism Description | LncRNA MEG3 contributes to adenosine-induced cytotoxicity in hepatoma HepG2 cells by downregulated ILF3 and autophagy inhibition via regulation PI3K-AKT-mTOR and beclin-1 signaling pathway. | |||
| Drug Sensitivity Data Categorized by Their Corresponding Mechanisms | ||||
|
|
||||
| Disease Class: Peripheral T-cell lymphoma [ICD-11: 2A90.0] | [7] | |||
| Sensitive Disease | Peripheral T-cell lymphoma [ICD-11: 2A90.0] | |||
| Sensitive Drug | Cyclophosphamide | |||
| Molecule Alteration | Expression | Up-regulation |
||
| Experimental Note | Revealed Based on the Cell Line Data | |||
| Cell Pathway Regulation | Cell invasion | Inhibition | hsa05200 | |
| Cell migration | Inhibition | hsa04670 | ||
| Cell proliferation | Inhibition | hsa05200 | ||
| PI3K/mTOR signaling pathway | Inhibition | hsa04151 | ||
| In Vitro Model | Jurkat cells | Pleural effusion | Homo sapiens (Human) | CVCL_0065 |
| SUP-T1 cells | Pleural effusion | Homo sapiens (Human) | CVCL_1714 | |
| Experiment for Molecule Alteration |
qRT-PCR | |||
| Experiment for Drug Resistance |
CCK8 assay; Colony formation assays | |||
| Mechanism Description | MEG3 promotes the drug sensitivity of T-LBL to chemotherapeutic agents by affecting the PI3k/mTOR pathway. | |||
| Drug Sensitivity Data Categorized by Their Corresponding Mechanisms | ||||
|
|
||||
| Disease Class: Chronic myeloid leukemia [ICD-11: 2A20.0] | [9] | |||
| Sensitive Disease | Chronic myeloid leukemia [ICD-11: 2A20.0] | |||
| Sensitive Drug | Imatinib | |||
| Molecule Alteration | Expression | Up-regulation |
||
| Experimental Note | Identified from the Human Clinical Data | |||
| Cell Pathway Regulation | Cell apoptosis | Activation | hsa04210 | |
| Cell proliferation | Inhibition | hsa05200 | ||
| In Vitro Model | K562 cells | Blood | Homo sapiens (Human) | CVCL_0004 |
| Experiment for Molecule Alteration |
RT-qPCR | |||
| Experiment for Drug Resistance |
CCK8 assay; Annexin V-FITC/PI Apoptosis Detection assay | |||
| Mechanism Description | LncRNA MEG3 Regulates Imatinib Resistance in Chronic Myeloid Leukemia via Suppressing microRNA-21. MEG3 and miR21 were negatively correlated in CML patients, miR21 mimics reversed the phenotype of MEG3-overexpression in imatinib-resistant k562 cells. | |||
| Drug Resistance Data Categorized by Their Corresponding Mechanisms | ||||
|
|
||||
| Disease Class: Colorectal cancer [ICD-11: 2B91.1] | [10] | |||
| Resistant Disease | Colorectal cancer [ICD-11: 2B91.1] | |||
| Resistant Drug | Oxaliplatin | |||
| Molecule Alteration | Expression | Down-regulation |
||
| Experimental Note | Identified from the Human Clinical Data | |||
| Cell Pathway Regulation | Cell apoptosis | Inhibition | hsa04210 | |
| Cell viability | Activation | hsa05200 | ||
| In Vitro Model | HT29 Cells | Colon | Homo sapiens (Human) | CVCL_A8EZ |
| SW480 cells | Colon | Homo sapiens (Human) | CVCL_0546 | |
| HCT116 cells | Colon | Homo sapiens (Human) | CVCL_0291 | |
| Experiment for Molecule Alteration |
qRT-PCR | |||
| Experiment for Drug Resistance |
MTT assay; Flow cytometry assay | |||
| Mechanism Description | Overexpression of MEG3 improved oxaliplatin sensitivity of HT29/OXA and HCT116/OXA cells via suppressing miR-141 expression and upregulating PDCD4. | |||
| Drug Sensitivity Data Categorized by Their Corresponding Mechanisms | ||||
|
|
||||
| Disease Class: Colorectal cancer [ICD-11: 2B91.1] | [10] | |||
| Sensitive Disease | Colorectal cancer [ICD-11: 2B91.1] | |||
| Sensitive Drug | Oxaliplatin | |||
| Molecule Alteration | Expression | Up-regulation |
||
| Experimental Note | Identified from the Human Clinical Data | |||
| Cell Pathway Regulation | Cell apoptosis | Activation | hsa04210 | |
| Cell viability | Inhibition | hsa05200 | ||
| In Vitro Model | HT29 Cells | Colon | Homo sapiens (Human) | CVCL_A8EZ |
| SW480 cells | Colon | Homo sapiens (Human) | CVCL_0546 | |
| HCT116 cells | Colon | Homo sapiens (Human) | CVCL_0291 | |
| Experiment for Molecule Alteration |
qRT-PCR | |||
| Experiment for Drug Resistance |
MTT assay; Flow cytometry assay | |||
| Mechanism Description | Overexpression of MEG3 improved oxaliplatin sensitivity of HT29/OXA and HCT116/OXA cells via suppressing miR-141 expression and upregulating PDCD4. | |||
| Drug Sensitivity Data Categorized by Their Corresponding Mechanisms | ||||
|
|
||||
| Disease Class: Lung cancer [ICD-11: 2C25.5] | [11] | |||
| Sensitive Disease | Lung cancer [ICD-11: 2C25.5] | |||
| Sensitive Drug | Paclitaxel | |||
| Molecule Alteration | Expression | Up-regulation |
||
| Experimental Note | Revealed Based on the Cell Line Data | |||
| Cell Pathway Regulation | Cell apoptosis | Activation | hsa04210 | |
| Cell viability | Inhibition | hsa05200 | ||
| MEG3-P53 signaling pathway | Activation | hsa04115 | ||
| In Vitro Model | A549 cells | Lung | Homo sapiens (Human) | CVCL_0023 |
| Experiment for Molecule Alteration |
qPCR | |||
| Experiment for Drug Resistance |
MTT assay; Flow cytometry assay | |||
| Mechanism Description | The downregulation of MEG3 attenuated PTX-induced cytotoxicity, whereas upregulation of MEG3 induced cell death and increased P53 expression. | |||
Investigative Drug(s)
7 drug(s) in total
| Drug Resistance Data Categorized by Their Corresponding Mechanisms | ||||
|
|
||||
| Disease Class: Thyroid carcinoma [ICD-11: 2D10.4] | [3] | |||
| Resistant Disease | Thyroid carcinoma [ICD-11: 2D10.4] | |||
| Resistant Drug | Iodine-131 | |||
| Molecule Alteration | Expression | Down-regulation |
||
| Differential expression of the molecule in resistant disease | ||||
| Classification of Disease | Thyroid cancer [ICD-11: 2D10] | |||
| The Specified Disease | Thyroid carcinoma | |||
| The Studied Tissue | Thyroid | |||
| The Expression Level of Disease Section Compare with the Healthy Individual Tissue | p-value: 9.68E-53 Fold-change: -4.29E+00 Z-score: -1.81E+01 |
|||
| Experimental Note | Revealed Based on the Cell Line Data | |||
| Cell Pathway Regulation | Cell apoptosis | Inhibition | hsa04210 | |
| Cell proliferation | Activation | hsa05200 | ||
| In Vitro Model | TPC-1 cells | Thyroid | Homo sapiens (Human) | CVCL_6298 |
| FTC-133 cells | Thyroid | Homo sapiens (Human) | CVCL_1219 | |
| Experiment for Molecule Alteration |
qPCR | |||
| Experiment for Drug Resistance |
CCK8 assay; Flow cytometry assay | |||
| Mechanism Description | MEG3 expression was decreased while miR-182 expression was increased in 131I-resistant TC cells. | |||
| Drug Resistance Data Categorized by Their Corresponding Mechanisms | ||||
|
|
||||
| Disease Class: Cholangiocarcinoma [ICD-11: 2C12.0] | [4] | |||
| Resistant Disease | Cholangiocarcinoma [ICD-11: 2C12.0] | |||
| Resistant Drug | 5-FU-CDDP | |||
| Molecule Alteration | Up-regulation | Interaction |
||
| Experimental Note | Identified from the Human Clinical Data | |||
| In Vitro Model | HepG2 cells | Liver | Homo sapiens (Human) | CVCL_0027 |
| HCC Huh7 cells | Liver | Homo sapiens (Human) | CVCL_0336 | |
| 7721 cells | N.A. | Homo sapiens (Human) | N.A. | |
| 7402 cells | Uterus | Homo sapiens (Human) | CVCL_5492 | |
| LO2 cells | Uterus | Homo sapiens (Human) | CVCL_6926 | |
| Experiment for Molecule Alteration |
Overexpression assay | |||
| Experiment for Drug Resistance |
CCK8 assay | |||
| Mechanism Description | MEG3 overexpression inhibited the proliferation of HCC cells, at least in part by affecting miR-664mediated regulation of ADH4. | |||
| Drug Resistance Data Categorized by Their Corresponding Mechanisms | ||||
|
|
||||
| Disease Class: Ovarian cancer [ICD-11: 2C73.0] | [4] | |||
| Resistant Disease | Ovarian cancer [ICD-11: 2C73.0] | |||
| Resistant Drug | Anisomycin | |||
| Molecule Alteration | Up-regulation | Interaction |
||
| Experimental Note | Identified from the Human Clinical Data | |||
| In Vitro Model | Primary human ovarian cancer stem cells | N.A. | Homo sapiens (Human) | N.A. |
| In Vivo Model | Female BALB/c nude mice xenograft model | Mus musculus | ||
| Experiment for Molecule Alteration |
Microarray assay; Luciferase assay; Overexpression assay | |||
| Experiment for Drug Resistance |
MTT assay | |||
| Mechanism Description | Anisomycin inhibited the activation downstream of the Notch1 pathway by attenuating the molecular sponge effect of the LncRNA Meg3/miR 421/PDGFRA axis, ultimately inhibiting angiogenesis, proliferation and invasion in ovarian cancer cells. | |||
| Drug Resistance Data Categorized by Their Corresponding Mechanisms | ||||
|
|
||||
| Disease Class: Rheumatoid arthritis [ICD-11: FA20.0] | [4] | |||
| Resistant Disease | Rheumatoid arthritis [ICD-11: FA20.0] | |||
| Resistant Drug | Lipopolysaccharide | |||
| Molecule Alteration | Down-regulation | Interaction |
||
| Experimental Note | Identified from the Human Clinical Data | |||
| Cell Pathway Regulation | AKT/mTOR signaling pathway | Regulation | N.A. | |
| In Vitro Model | Rat chondrocyte isolates | N.A. | N.A. | N.A. |
| In Vivo Model | Male SD rat model | Rattus norvegicus | ||
| Experiment for Molecule Alteration |
Overexpression assay | |||
| Experiment for Drug Resistance |
CCK8 assay | |||
| Mechanism Description | LncRNA MEG3 inhibits rheumatoid arthritis through miR-141 and inactivation of AKT/mTOR signalling pathway. | |||
| Disease Class: Sepsis [ICD-11: 1G40.0] | [4] | |||
| Resistant Disease | Sepsis [ICD-11: 1G40.0] | |||
| Resistant Drug | Lipopolysaccharide | |||
| Molecule Alteration | Up-regulation | Expression |
||
| Experimental Note | Identified from the Human Clinical Data | |||
| In Vitro Model | AC16 cells | Heart | Homo sapiens (Human) | CVCL_4U18 |
| Human primary renal mixed epithelial cells (ATCC? PCS-400-012?) | N.A. | Homo sapiens (Human) | N.A. | |
| Experiment for Molecule Alteration |
Overexpression assay; Knockdown assay | |||
| Experiment for Drug Resistance |
Flow cytometry assay assay | |||
| Mechanism Description | LncRNA MEG3 overexpression may be involved in sepsis, and the downregulation of LncRNA MEG3 may serve as a potential therapeutic target for sepsis. | |||
| Drug Resistance Data Categorized by Their Corresponding Mechanisms | ||||
|
|
||||
| Disease Class: Nonalcoholic fatty liver disease [ICD-11: DB92.0] | [4] | |||
| Resistant Disease | Nonalcoholic fatty liver disease [ICD-11: DB92.0] | |||
| Resistant Drug | Nonesterified | |||
| Molecule Alteration | Down-regulation | Expression |
||
| Experimental Note | Revealed Based on the Cell Line Data | |||
| In Vitro Model | HepG2 cells | Liver | Homo sapiens (Human) | CVCL_0027 |
| In Vivo Model | C57BL/6 mice model | Mus musculus | ||
| Experiment for Molecule Alteration |
Overexpression assay; Dual luciferase assay | |||
| Experiment for Drug Resistance |
MTT assay | |||
| Mechanism Description | LncRNA MEG3 functions as a ceRNA in regulating hepatic lipogenesis by competitively binding to miR-21 with LRP6. | |||
| Drug Resistance Data Categorized by Their Corresponding Mechanisms | ||||
|
|
||||
| Disease Class: Lung damage [ICD-11: RA00] | [4] | |||
| Resistant Disease | Lung damage [ICD-11: RA00] | |||
| Resistant Drug | Oxygen | |||
| Molecule Alteration | Down-regulation | Interaction |
||
| Experimental Note | Discovered Using In-vivo Testing Model | |||
| In Vitro Model | MLE-12 cells | Lung | Mus musculus (Mouse) | CVCL_3751 |
| In Vivo Model | MEG3 knockdown mice model | Mus musculus | ||
| Experiment for Molecule Alteration |
Knockdown assay; qRT-PCR; Western bloting analysis; Luciferase assay; ELISA assay | |||
| Experiment for Drug Resistance |
MTT assay; LDH assay; Flow cytometry assay; HE staining assay | |||
| Mechanism Description | Knockdown of MEG3 inhibits pyroptosis to alleviate hyperoxia lung injury by suppressing NLRP3 inflammasome and caspase-1 signaling via regulating miR-18a-TXNIP axis. | |||
| Drug Resistance Data Categorized by Their Corresponding Mechanisms | ||||
|
|
||||
| Disease Class: Oral squamous cell carcinoma [ICD-11: 2B6E.0] | [4] | |||
| Resistant Disease | Oral squamous cell carcinoma [ICD-11: 2B6E.0] | |||
| Resistant Drug | Succinate | |||
| Experimental Note | Identified from the Human Clinical Data | |||
| In Vitro Model | CAL-27 cells | Tongue | Homo sapiens (Human) | CVCL_1107 |
| OLP type I keratinocytes | N.A. | N.A. | N.A. | |
| Experiment for Drug Resistance |
Cell Titer-Glo assay; IC50 assay | |||
| Mechanism Description | The critical roles of succinate and MEG3 in the metabolic changes during malignant transformation from OLP to OSCC. | |||
Disease- and Tissue-specific Abundances of This Molecule
ICD Disease Classification 02

| Differential expression of molecule in resistant diseases | ||
| The Studied Tissue | Brain | |
| The Specified Disease | Brain lower grade glioma | |
| The Expression Level of Disease Section Compare with the Healthy Individual Tissue | p-value: 0.00E+00; Fold-change: 2.56E-01 | |
|
Molecule expression in the diseased tissue of patients
Molecule expression in the normal tissue of healthy individuals
|
||
| Disease-specific Molecule Abundances |

|
Click to View the Clearer Original Diagram |
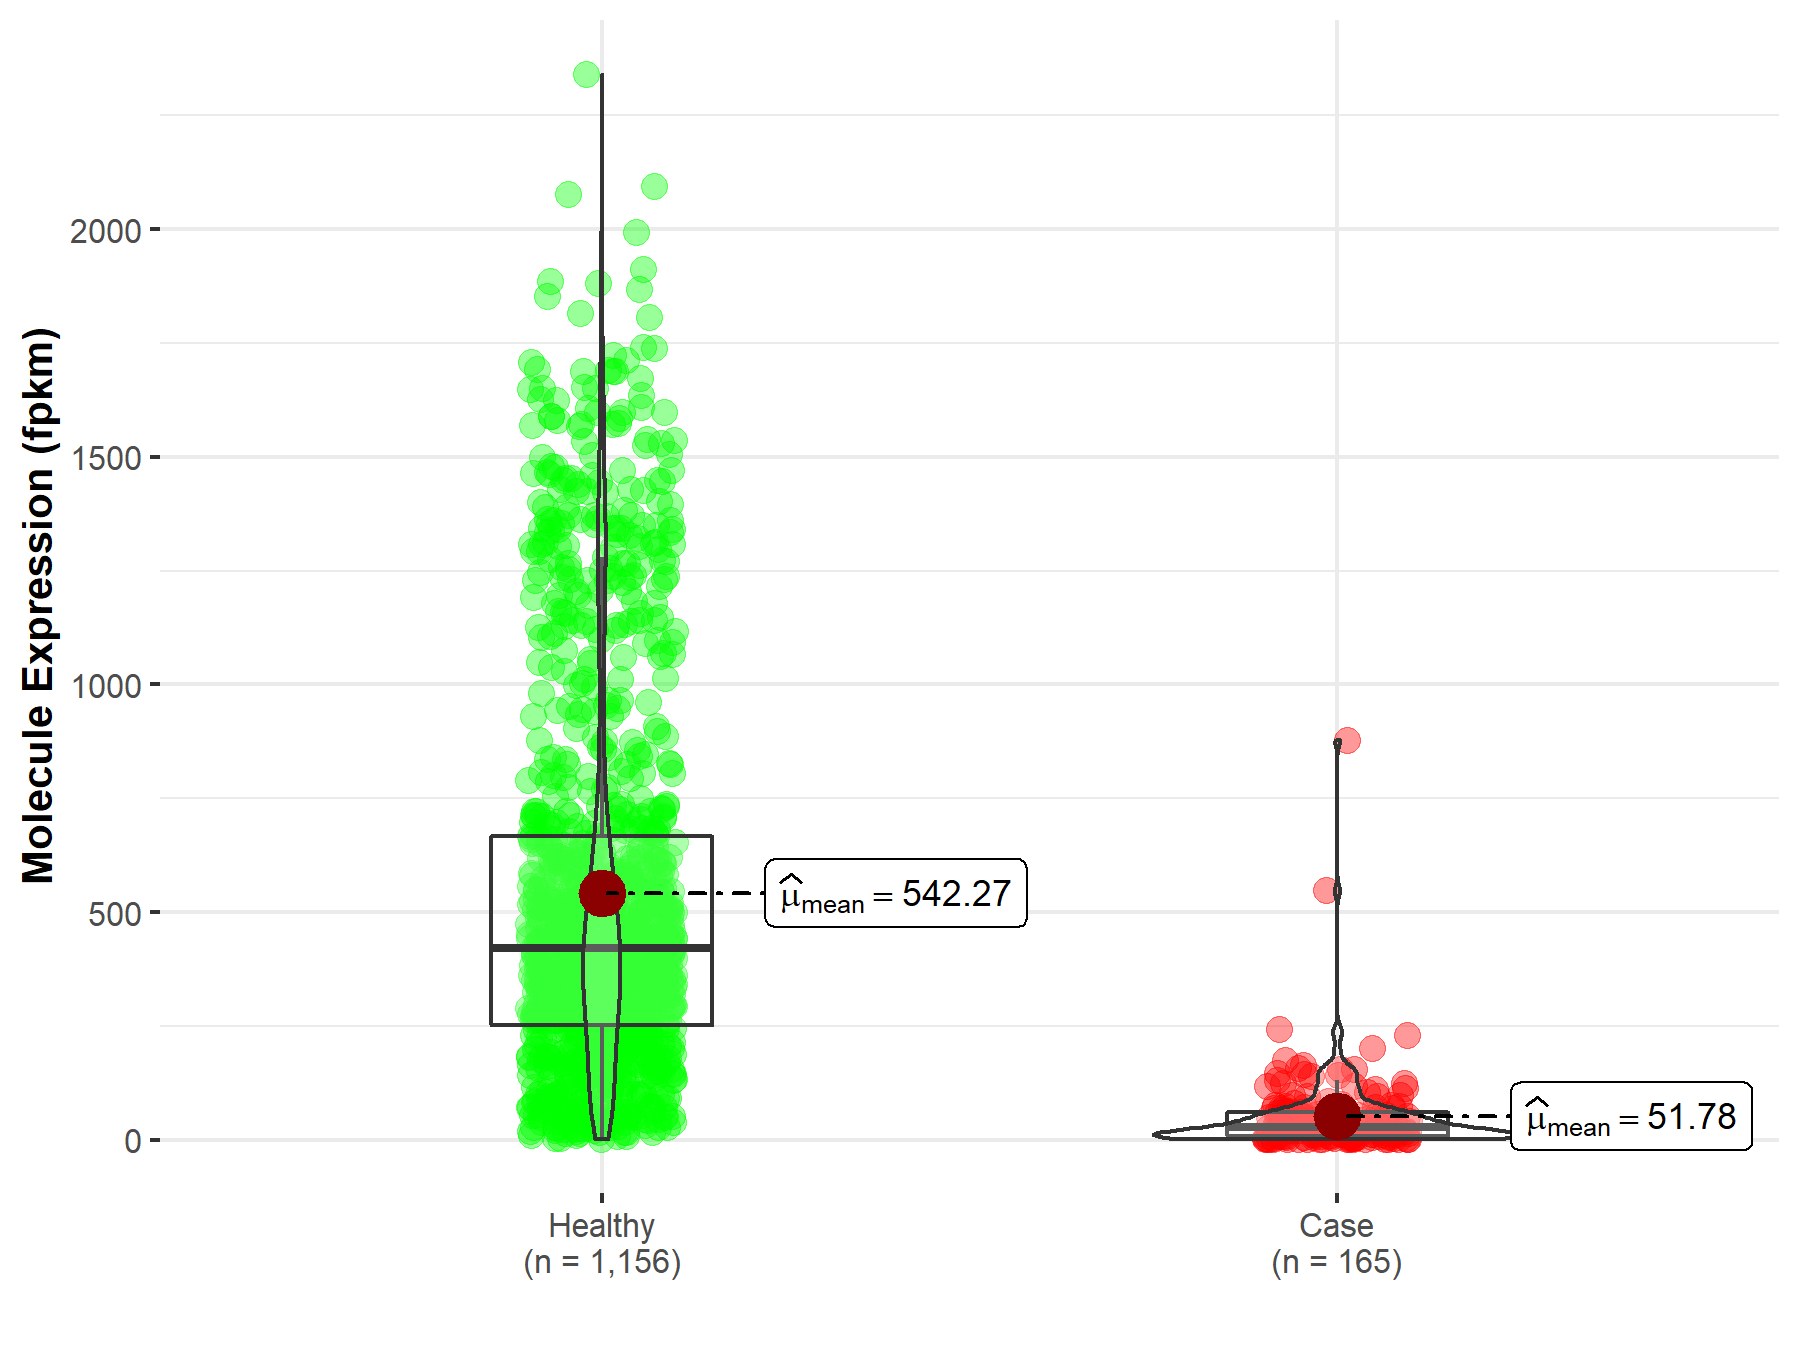
| The Studied Tissue | Brain | |
| The Specified Disease | Glioblastoma multiforme | |
| The Expression Level of Disease Section Compare with the Healthy Individual Tissue | p-value: 4.54E-168; Fold-change: 2.69E-01 | |
|
Molecule expression in the diseased tissue of patients
Molecule expression in the normal tissue of healthy individuals
|
||
| Disease-specific Molecule Abundances |
|
Click to View the Clearer Original Diagram |
| Differential expression of molecule in resistant diseases | ||
| The Studied Tissue | Rectum | |
| The Specified Disease | Rectum adenocarcinoma | |
| The Expression Level of Disease Section Compare with the Healthy Individual Tissue | p-value: 4.07E-01; Fold-change: -5.02E-02 | |
|
Molecule expression in the diseased tissue of patients
Molecule expression in the normal tissue of healthy individuals
|
||
| Disease-specific Molecule Abundances |

|
Click to View the Clearer Original Diagram |
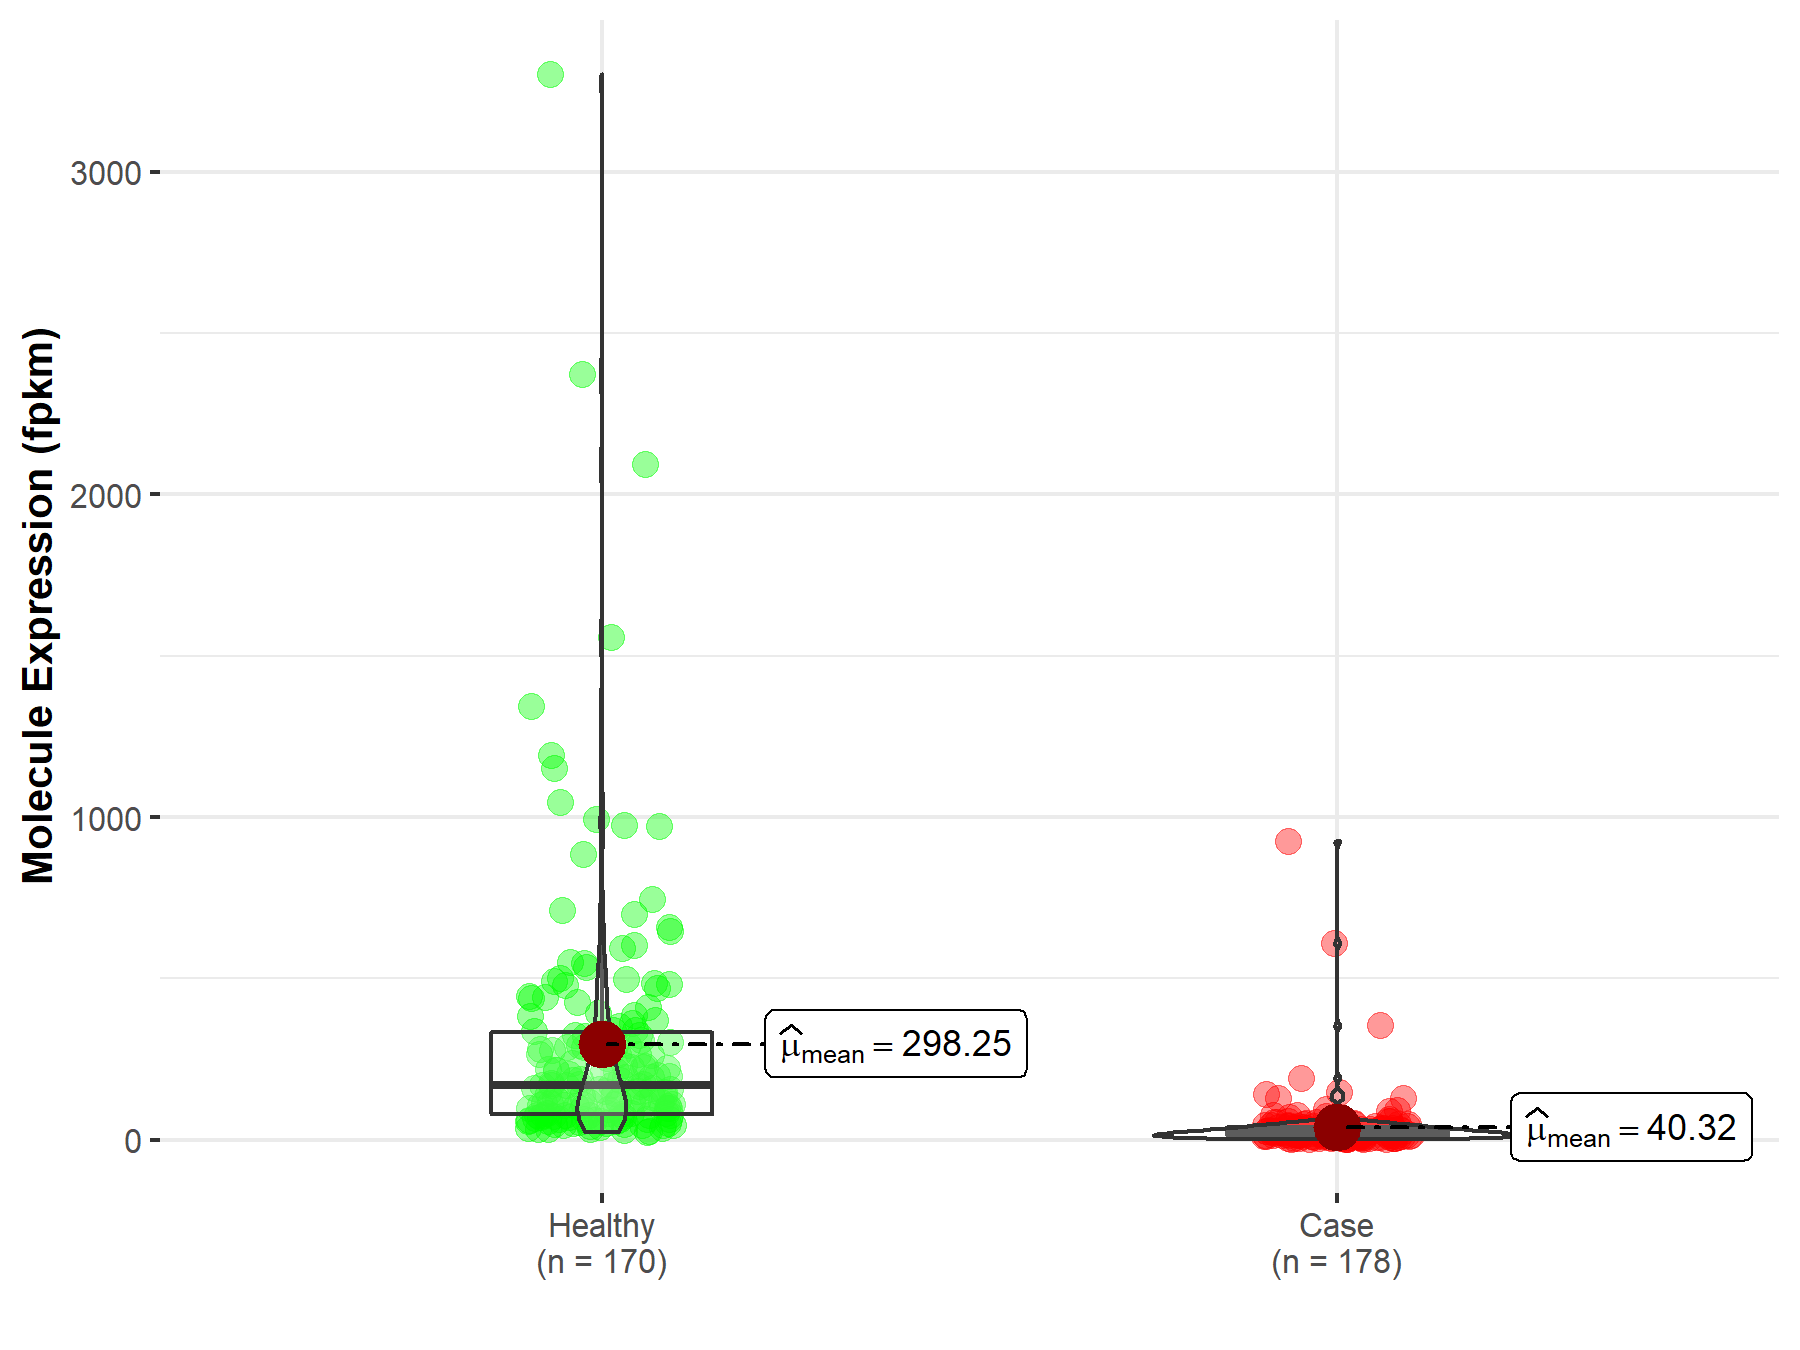
| Differential expression of molecule in resistant diseases | ||
| The Studied Tissue | Pancreas | |
| The Specified Disease | Pancreatic adenocarcinoma | |
| The Expression Level of Disease Section Compare with the Healthy Individual Tissue | p-value: 3.51E-59; Fold-change: 2.13E-01 | |
|
Molecule expression in the diseased tissue of patients
Molecule expression in the normal tissue of healthy individuals
|
||
| Disease-specific Molecule Abundances |
|
Click to View the Clearer Original Diagram |
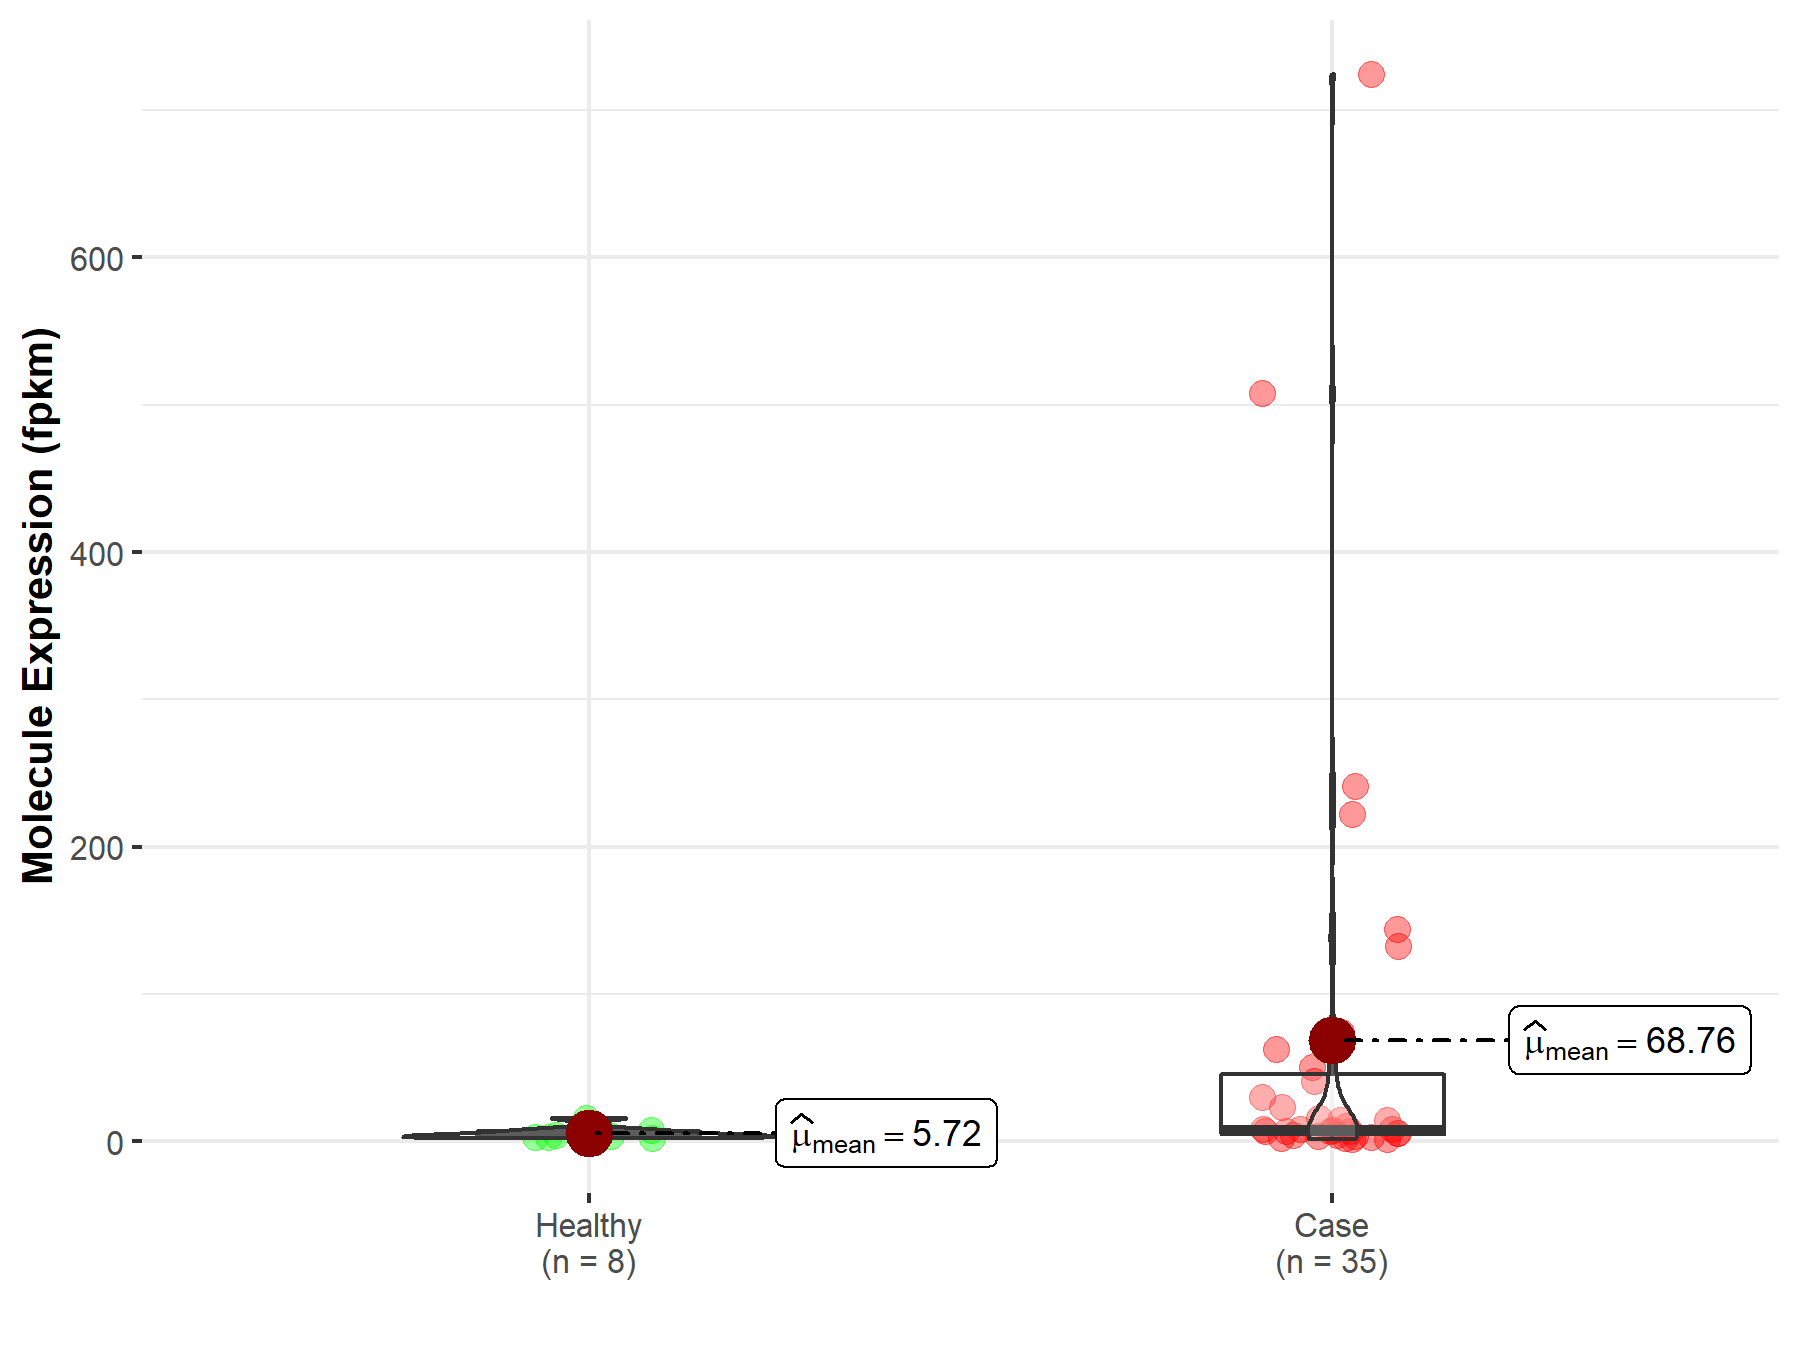
| Differential expression of molecule in resistant diseases | ||
| The Studied Tissue | Bile duct | |
| The Specified Disease | Cholangiocarcinoma | |
| The Expression Level of Disease Section Compare with the Healthy Individual Tissue | p-value: 3.88E-02; Fold-change: -2.13E-01 | |
|
Molecule expression in the diseased tissue of patients
Molecule expression in the normal tissue of healthy individuals
|
||
| Disease-specific Molecule Abundances |
|
Click to View the Clearer Original Diagram |
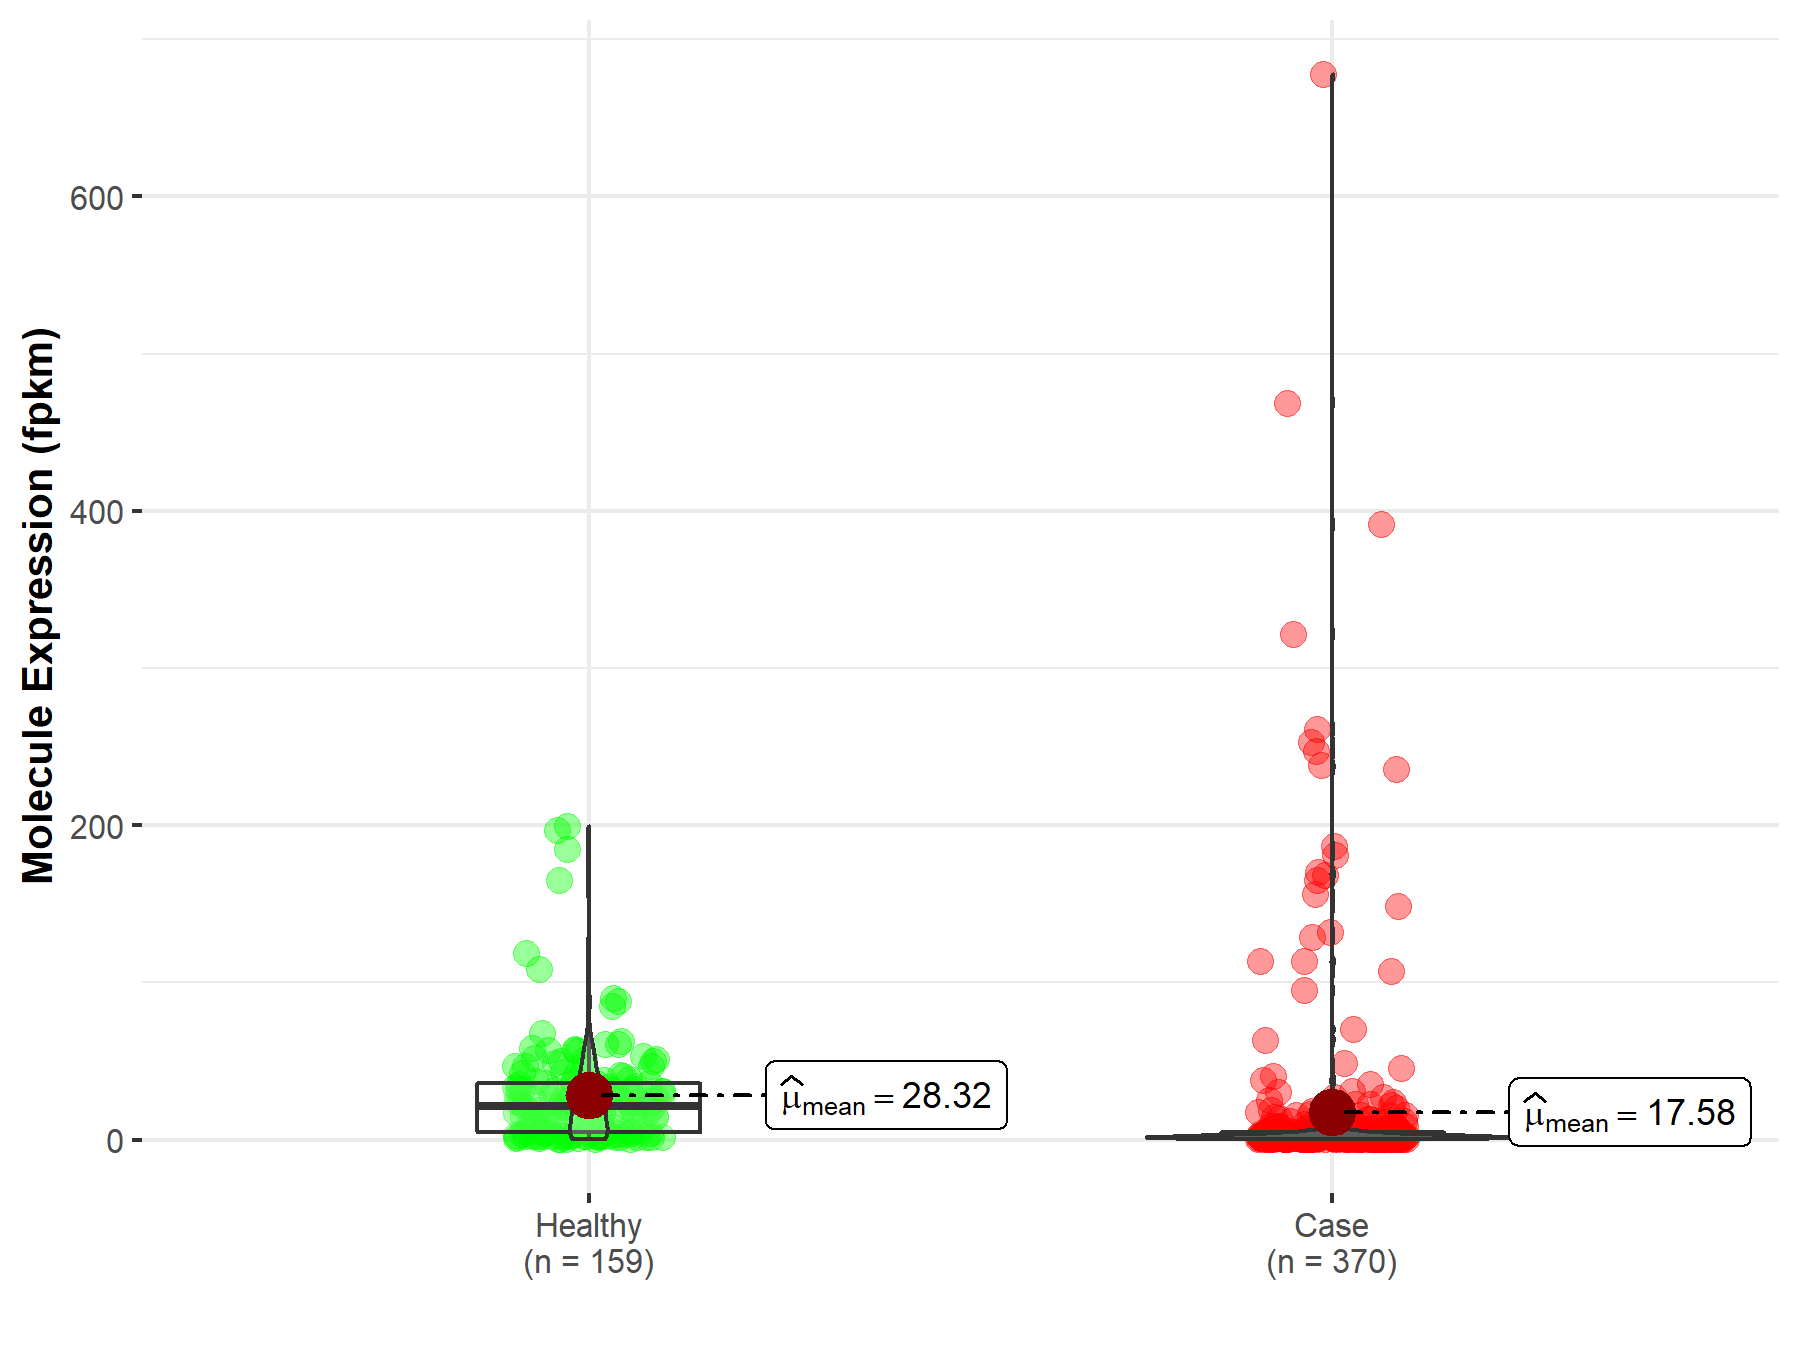
| The Studied Tissue | Liver | |
| The Specified Disease | Liver hepatocellular carcinoma | |
| The Expression Level of Disease Section Compare with the Healthy Individual Tissue | p-value: 3.16E-27; Fold-change: 2.82E-01 | |
|
Molecule expression in the diseased tissue of patients
Molecule expression in the normal tissue of healthy individuals
|
||
| Disease-specific Molecule Abundances |
|
Click to View the Clearer Original Diagram |
| Differential expression of molecule in resistant diseases | ||
| The Studied Tissue | Lung | |
| The Specified Disease | Lung adenocarcinoma | |
| The Expression Level of Disease Section Compare with the Healthy Individual Tissue | p-value: 1.93E-59; Fold-change: 2.53E-01 | |
|
Molecule expression in the diseased tissue of patients
Molecule expression in the normal tissue of healthy individuals
|
||
| Disease-specific Molecule Abundances |

|
Click to View the Clearer Original Diagram |
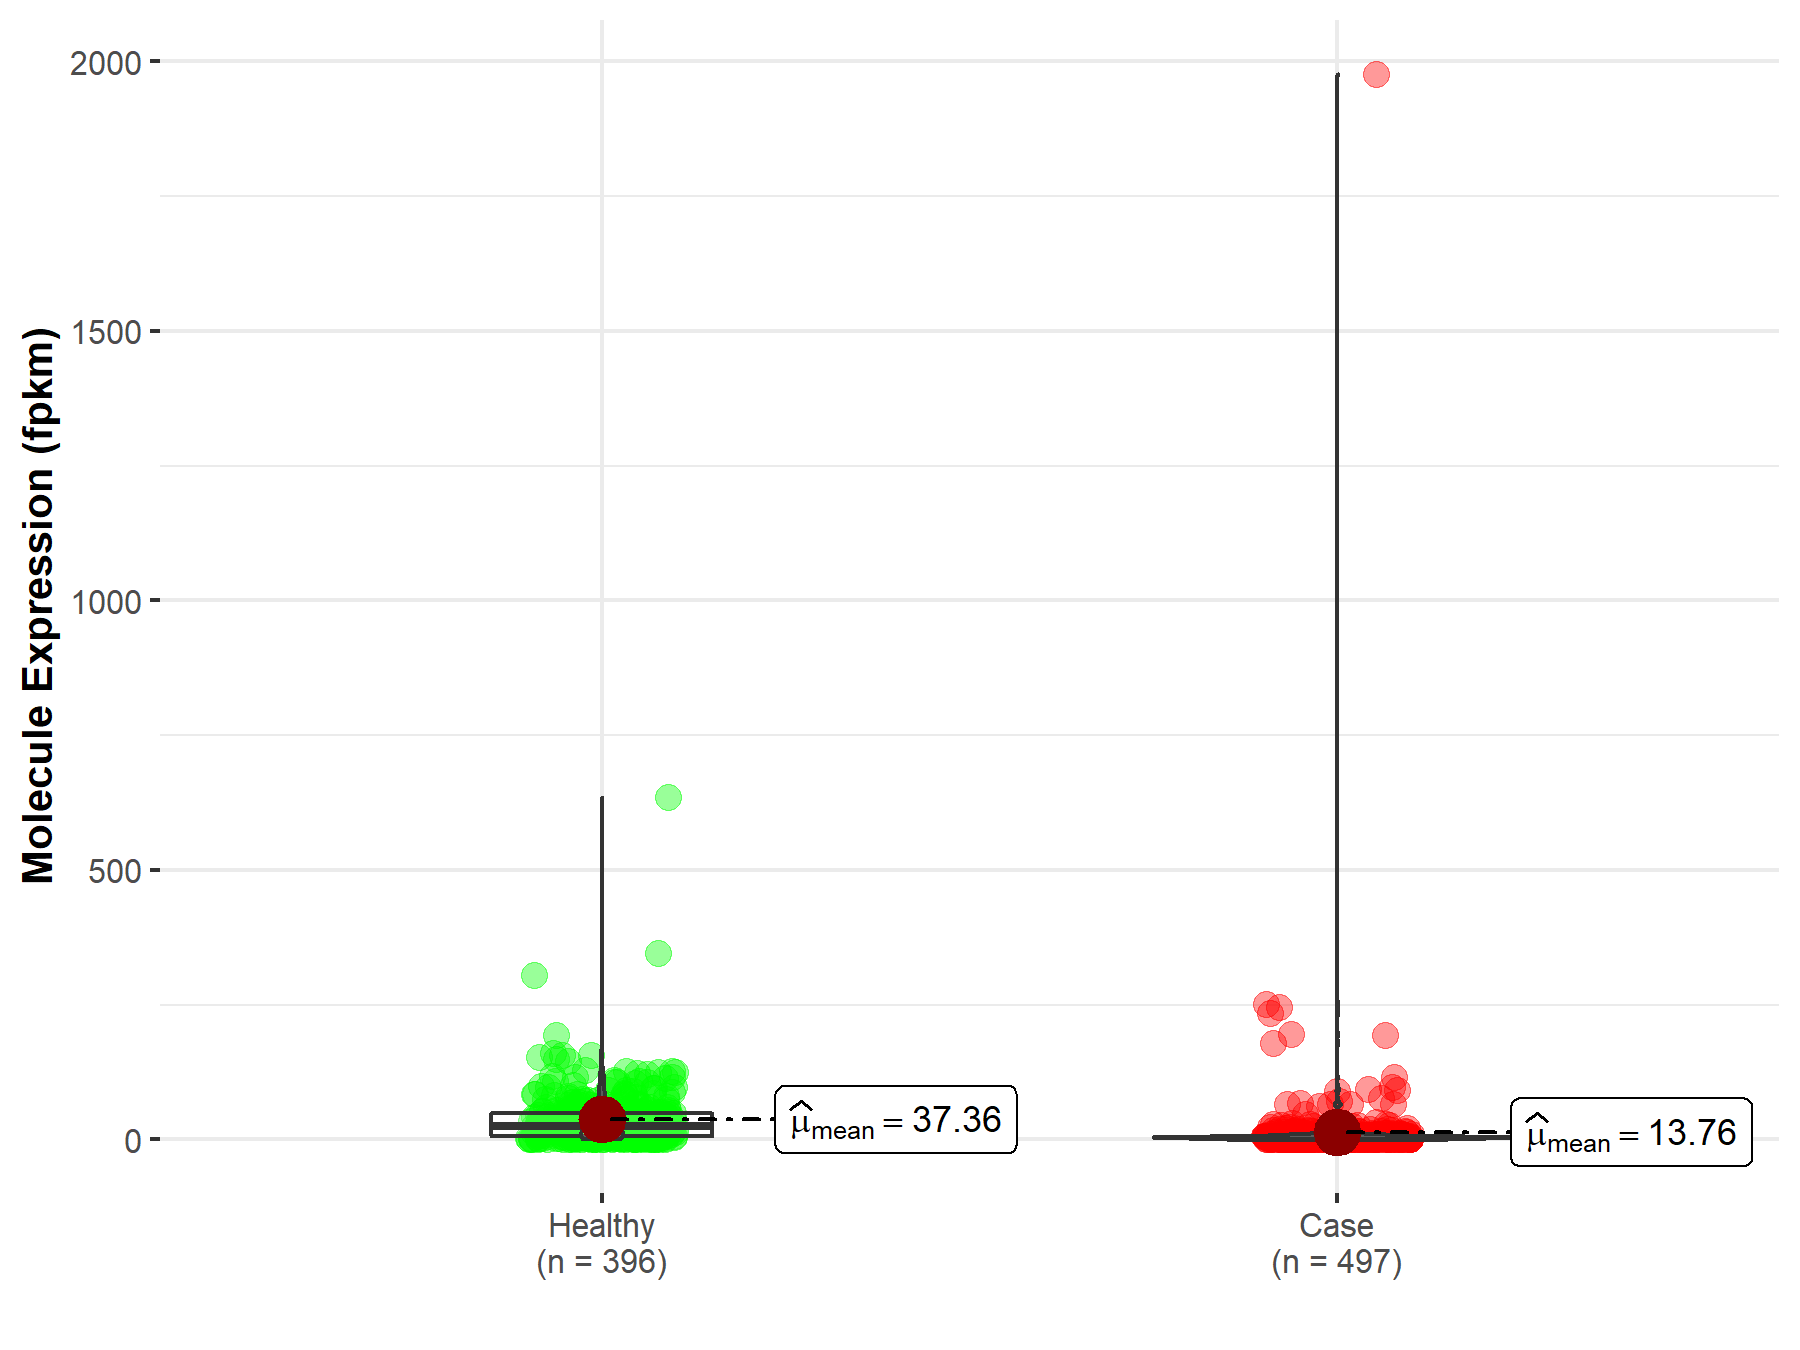
| The Studied Tissue | Lung | |
| The Specified Disease | Lung squamous cell carcinoma | |
| The Expression Level of Disease Section Compare with the Healthy Individual Tissue | p-value: 1.82E-63; Fold-change: 2.57E-01 | |
|
Molecule expression in the diseased tissue of patients
Molecule expression in the normal tissue of healthy individuals
|
||
| Disease-specific Molecule Abundances |
|
Click to View the Clearer Original Diagram |
| Differential expression of molecule in resistant diseases | ||
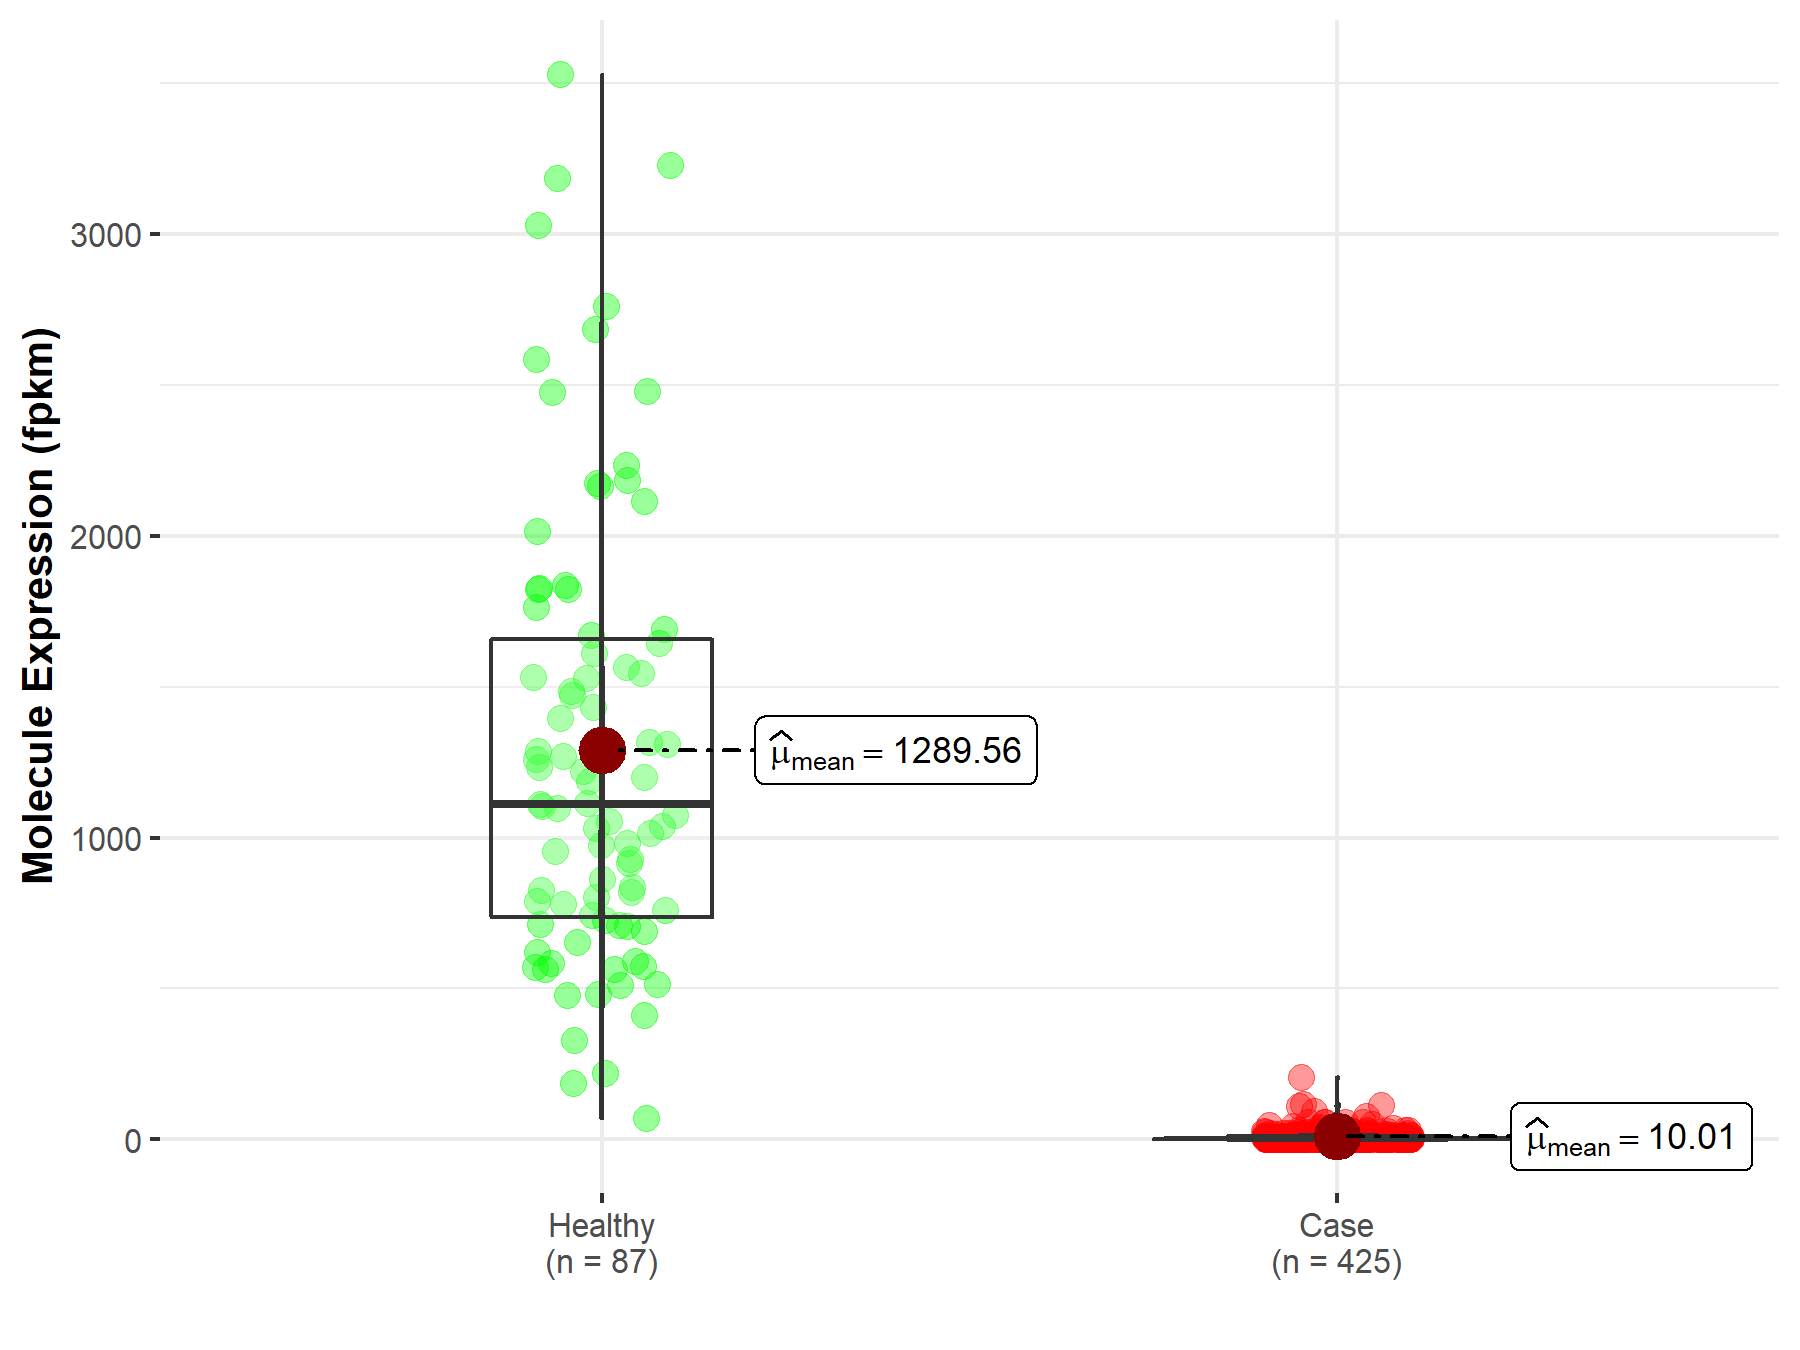
| The Studied Tissue | Ovary | |
| The Specified Disease | Ovarian serous cystadenocarcinoma | |
| The Expression Level of Disease Section Compare with the Healthy Individual Tissue | p-value: 7.69E-189; Fold-change: 5.77E-01 | |
|
Molecule expression in the diseased tissue of patients
Molecule expression in the normal tissue of healthy individuals
|
||
| Disease-specific Molecule Abundances |
|
Click to View the Clearer Original Diagram |
| Differential expression of molecule in resistant diseases | ||
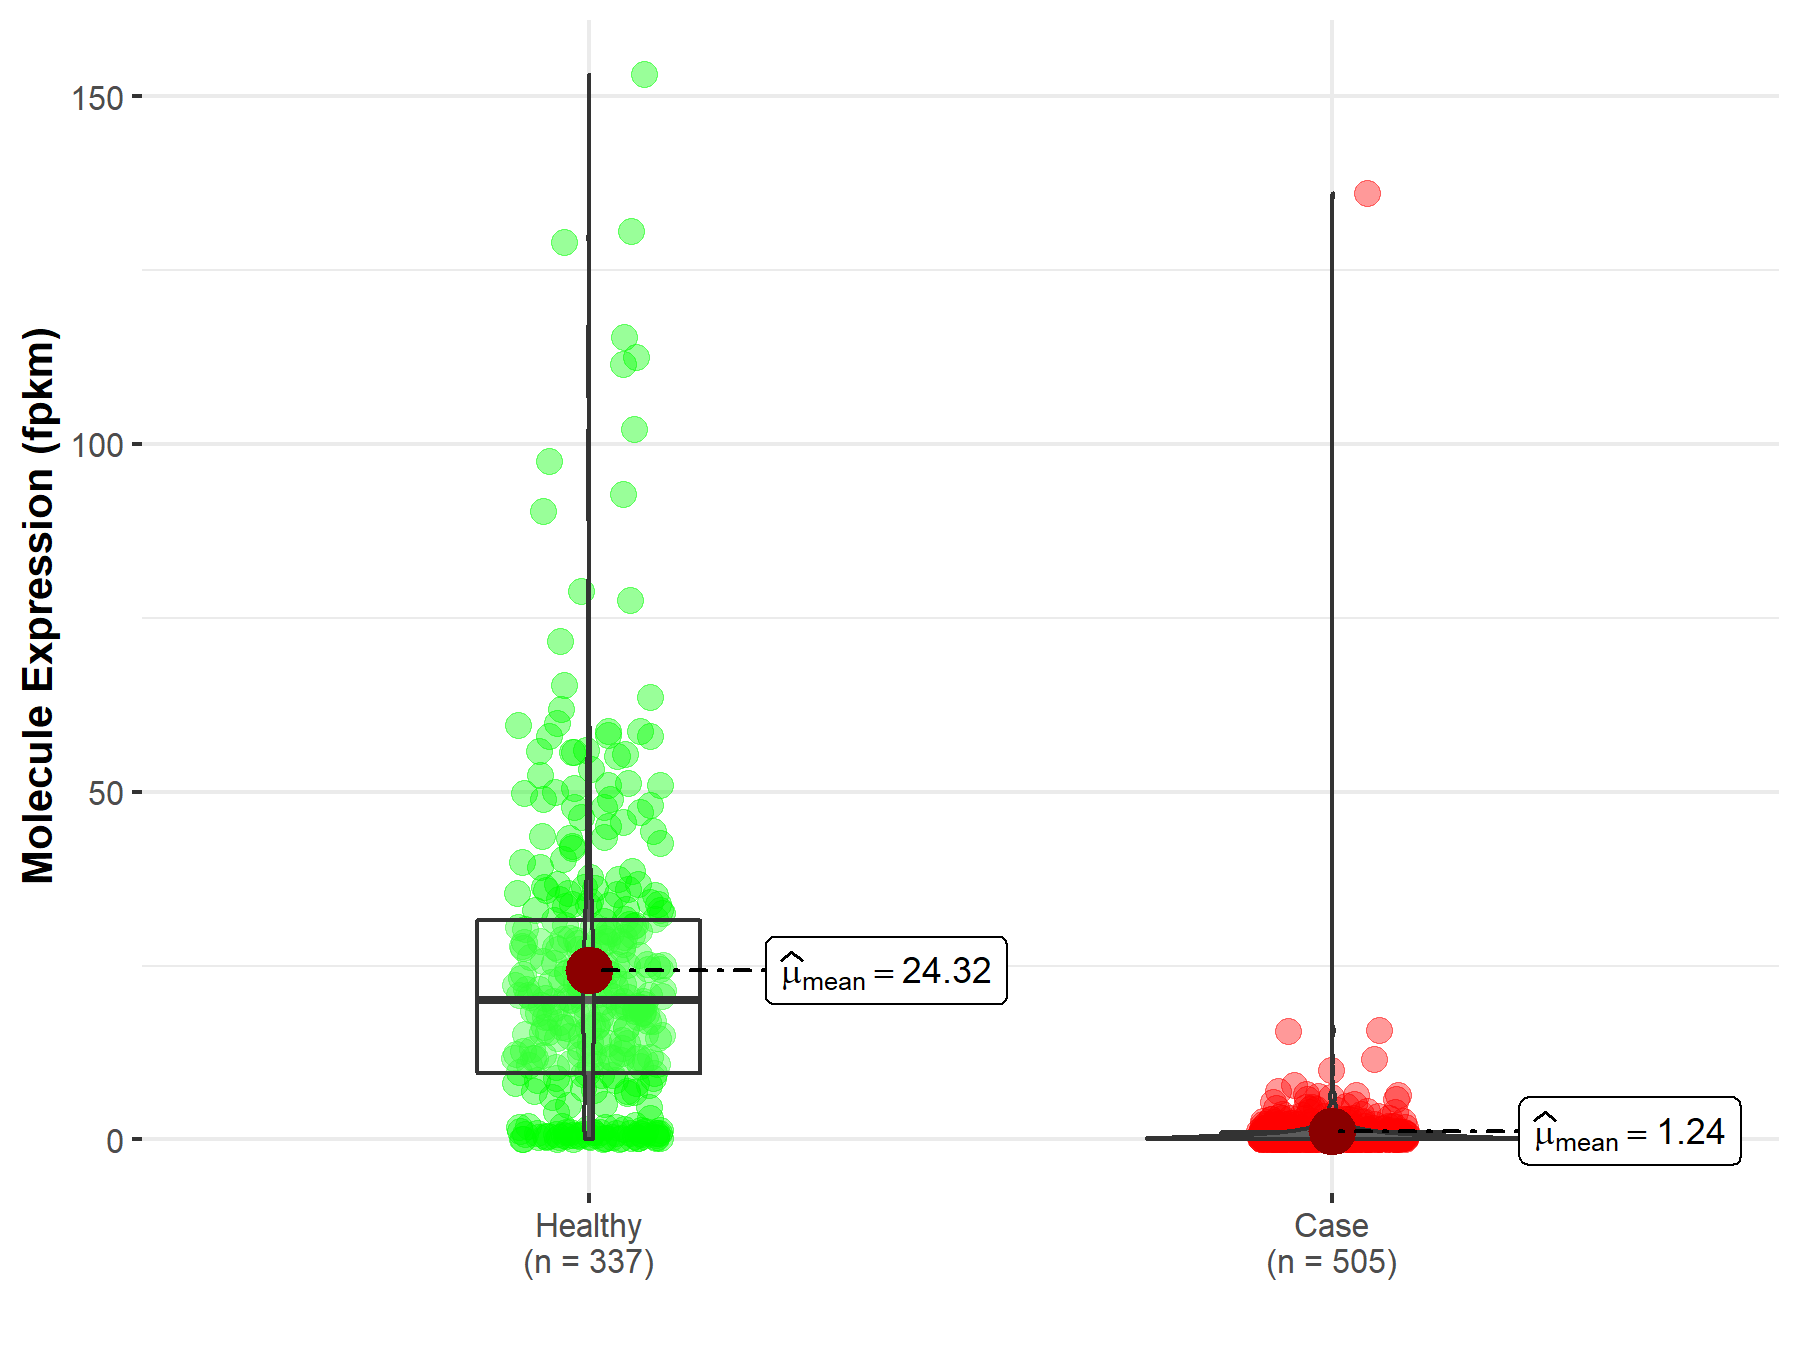
| The Studied Tissue | Thyroid | |
| The Specified Disease | Thyroid carcinoma | |
| The Expression Level of Disease Section Compare with the Healthy Individual Tissue | p-value: 3.09E-177; Fold-change: 7.14E-01 | |
|
Molecule expression in the diseased tissue of patients
Molecule expression in the normal tissue of healthy individuals
|
||
| Disease-specific Molecule Abundances |
|
Click to View the Clearer Original Diagram |
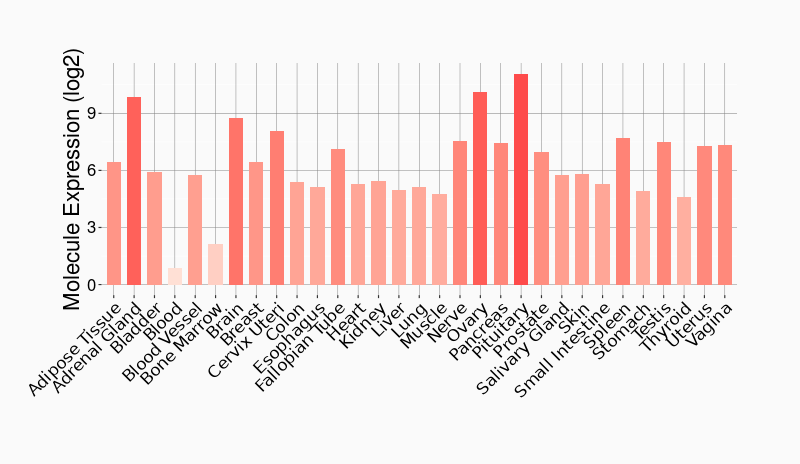
Tissue-specific Molecule Abundances in Healthy Individuals

|
||
References
If you find any error in data or bug in web service, please kindly report it to Dr. Sun and Dr. Yu.
