Molecule Information
General Information of the Molecule (ID: Mol01910)
| Name |
Reticulocalbin 1 (RCN1)
,Homo sapiens
|
||||
|---|---|---|---|---|---|
| Synonyms |
RCN1; RCN
Click to Show/Hide
|
||||
| Molecule Type |
Protein
|
||||
| Gene Name |
RCN1
|
||||
| Gene ID | |||||
| Location |
chr11:32,091,074-32,105,722[+]
|
||||
| Sequence |
MARGGRGRRLGLALGLLLALVLAPRVLRAKPTVRKERVVRPDSELGERPPEDNQSFQYDH
EAFLGKEDSKTFDQLTPDESKERLGKIVDRIDNDGDGFVTTEELKTWIKRVQKRYIFDNV AKVWKDYDRDKDDKISWEEYKQATYGYYLGNPAEFHDSSDHHTFKKMLPRDERRFKAADL NGDLTATREEFTAFLHPEEFEHMKEIVVLETLEDIDKNGDGFVDQDEYIADMFSHEENGP EPDWVLSEREQFNEFRDLNKDGKLDKDEIRHWILPQDYDHAQAEARHLVYESDKNKDEKL TKEEILENWNMFVGSQATNYGEDLTKNHDEL Click to Show/Hide
|
||||
| Function |
May regulate calcium-dependent activities in the endoplasmic reticulum lumen or post-ER compartment.
Click to Show/Hide
|
||||
| Uniprot ID | |||||
| Ensembl ID | |||||
| HGNC ID | |||||
| Click to Show/Hide the Complete Species Lineage | |||||
Type(s) of Resistant Mechanism of This Molecule
 UAPP: Unusual Activation of Pro-survival Pathway
Drug Resistance Data Categorized by Drug
Approved Drug(s)
1 drug(s) in total
| Drug Resistance Data Categorized by Their Corresponding Mechanisms | ||||
|
Unusual Activation of Pro-survival Pathway (UAPP)
|
||||
| Disease Class: Uterine cancer [ICD-11: 2C78.0] | [1] | |||
| Resistant Disease | Uterine cancer [ICD-11: 2C78.0] | |||
| Resistant Drug | Doxorubicin | |||
| Molecule Alteration | Expression | Up-regulation |
||
| Experimental Note | Revealed Based on the Cell Line Data | |||
| In Vitro Model | MES-SA cells | Uterus | Homo sapiens (Human) | CVCL_1404 |
| Experiment for Molecule Alteration |
Western blotting assay | |||
| Experiment for Drug Resistance |
MTT assay | |||
| Mechanism Description | RCN1 silencing has a significant role on doxorubicin-induced apoptosis in resistant cells, MES-SA/DxR-2 uM and MES-SA/DxR-8 uM, implying RCN1 knockdown has an auxiliary effect to increase resistant cell death during doxorubicin treatment. | |||
Disease- and Tissue-specific Abundances of This Molecule
ICD Disease Classification 02

| Differential expression of molecule in resistant diseases | ||
| The Studied Tissue | Endometrium | |
| The Specified Disease | Uterine cancer | |
| The Expression Level of Disease Section Compare with the Healthy Individual Tissue | p-value: 8.30E-08; Fold-change: -5.00E-01; Z-score: -6.16E-01 | |
| The Expression Level of Disease Section Compare with the Adjacent Tissue | p-value: 9.13E-03; Fold-change: -3.86E-01; Z-score: -1.22E+00 | |
|
Molecule expression in the normal tissue adjacent to the diseased tissue of patients
Molecule expression in the diseased tissue of patients
Molecule expression in the normal tissue of healthy individuals
|
||
| Disease-specific Molecule Abundances |
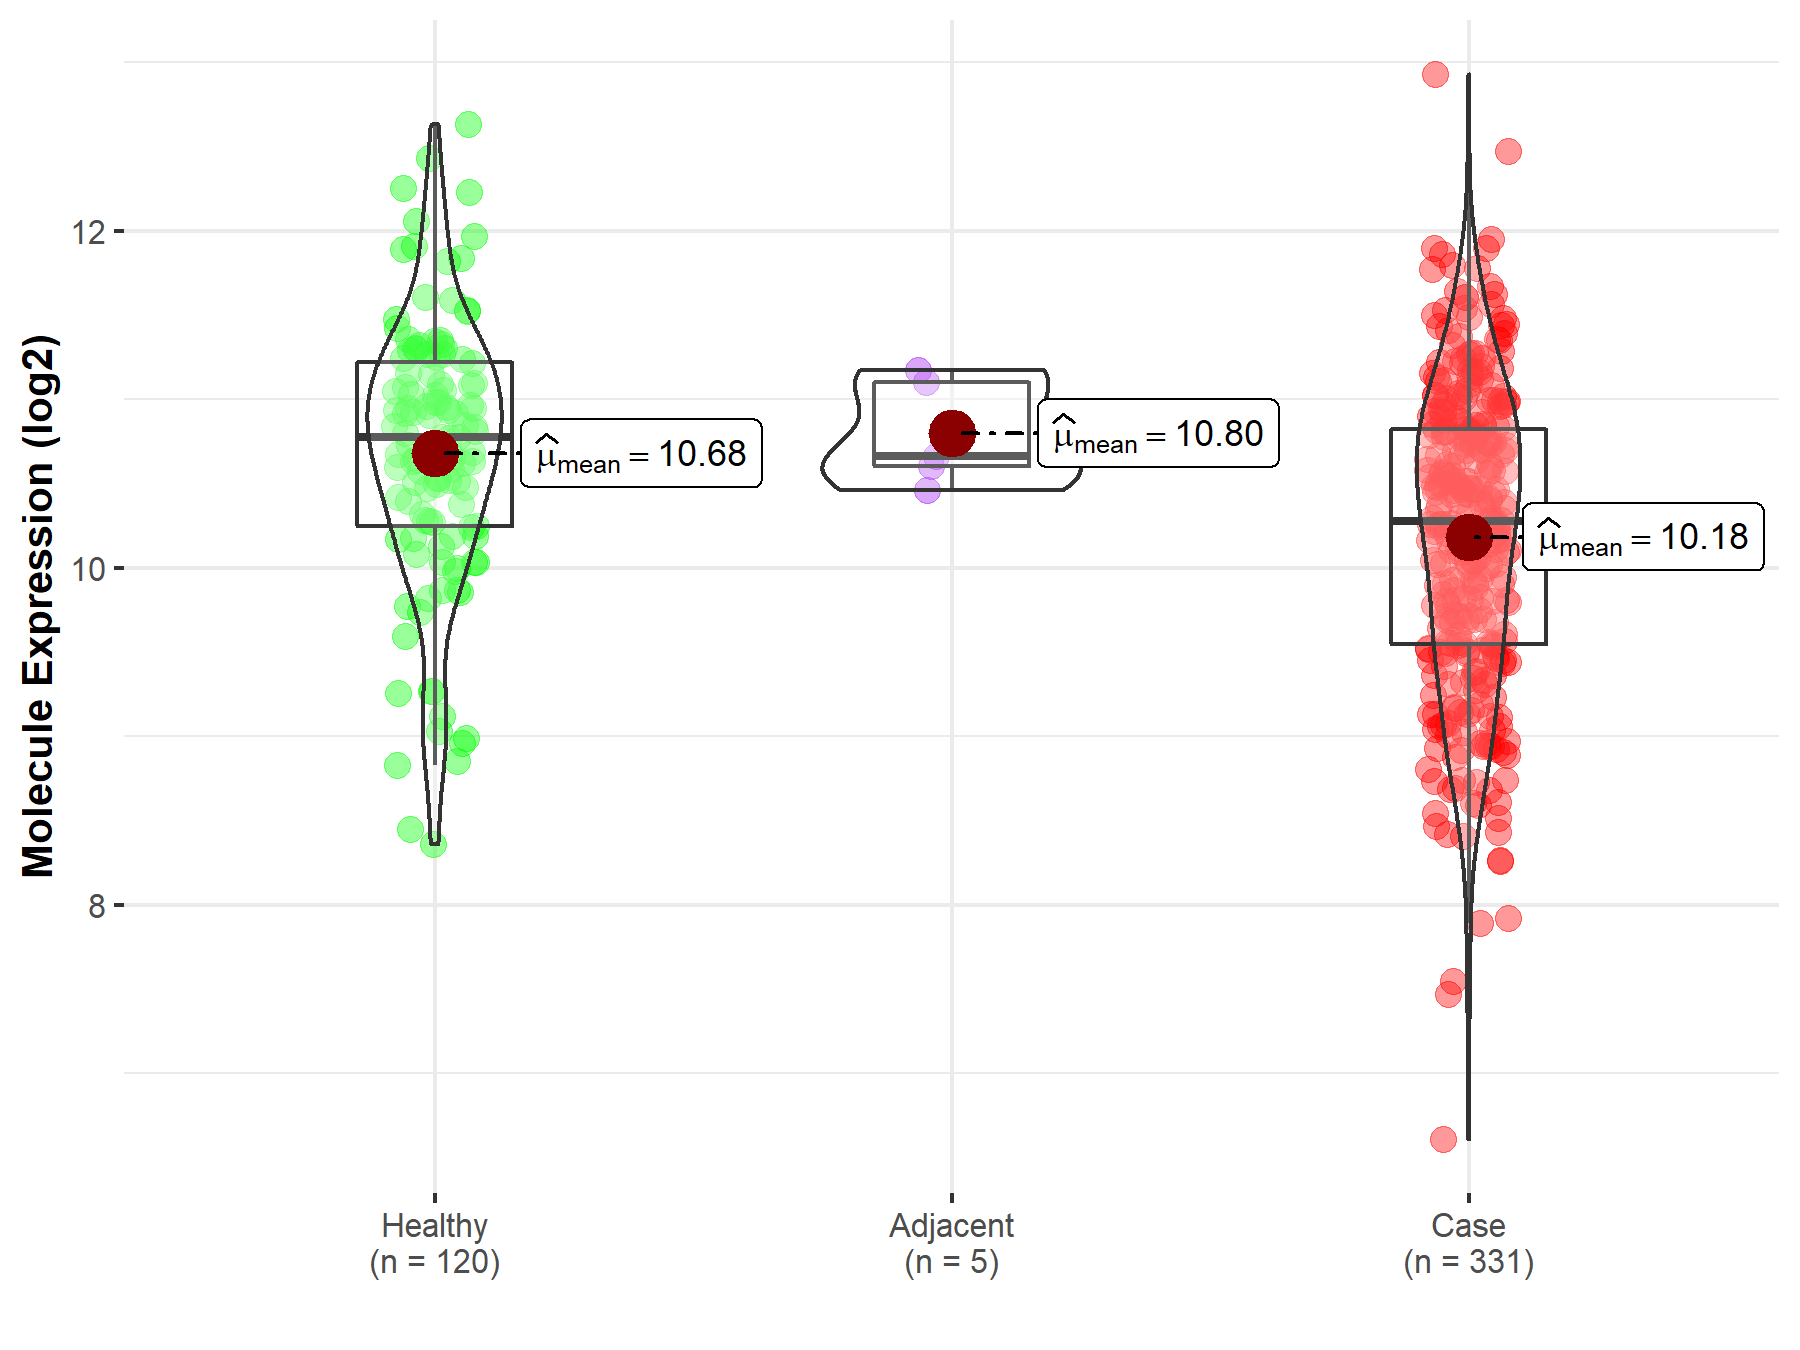
|
Click to View the Clearer Original Diagram |
Tissue-specific Molecule Abundances in Healthy Individuals

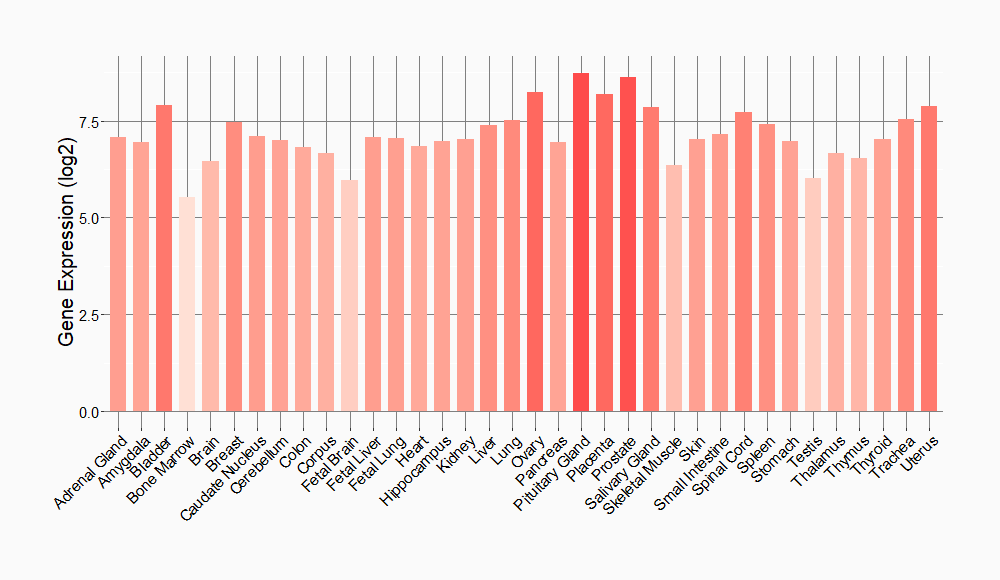
|
||
References
If you find any error in data or bug in web service, please kindly report it to Dr. Sun and Dr. Yu.