Molecule Information
General Information of the Molecule (ID: Mol00542)
| Name |
Osteopontin (OPN)
,Homo sapiens
|
||||
|---|---|---|---|---|---|
| Synonyms |
Bone sialoprotein 1; Nephropontin; Secreted phosphoprotein 1; SPP-1; Urinary stone protein; Uropontin; BNSP; OPN; PSEC0156
Click to Show/Hide
|
||||
| Molecule Type |
Protein
|
||||
| Gene Name |
SPP1
|
||||
| Gene ID | |||||
| Location |
chr4:87975667-87983532[+]
|
||||
| Sequence |
MRIAVICFCLLGITCAIPVKQADSGSSEEKQLYNKYPDAVATWLNPDPSQKQNLLAPQNA
VSSEETNDFKQETLPSKSNESHDHMDDMDDEDDDDHVDSQDSIDSNDSDDVDDTDDSHQS DESHHSDESDELVTDFPTDLPATEVFTPVVPTVDTYDGRGDSVVYGLRSKSKKFRRPDIQ YPDATDEDITSHMESEELNGAYKAIPVAQDLNAPSDWDSRGKDSYETSQLDDQSAETHSH KQSRLYKRKANDESNEHSDVIDSQELSKVSREFHSHEFHSHEDMLVVDPKSKEEDKHLKF RISHELDSASSEVN Click to Show/Hide
|
||||
| 3D-structure |
|
||||
| Function |
Major non-collagenous bone protein that binds tightly to hydroxyapatite. Appears to form an integral part of the mineralized matrix. Probably important to cell-matrix interaction.
Click to Show/Hide
|
||||
| Uniprot ID | |||||
| Ensembl ID | |||||
| HGNC ID | |||||
| Click to Show/Hide the Complete Species Lineage | |||||
Type(s) of Resistant Mechanism of This Molecule
 UAPP: Unusual Activation of Pro-survival Pathway
Drug Resistance Data Categorized by Drug
Approved Drug(s)
2 drug(s) in total
| Drug Sensitivity Data Categorized by Their Corresponding Mechanisms | ||||
|
Unusual Activation of Pro-survival Pathway (UAPP)
|
||||
| Disease Class: Breast cancer [ICD-11: 2C60.3] | [1] | |||
| Sensitive Disease | Breast cancer [ICD-11: 2C60.3] | |||
| Sensitive Drug | Doxorubicin | |||
| Molecule Alteration | Expression | Down-regulation |
||
| Experimental Note | Revealed Based on the Cell Line Data | |||
| Cell Pathway Regulation | Cell apoptosis | Activation | hsa04210 | |
| Cell colony | Inhibition | hsa05200 | ||
| Cell invasion | Inhibition | hsa05200 | ||
| Cell viability | Inhibition | hsa05200 | ||
| p53 signaling pathway | Activation | hsa04115 | ||
| In Vitro Model | MCF-7 cells | Breast | Homo sapiens (Human) | CVCL_0031 |
| In Vivo Model | BALB/c nude mouse xenograft model | Mus musculus | ||
| Experiment for Molecule Alteration |
Western blot analysis | |||
| Experiment for Drug Resistance |
CCK8 assay | |||
| Mechanism Description | The microRNA miR-181c enhances chemosensitivity and reduces chemoresistance in breast cancer cells via down-regulating osteopontin. | |||
| Drug Resistance Data Categorized by Their Corresponding Mechanisms | ||||
|
Unusual Activation of Pro-survival Pathway (UAPP)
|
||||
| Disease Class: Colon cancer [ICD-11: 2B90.1] | [2] | |||
| Resistant Disease | Colon cancer [ICD-11: 2B90.1] | |||
| Resistant Drug | Irinotecan | |||
| Molecule Alteration | Expression | Up-regulation |
||
| Experimental Note | Revealed Based on the Cell Line Data | |||
| Cell Pathway Regulation | NF+kB signaling pathway | Activation | hsa04218 | |
| In Vitro Model | DLD-1 cells | Colon | Homo sapiens (Human) | CVCL_0248 |
| SW-480 cells | Colon | Homo sapiens (Human) | CVCL_0546 | |
| RkO cells | Colon | Homo sapiens (Human) | CVCL_0504 | |
| Experiment for Molecule Alteration |
Immunoblotting assay; qRT-PCR; Immunofluorescence staining assay; Reporter Gene assay; RNA sequencing assay | |||
| Experiment for Drug Resistance |
Cell cytotoxicity assay; Tumorigenicity assay | |||
| Mechanism Description | Our data suggest that irinotecan upregulates various oncogenes, proliferative pathways, and metastatic markers, which may compromise its efficacy. SN38 induces p53-independent CDKIs and regulates cancer cell growth. OPN silencing regulates the SN38-mediated increase in PD-L1. Inhibition of non-canonical NF-kappaB signaling by QNZ results in the regulation of SN38-induced survivin and ISG15 (Figure 7). The targeting of OPN, PD-L1, ISG15, and NF-kappaB pathways may elevate irinotecan potency and lead to its combination with immunomodulatory therapies for CRC prognostic strategies. | |||
Disease- and Tissue-specific Abundances of This Molecule
ICD Disease Classification 02

| Differential expression of molecule in resistant diseases | ||
| The Studied Tissue | Breast tissue | |
| The Specified Disease | Breast cancer | |
| The Expression Level of Disease Section Compare with the Healthy Individual Tissue | p-value: 4.99E-100; Fold-change: 1.67E+00; Z-score: 2.03E+00 | |
| The Expression Level of Disease Section Compare with the Adjacent Tissue | p-value: 1.23E-10; Fold-change: 1.03E+00; Z-score: 1.18E+00 | |
|
Molecule expression in the normal tissue adjacent to the diseased tissue of patients
Molecule expression in the diseased tissue of patients
Molecule expression in the normal tissue of healthy individuals
|
||
| Disease-specific Molecule Abundances |
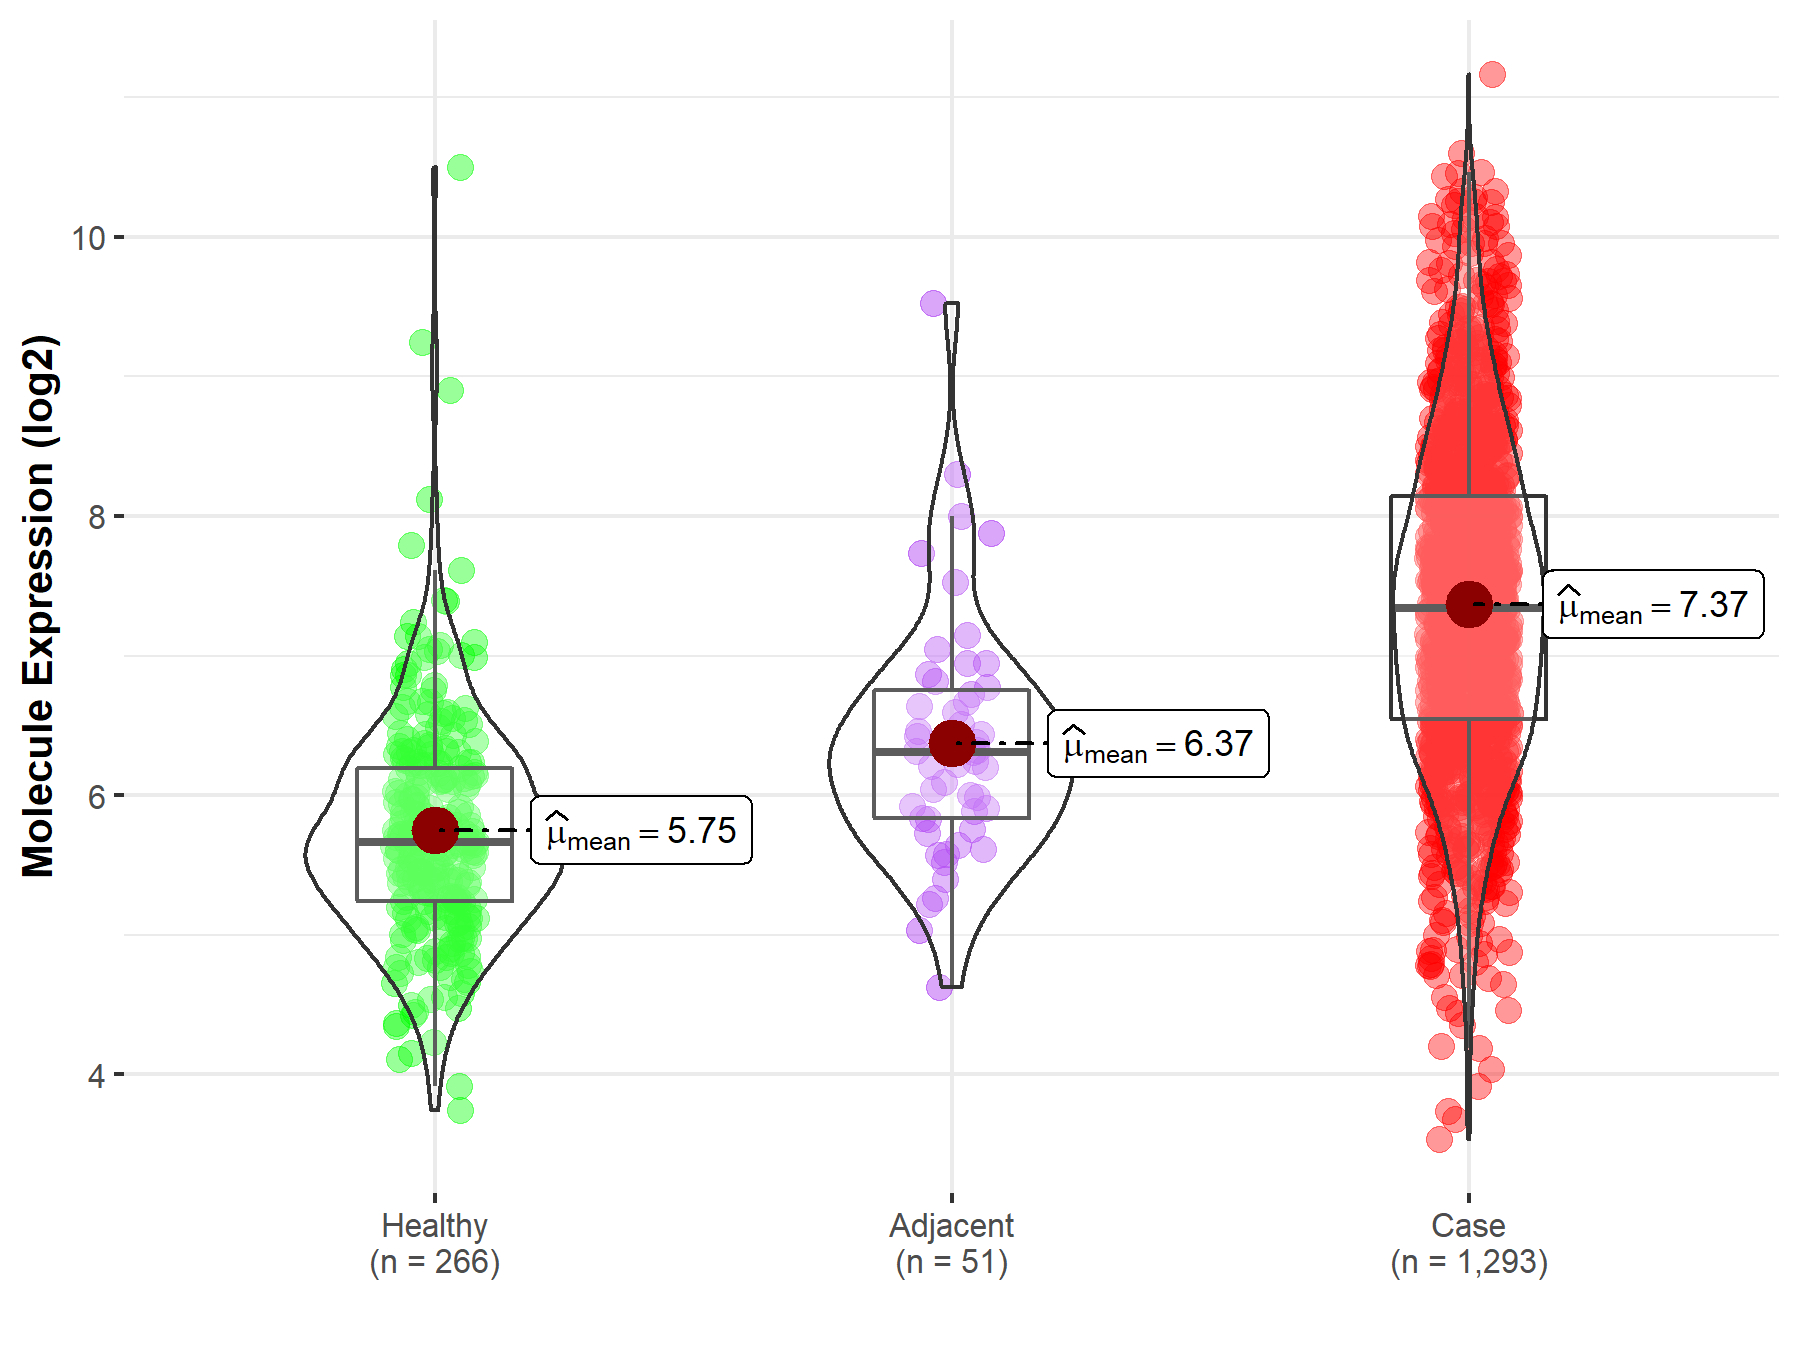
|
Click to View the Clearer Original Diagram |
Tissue-specific Molecule Abundances in Healthy Individuals

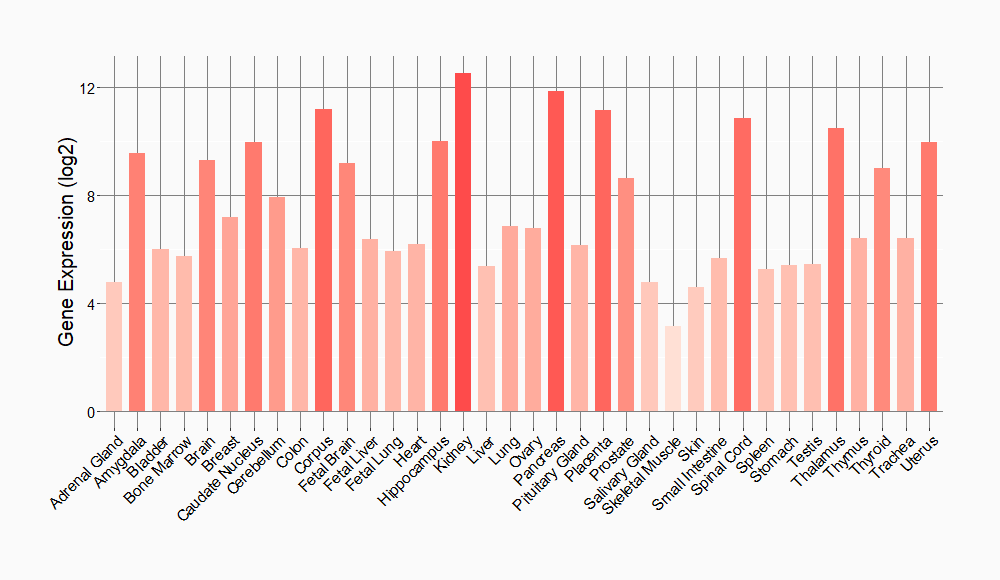
|
||
References
If you find any error in data or bug in web service, please kindly report it to Dr. Sun and Dr. Yu.