Drug Information
Drug (ID: DG00088) and It's Reported Resistant Information
| Name |
Irinotecan
|
||||
|---|---|---|---|---|---|
| Synonyms |
Biotecan; Camptosar; Irinotecanum; IRINOTECAN HYDROCHLORIDE Trihydrate; Irinotecan Hcl; Irinotecan hydrochloride; CP0; Biotecan (TN); Campto (TN); Camptosar (TN); Irinotecan (INN); Irinotecan [INN:BAN]; Irinotecanum [INN-Latin]; IRINOTECAN, CPT-11; Camptosar, Campto, CPT-11, Irinotecan; (+)-Irinotecan; (4S)-4,11-DIETHYL-4-HYDROXY-3,14-DIOXO-3,4,12,14-TETRAHYDRO-1H-PYRANO[3',4':6,7]INDOLIZINO[1,2-B]QUINOLIN-9-YL 1,4'-BIPIPERIDINE-1'-CARBOXYLATE; (4S)-4,11-Diethyl-4-hydroxy-3,14-dioxo-4,12-dihydro-1H-pyrano[3,4-f]quinolino[2,3-a]indolizin-9-yl 4-piperidylpiperidinecarboxylate; Irinotecan (TOPO1 inhibitor); Onivyde
Click to Show/Hide
|
||||
| Indication |
In total 1 Indication(s)
|
||||
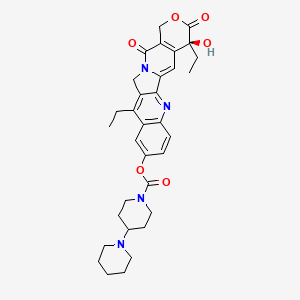
| Structure |
|
||||
| Drug Resistance Disease(s) |
Disease(s) with Clinically Reported Resistance for This Drug
(3 diseases)
[2]
[4]
[5]
Disease(s) with Resistance Information Discovered by Cell Line Test for This Drug
(3 diseases)
[3]
[5]
[1]
|
||||
| Target | DNA topoisomerase I (TOP1) | TOP1_HUMAN | [1] | ||
| Click to Show/Hide the Molecular Information and External Link(s) of This Drug | |||||
| Formula |
C33H38N4O6
|
||||
| IsoSMILES |
CCC1=C2CN3C(=CC4=C(C3=O)COC(=O)[C@@]4(CC)O)C2=NC5=C1C=C(C=C5)OC(=O)N6CCC(CC6)N7CCCCC7
|
||||
| InChI |
1S/C33H38N4O6/c1-3-22-23-16-21(43-32(40)36-14-10-20(11-15-36)35-12-6-5-7-13-35)8-9-27(23)34-29-24(22)18-37-28(29)17-26-25(30(37)38)19-42-31(39)33(26,41)4-2/h8-9,16-17,20,41H,3-7,10-15,18-19H2,1-2H3/t33-/m0/s1
|
||||
| InChIKey |
UWKQSNNFCGGAFS-XIFFEERXSA-N
|
||||
| PubChem CID | |||||
| ChEBI ID | |||||
| TTD Drug ID | |||||
| VARIDT ID | |||||
| DrugBank ID | |||||
Type(s) of Resistant Mechanism of This Drug
 DISM: Drug Inactivation by Structure Modification
 EADR: Epigenetic Alteration of DNA, RNA or Protein
 IDUE: Irregularity in Drug Uptake and Drug Efflux
 MRAP: Metabolic Reprogramming via Altered Pathways
 UAPP: Unusual Activation of Pro-survival Pathway
Drug Resistance Data Categorized by Their Corresponding Diseases
ICD-02: Benign/in-situ/malignant neoplasm
| Drug Resistance Data Categorized by Their Corresponding Mechanisms | ||||
|
Drug Inactivation by Structure Modification (DISM)
|
||||
| Key Molecule: Glutathione S-transferase P (GSTP1) | [2] | |||
| Resistant Disease | Malignant glioma [ICD-11: 2A00.2] | |||
| Molecule Alteration | Expression | Up-regulation |
||
| Differential expression of the molecule in resistant disease | ||||
| Classification of Disease | Brain cancer [ICD-11: 2A00] | |||
| The Specified Disease | Malignant glioma | |||
| The Studied Tissue | Blood | |||
| The Expression Level of Disease Section Compare with the Healthy Individual Tissue | p-value: 3.99E-02 Fold-change: 1.21E-01 Z-score: 2.07E+00 |
|||
| Experimental Note | Identified from the Human Clinical Data | |||
| In Vitro Model | Malignant gliomas tissue | N.A. | ||
| Experiment for Molecule Alteration |
Immunohistochemistry assay | |||
| Experiment for Drug Resistance |
EDR assay | |||
| Mechanism Description | In vitro drug resistance in malignant gliomas was independent of prior therapy. High-grade glioblastomas showed a lower level of extreme drug resistance than low-grade astrocytomas to cisplatin (11% versus 27%), temozolomide (14% versus 27%), irinotecan (33% versus 53%), and BCNU (29% versus 38%). A substantial percentage of brain tumors overexpressed biomarkers associated with drug resistance, including MGMT (67%), GSTP1 (49%), and mutant p53 (41%). MGMT and GSTP1 overexpression was independently associated with in vitro resistance to BCNU, whereas coexpression of these two markers was associated with the greatest degree of BCNU resistance. | |||
|
Irregularity in Drug Uptake and Drug Efflux (IDUE)
|
||||
| Key Molecule: Multidrug resistance protein 1 (ABCB1) | [2] | |||
| Resistant Disease | Malignant glioma [ICD-11: 2A00.2] | |||
| Molecule Alteration | Expression | Up-regulation |
||
| Experimental Note | Identified from the Human Clinical Data | |||
| In Vitro Model | Malignant gliomas tissue | N.A. | ||
| Experiment for Molecule Alteration |
Immunohistochemistry assay | |||
| Experiment for Drug Resistance |
EDR assay | |||
| Mechanism Description | In vitro drug resistance in malignant gliomas was independent of prior therapy. High-grade glioblastomas showed a lower level of extreme drug resistance than low-grade astrocytomas to cisplatin (11% versus 27%), temozolomide (14% versus 27%), irinotecan (33% versus 53%), and BCNU (29% versus 38%). A substantial percentage of brain tumors overexpressed biomarkers associated with drug resistance, including MGMT (67%), GSTP1 (49%), and mutant p53 (41%). MGMT and GSTP1 overexpression was independently associated with in vitro resistance to BCNU, whereas coexpression of these two markers was associated with the greatest degree of BCNU resistance. | |||
|
Unusual Activation of Pro-survival Pathway (UAPP)
|
||||
| Key Molecule: Methylated-DNA--protein-cysteine methyltransferase (MGMT) | [2] | |||
| Resistant Disease | Malignant glioma [ICD-11: 2A00.2] | |||
| Molecule Alteration | Expression | Up-regulation |
||
| Experimental Note | Identified from the Human Clinical Data | |||
| In Vitro Model | Malignant gliomas tissue | N.A. | ||
| Experiment for Molecule Alteration |
Immunohistochemistry assay | |||
| Experiment for Drug Resistance |
EDR assay | |||
| Mechanism Description | In vitro drug resistance in malignant gliomas was independent of prior therapy. High-grade glioblastomas showed a lower level of extreme drug resistance than low-grade astrocytomas to cisplatin (11% versus 27%), temozolomide (14% versus 27%), irinotecan (33% versus 53%), and BCNU (29% versus 38%). A substantial percentage of brain tumors overexpressed biomarkers associated with drug resistance, including MGMT (67%), GSTP1 (49%), and mutant p53 (41%). MGMT and GSTP1 overexpression was independently associated with in vitro resistance to BCNU, whereas coexpression of these two markers was associated with the greatest degree of BCNU resistance. | |||
| Drug Resistance Data Categorized by Their Corresponding Mechanisms | ||||
|
Metabolic Reprogramming via Altered Pathways (MRAP)
|
||||
| Key Molecule: Glucose-6-phosphate dehydrogenase (G6PD) | [5] | |||
| Metabolic Type | Glucose metabolism | |||
| Resistant Disease | Pancreatic ductal adenocarcinoma [ICD-11: 2C10.0] | |||
| Molecule Alteration | Expression | Up-regulation |
||
| Differential expression of the molecule in resistant disease | ||||
| Classification of Disease | Pancreatic cancer [ICD-11: 2C10] | |||
| The Specified Disease | Pancreatic ductal adenocarcinoma | |||
| The Studied Tissue | Pancreas | |||
| The Expression Level of Disease Section Compare with the Healthy Individual Tissue | p-value: 3.01E-17 Fold-change: 4.09E-01 Z-score: 9.54E+00 |
|||
| Experimental Note | Revealed Based on the Cell Line Data | |||
| Cell Pathway Regulation | Adrenergic signaling in cardiomyocytes | Activation | hsa04261 | |
| In Vivo Model | Female SCID mice of 6-week-old, with fresh tissue from patient | Mice | ||
| Experiment for Molecule Alteration |
qRT-PCR; Western blot analysis | |||
| Experiment for Drug Resistance |
Tumor volume assay | |||
| Mechanism Description | Glucomet-PDACs are more resistant to chemotherapy than lipomet-PDACs, and patients with glucomet-PDAC have a worse prognosis. Integrated analyses reveal that the GLUT1/aldolase B (ALDOB)/glucose-6-phosphate dehydrogenase (G6PD) axis induces chemotherapy resistance by remodeling glucose metabolism in glucomet-PDAC. Increased glycolytic flux, G6PD activity, and pyrimidine biosynthesis are identified in glucomet-PDAC with high GLUT1 and low ALDOB expression, and these phenotypes could be reversed by inhibiting GLUT1 expression or by increasing ALDOB expression. | |||
| Key Molecule: Solute carrier family 2 member 1 (SLC2A1) | [5] | |||
| Metabolic Type | Glucose metabolism | |||
| Resistant Disease | Pancreatic ductal adenocarcinoma [ICD-11: 2C10.0] | |||
| Molecule Alteration | Expression | Up-regulation |
||
| Differential expression of the molecule in resistant disease | ||||
| Classification of Disease | Pancreatic cancer [ICD-11: 2C10] | |||
| The Specified Disease | Pancreatic ductal adenocarcinoma | |||
| The Studied Tissue | Pancreas | |||
| The Expression Level of Disease Section Compare with the Healthy Individual Tissue | p-value: 2.33E-08 Fold-change: 5.47E-01 Z-score: 5.83E+00 |
|||
| Experimental Note | Revealed Based on the Cell Line Data | |||
| Cell Pathway Regulation | Adrenergic signaling in cardiomyocytes | Activation | hsa04261 | |
| In Vivo Model | Female SCID mice of 4-week-old, with fresh tissue from patient | Mice | ||
| Experiment for Molecule Alteration |
qRT-PCR; Western blot analysis | |||
| Experiment for Drug Resistance |
Tumor volume assay | |||
| Mechanism Description | Glucomet-PDACs are more resistant to chemotherapy than lipomet-PDACs, and patients with glucomet-PDAC have a worse prognosis. Integrated analyses reveal that the GLUT1/aldolase B (ALDOB)/glucose-6-phosphate dehydrogenase (G6PD) axis induces chemotherapy resistance by remodeling glucose metabolism in glucomet-PDAC. Increased glycolytic flux, G6PD activity, and pyrimidine biosynthesis are identified in glucomet-PDAC with high GLUT1 and low ALDOB expression, and these phenotypes could be reversed by inhibiting GLUT1 expression or by increasing ALDOB expression. | |||
| Key Molecule: Glucose-6-phosphate dehydrogenase (G6PD) | [5] | |||
| Metabolic Type | Glucose metabolism | |||
| Resistant Disease | Pancreatic ductal adenocarcinoma [ICD-11: 2C10.0] | |||
| Molecule Alteration | Expression | Up-regulation |
||
| Differential expression of the molecule in resistant disease | ||||
| Classification of Disease | Pancreatic cancer [ICD-11: 2C10] | |||
| The Specified Disease | Pancreatic ductal adenocarcinoma | |||
| The Studied Tissue | Pancreas | |||
| The Expression Level of Disease Section Compare with the Healthy Individual Tissue | p-value: 3.01E-17 Fold-change: 4.09E-01 Z-score: 9.54E+00 |
|||
| Experimental Note | Identified from the Human Clinical Data | |||
| Cell Pathway Regulation | Adrenergic signaling in cardiomyocytes | Activation | hsa04261 | |
| In Vivo Model | HCC patients | Homo Sapiens | ||
| Experiment for Molecule Alteration |
qRT-PCR; Western blot analysis | |||
| Mechanism Description | Glucomet-PDACs are more resistant to chemotherapy than lipomet-PDACs, and patients with glucomet-PDAC have a worse prognosis. Integrated analyses reveal that the GLUT1/aldolase B (ALDOB)/glucose-6-phosphate dehydrogenase (G6PD) axis induces chemotherapy resistance by remodeling glucose metabolism in glucomet-PDAC. Increased glycolytic flux, G6PD activity, and pyrimidine biosynthesis are identified in glucomet-PDAC with high GLUT1 and low ALDOB expression, and these phenotypes could be reversed by inhibiting GLUT1 expression or by increasing ALDOB expression. | |||
| Key Molecule: Solute carrier family 2 member 1 (SLC2A1) | [5] | |||
| Metabolic Type | Glucose metabolism | |||
| Resistant Disease | Pancreatic ductal adenocarcinoma [ICD-11: 2C10.0] | |||
| Molecule Alteration | Expression | Up-regulation |
||
| Differential expression of the molecule in resistant disease | ||||
| Classification of Disease | Pancreatic cancer [ICD-11: 2C10] | |||
| The Specified Disease | Pancreatic ductal adenocarcinoma | |||
| The Studied Tissue | Pancreas | |||
| The Expression Level of Disease Section Compare with the Healthy Individual Tissue | p-value: 2.33E-08 Fold-change: 5.47E-01 Z-score: 5.83E+00 |
|||
| Experimental Note | Identified from the Human Clinical Data | |||
| Cell Pathway Regulation | Adrenergic signaling in cardiomyocytes | Activation | hsa04261 | |
| In Vivo Model | HCC patients | Homo Sapiens | ||
| Experiment for Molecule Alteration |
qRT-PCR; Western blot analysis | |||
| Mechanism Description | Glucomet-PDACs are more resistant to chemotherapy than lipomet-PDACs, and patients with glucomet-PDAC have a worse prognosis. Integrated analyses reveal that the GLUT1/aldolase B (ALDOB)/glucose-6-phosphate dehydrogenase (G6PD) axis induces chemotherapy resistance by remodeling glucose metabolism in glucomet-PDAC. Increased glycolytic flux, G6PD activity, and pyrimidine biosynthesis are identified in glucomet-PDAC with high GLUT1 and low ALDOB expression, and these phenotypes could be reversed by inhibiting GLUT1 expression or by increasing ALDOB expression. | |||
| Key Molecule: Aldolase B, fructose-bisphosphate (ALDOB) | [5] | |||
| Metabolic Type | Glucose metabolism | |||
| Resistant Disease | Pancreatic ductal adenocarcinoma [ICD-11: 2C10.0] | |||
| Molecule Alteration | Expression | Down-regulation |
||
| Experimental Note | Revealed Based on the Cell Line Data | |||
| Cell Pathway Regulation | Adrenergic signaling in cardiomyocytes | Activation | hsa04261 | |
| In Vivo Model | Female SCID mice of 5-week-old, with fresh tissue from patient | Mice | ||
| Experiment for Molecule Alteration |
qRT-PCR; Western blot analysis | |||
| Experiment for Drug Resistance |
Tumor volume assay | |||
| Mechanism Description | Glucomet-PDACs are more resistant to chemotherapy than lipomet-PDACs, and patients with glucomet-PDAC have a worse prognosis. Integrated analyses reveal that the GLUT1/aldolase B (ALDOB)/glucose-6-phosphate dehydrogenase (G6PD) axis induces chemotherapy resistance by remodeling glucose metabolism in glucomet-PDAC. Increased glycolytic flux, G6PD activity, and pyrimidine biosynthesis are identified in glucomet-PDAC with high GLUT1 and low ALDOB expression, and these phenotypes could be reversed by inhibiting GLUT1 expression or by increasing ALDOB expression. | |||
| Drug Resistance Data Categorized by Their Corresponding Mechanisms | ||||
|
Epigenetic Alteration of DNA, RNA or Protein (EADR)
|
||||
| Key Molecule: TP53 target 1 (TP53TG1) | [1] | |||
| Resistant Disease | Solid tumour/cancer [ICD-11: 2A00-2F9Z] | |||
| Molecule Alteration | Expression | Down-regulation |
||
| Experimental Note | Revealed Based on the Cell Line Data | |||
| Cell Pathway Regulation | p53 signaling pathway | Inhibition | hsa04115 | |
| In Vitro Model | HCT116 cells | Colon | Homo sapiens (Human) | CVCL_0291 |
| MkN-45 cells | Gastric | Homo sapiens (Human) | CVCL_0434 | |
| GCIY cells | Gastric | Homo sapiens (Human) | CVCL_1228 | |
| KATO-3 cells | Gastric | Homo sapiens (Human) | CVCL_0371 | |
| MkN-7 cells | Gastric | Homo sapiens (Human) | CVCL_1417 | |
| SNU-1 cells | Gastric | Homo sapiens (Human) | CVCL_0099 | |
| TGBC11TkB cells | Gastric | Homo sapiens (Human) | CVCL_1768 | |
| In Vivo Model | Nude mouse xenograft model | Mus musculus | ||
| Experiment for Molecule Alteration |
qPCR | |||
| Experiment for Drug Resistance |
MTT assay; TUNEL assay; xCELLigence Real-Time invasion and migration assays | |||
| Mechanism Description | TP53TG1, a p53-induced LncRNA, binds to the multifaceted RNA/RNA binding protein YBX1 to prevent its nuclear localization and thus the YBX1-mediated activation of oncogenes. The epigenetic silencing of TP53TG1 in cancer cells promotes the YBX1-mediated activation of the PI3k/AkT pathway, which then creates further resistance not only to common chemotherapy RNA-damaging agents but also to small drug-targeted inhibitors. | |||
|
Unusual Activation of Pro-survival Pathway (UAPP)
|
||||
| Key Molecule: Y-box-binding protein 1 (YBX1) | [1] | |||
| Resistant Disease | Solid tumour/cancer [ICD-11: 2A00-2F9Z] | |||
| Molecule Alteration | Expression | Up-regulation |
||
| Experimental Note | Revealed Based on the Cell Line Data | |||
| Cell Pathway Regulation | p53 signaling pathway | Inhibition | hsa04115 | |
| In Vitro Model | HCT116 cells | Colon | Homo sapiens (Human) | CVCL_0291 |
| MkN-45 cells | Gastric | Homo sapiens (Human) | CVCL_0434 | |
| GCIY cells | Gastric | Homo sapiens (Human) | CVCL_1228 | |
| KATO-3 cells | Gastric | Homo sapiens (Human) | CVCL_0371 | |
| MkN-7 cells | Gastric | Homo sapiens (Human) | CVCL_1417 | |
| SNU-1 cells | Gastric | Homo sapiens (Human) | CVCL_0099 | |
| TGBC11TkB cells | Gastric | Homo sapiens (Human) | CVCL_1768 | |
| In Vivo Model | Nude mouse xenograft model | Mus musculus | ||
| Experiment for Molecule Alteration |
Western blot analysis | |||
| Experiment for Drug Resistance |
MTT assay; TUNEL assay; xCELLigence Real-Time invasion and migration assays | |||
| Mechanism Description | TP53TG1, a p53-induced LncRNA, binds to the multifaceted RNA/RNA binding protein YBX1 to prevent its nuclear localization and thus the YBX1-mediated activation of oncogenes. The epigenetic silencing of TP53TG1 in cancer cells promotes the YBX1-mediated activation of the PI3k/AkT pathway, which then creates further resistance not only to common chemotherapy RNA-damaging agents but also to small drug-targeted inhibitors. | |||
| Drug Resistance Data Categorized by Their Corresponding Mechanisms | ||||
|
Unusual Activation of Pro-survival Pathway (UAPP)
|
||||
| Key Molecule: Ubiquitin-like protein ISG15 (ISG15) | [3] | |||
| Resistant Disease | Colon cancer [ICD-11: 2B90.1] | |||
| Molecule Alteration | Expression | Activation |
||
| Experimental Note | Revealed Based on the Cell Line Data | |||
| Cell Pathway Regulation | NF+kB signaling pathway | Activation | hsa04218 | |
| In Vitro Model | DLD-1 cells | Colon | Homo sapiens (Human) | CVCL_0248 |
| SW-480 cells | Colon | Homo sapiens (Human) | CVCL_0546 | |
| RkO cells | Colon | Homo sapiens (Human) | CVCL_0504 | |
| Experiment for Molecule Alteration |
Immunoblotting assay; qRT-PCR; Immunofluorescence staining assay; Reporter Gene assay; RNA sequencing assay | |||
| Experiment for Drug Resistance |
Cell cytotoxicity assay; Tumorigenicity assay | |||
| Mechanism Description | Our data suggest that irinotecan upregulates various oncogenes, proliferative pathways, and metastatic markers, which may compromise its efficacy. SN38 induces p53-independent CDKIs and regulates cancer cell growth. OPN silencing regulates the SN38-mediated increase in PD-L1. Inhibition of non-canonical NF-kappaB signaling by QNZ results in the regulation of SN38-induced survivin and ISG15 (Figure 7). The targeting of OPN, PD-L1, ISG15, and NF-kappaB pathways may elevate irinotecan potency and lead to its combination with immunomodulatory therapies for CRC prognostic strategies. | |||
| Key Molecule: Programmed cell death 1 ligand 1 (PD-L1) | [3] | |||
| Resistant Disease | Colon cancer [ICD-11: 2B90.1] | |||
| Molecule Alteration | Expression | Up-regulation |
||
| Experimental Note | Revealed Based on the Cell Line Data | |||
| Cell Pathway Regulation | NF+kB signaling pathway | Activation | hsa04218 | |
| In Vitro Model | DLD-1 cells | Colon | Homo sapiens (Human) | CVCL_0248 |
| SW-480 cells | Colon | Homo sapiens (Human) | CVCL_0546 | |
| RkO cells | Colon | Homo sapiens (Human) | CVCL_0504 | |
| Experiment for Molecule Alteration |
Immunoblotting assay; qRT-PCR; Immunofluorescence staining assay; Reporter Gene assay; RNA sequencing assay | |||
| Experiment for Drug Resistance |
Cell cytotoxicity assay; Tumorigenicity assay | |||
| Mechanism Description | Our data suggest that irinotecan upregulates various oncogenes, proliferative pathways, and metastatic markers, which may compromise its efficacy. SN38 induces p53-independent CDKIs and regulates cancer cell growth. OPN silencing regulates the SN38-mediated increase in PD-L1. Inhibition of non-canonical NF-kappaB signaling by QNZ results in the regulation of SN38-induced survivin and ISG15 (Figure 7). The targeting of OPN, PD-L1, ISG15, and NF-kappaB pathways may elevate irinotecan potency and lead to its combination with immunomodulatory therapies for CRC prognostic strategies. | |||
| Key Molecule: Osteopontin (OPN) | [3] | |||
| Resistant Disease | Colon cancer [ICD-11: 2B90.1] | |||
| Molecule Alteration | Expression | Up-regulation |
||
| Experimental Note | Revealed Based on the Cell Line Data | |||
| Cell Pathway Regulation | NF+kB signaling pathway | Activation | hsa04218 | |
| In Vitro Model | DLD-1 cells | Colon | Homo sapiens (Human) | CVCL_0248 |
| SW-480 cells | Colon | Homo sapiens (Human) | CVCL_0546 | |
| RkO cells | Colon | Homo sapiens (Human) | CVCL_0504 | |
| Experiment for Molecule Alteration |
Immunoblotting assay; qRT-PCR; Immunofluorescence staining assay; Reporter Gene assay; RNA sequencing assay | |||
| Experiment for Drug Resistance |
Cell cytotoxicity assay; Tumorigenicity assay | |||
| Mechanism Description | Our data suggest that irinotecan upregulates various oncogenes, proliferative pathways, and metastatic markers, which may compromise its efficacy. SN38 induces p53-independent CDKIs and regulates cancer cell growth. OPN silencing regulates the SN38-mediated increase in PD-L1. Inhibition of non-canonical NF-kappaB signaling by QNZ results in the regulation of SN38-induced survivin and ISG15 (Figure 7). The targeting of OPN, PD-L1, ISG15, and NF-kappaB pathways may elevate irinotecan potency and lead to its combination with immunomodulatory therapies for CRC prognostic strategies. | |||
| Key Molecule: Nuclear factor kappa-light-chain-enhancer of activated B cells (NF-kappaB) | [3] | |||
| Resistant Disease | Colon cancer [ICD-11: 2B90.1] | |||
| Molecule Alteration | Function | Up-regulation |
||
| Experimental Note | Revealed Based on the Cell Line Data | |||
| Cell Pathway Regulation | NF+kB signaling pathway | Activation | hsa04218 | |
| In Vitro Model | DLD-1 cells | Colon | Homo sapiens (Human) | CVCL_0248 |
| SW-480 cells | Colon | Homo sapiens (Human) | CVCL_0546 | |
| RkO cells | Colon | Homo sapiens (Human) | CVCL_0504 | |
| Experiment for Molecule Alteration |
Immunoblotting assay; qRT-PCR; Immunofluorescence staining assay; Reporter Gene assay; RNA sequencing assay | |||
| Experiment for Drug Resistance |
Cell cytotoxicity assay; Tumorigenicity assay | |||
| Mechanism Description | Our data suggest that irinotecan upregulates various oncogenes, proliferative pathways, and metastatic markers, which may compromise its efficacy. SN38 induces p53-independent CDKIs and regulates cancer cell growth. OPN silencing regulates the SN38-mediated increase in PD-L1. Inhibition of non-canonical NF-kappaB signaling by QNZ results in the regulation of SN38-induced survivin and ISG15 (Figure 7). The targeting of OPN, PD-L1, ISG15, and NF-kappaB pathways may elevate irinotecan potency and lead to its combination with immunomodulatory therapies for CRC prognostic strategies. | |||
| Drug Sensitivity Data Categorized by Their Corresponding Mechanisms | ||||
|
Unusual Activation of Pro-survival Pathway (UAPP)
|
||||
| Key Molecule: BCL2 associated X protein (BAX) | [3] | |||
| Sensitive Disease | Colon cancer [ICD-11: 2B90.1] | |||
| Molecule Alteration | Expression | Up-regulation |
||
| Experimental Note | Revealed Based on the Cell Line Data | |||
| Cell Pathway Regulation | p53 signaling pathway | Activation | hsa04115 | |
| In Vitro Model | DLD-1 cells | Colon | Homo sapiens (Human) | CVCL_0248 |
| SW-480 cells | Colon | Homo sapiens (Human) | CVCL_0546 | |
| RkO cells | Colon | Homo sapiens (Human) | CVCL_0504 | |
| Experiment for Molecule Alteration |
Immunoblotting assay; qRT-PCR; Immunofluorescence staining assay; Reporter Gene assay; RNA sequencing assay | |||
| Experiment for Drug Resistance |
Cell cytotoxicity assay; Tumorigenicity assay | |||
| Mechanism Description | Our data suggest that irinotecan upregulates various oncogenes, proliferative pathways, and metastatic markers, which may compromise its efficacy. SN38 induces p53-independent CDKIs and regulates cancer cell growth. OPN silencing regulates the SN38-mediated increase in PD-L1. Inhibition of non-canonical NF-kappaB signaling by QNZ results in the regulation of SN38-induced survivin and ISG15 (Figure 7). The targeting of OPN, PD-L1, ISG15, and NF-kappaB pathways may elevate irinotecan potency and lead to its combination with immunomodulatory therapies for CRC prognostic strategies. | |||
| Drug Resistance Data Categorized by Their Corresponding Mechanisms | ||||
|
Drug Inactivation by Structure Modification (DISM)
|
||||
| Key Molecule: Cocaine esterase (CES2) | [6] | |||
| Resistant Disease | Colorectal cancer [ICD-11: 2B91.1] | |||
| Molecule Alteration | Expression | Down-regulation |
||
| Experimental Note | Identified from the Human Clinical Data | |||
| In Vitro Model | CaCo2 cells | Colon | Homo sapiens (Human) | CVCL_0025 |
| IPS cells | Colon | Homo sapiens (Human) | N.A. | |
| Experiment for Molecule Alteration |
qPCR | |||
| Experiment for Drug Resistance |
Transcellular transport study assay | |||
| Mechanism Description | The extraction ratio of metabolism of irinotecan (a CES2 substrate) to SN-38 in hiPSC-IECs was 3.52 +/- 0.15 (%) and decreased to 2.42 +/- 0.17 (%) in the presence of 100 uM telmisartan (a CES2 inhibitor). The extraction ratio in Caco-2 cells was 3.96 +/- 0.55 (%) and also decreased to 2.30 +/- 0.30 (%) in the presence of 100 uM telmisartan. | |||
|
Epigenetic Alteration of DNA, RNA or Protein (EADR)
|
||||
| Key Molecule: hsa-miR-17-5p | [4] | |||
| Resistant Disease | Colorectal cancer [ICD-11: 2B91.1] | |||
| Molecule Alteration | Expression | Up-regulation |
||
| Experimental Note | Identified from the Human Clinical Data | |||
| Cell Pathway Regulation | Cell apoptosis | Inhibition | hsa04210 | |
| Cell invasion | Activation | hsa05200 | ||
| Cell migration | Activation | hsa04670 | ||
| Cell proliferation | Activation | hsa05200 | ||
| PTEN/AKT/PI3K signaling pathway | Activation | hsa05235 | ||
| In Vitro Model | SW480 cells | Colon | Homo sapiens (Human) | CVCL_0546 |
| COLO205 cells | Colon | Homo sapiens (Human) | CVCL_F402 | |
| In Vivo Model | Nude mouse xenograft model | Mus musculus | ||
| Experiment for Molecule Alteration |
qRT-PCR | |||
| Experiment for Drug Resistance |
MTT assay; Flow cytometry assay | |||
| Mechanism Description | The expression level of miRNA-17-5p was found increased in chemoresistant patients. Significantly higher expression levels of miR-17-5p were found in CRC patients with distant metastases and higher clinical stages. kaplan-Meier analysis showed that CRC patients with higher levels of miR-17-5p had reduced survival, especially in patients who had previously received chemotherapy. Overexpression of miR-17-5p promoted COLO205 cell invasiveness. PTEN was a target of miR-17-5p in the colon cancer cells, and their context-specific interactions were responsible for multiple drug-resistance. Chemotherapy was found to increase the expression levels of miR-17-5p, which further repressed PTEN levels, contributing to the development of chemo-resistance. | |||
| Key Molecule: hsa-miR-17 | [7] | |||
| Resistant Disease | Colorectal cancer [ICD-11: 2B91.1] | |||
| Molecule Alteration | Expression | Down-regulation |
||
| Experimental Note | Identified from the Human Clinical Data | |||
| In Vitro Model | Colorectal cancer cells | Colon | Homo sapiens (Human) | N.A. |
| In Vivo Model | Colorectal cancer patients blood samples | Homo sapiens | ||
| Experiment for Molecule Alteration |
RT-PCR | |||
| Mechanism Description | Of note, Despotovic et al. suggested that miR-17-5p could serve as a candidate biomarker via the regulation of the TGF-beta Signaling pathway for monitoring the response to FOLFIRI in mCRC patients. | |||
|
Unusual Activation of Pro-survival Pathway (UAPP)
|
||||
| Key Molecule: Phosphatase and tensin homolog (PTEN) | [4] | |||
| Resistant Disease | Colorectal cancer [ICD-11: 2B91.1] | |||
| Molecule Alteration | Expression | Down-regulation |
||
| Experimental Note | Identified from the Human Clinical Data | |||
| Cell Pathway Regulation | Cell apoptosis | Inhibition | hsa04210 | |
| Cell invasion | Activation | hsa05200 | ||
| Cell migration | Activation | hsa04670 | ||
| Cell proliferation | Activation | hsa05200 | ||
| PTEN/AKT/PI3K signaling pathway | Activation | hsa05235 | ||
| In Vitro Model | SW480 cells | Colon | Homo sapiens (Human) | CVCL_0546 |
| COLO205 cells | Colon | Homo sapiens (Human) | CVCL_F402 | |
| Experiment for Molecule Alteration |
Western blot analysis | |||
| Experiment for Drug Resistance |
MTT assay; Flow cytometry assay | |||
| Mechanism Description | The expression level of miRNA-17-5p was found increased in chemoresistant patients. Significantly higher expression levels of miR-17-5p were found in CRC patients with distant metastases and higher clinical stages. kaplan-Meier analysis showed that CRC patients with higher levels of miR-17-5p had reduced survival, especially in patients who had previously received chemotherapy. Overexpression of miR-17-5p promoted COLO205 cell invasiveness. PTEN was a target of miR-17-5p in the colon cancer cells, and their context-specific interactions were responsible for multiple drug-resistance. Chemotherapy was found to increase the expression levels of miR-17-5p, which further repressed PTEN levels, contributing to the development of chemo-resistance. | |||
| Drug Sensitivity Data Categorized by Their Corresponding Mechanisms | ||||
|
Epigenetic Alteration of DNA, RNA or Protein (EADR)
|
||||
| Key Molecule: hsa-mir-451 | [8] | |||
| Sensitive Disease | Colorectal cancer [ICD-11: 2B91.1] | |||
| Molecule Alteration | Expression | Up-regulation |
||
| Experimental Note | Identified from the Human Clinical Data | |||
| Cell Pathway Regulation | Sphere tumorogenicity | Inhibition | hsa04140 | |
| Wnt signaling pathway | Inhibition | hsa04310 | ||
| In Vitro Model | HT29 Cells | Colon | Homo sapiens (Human) | CVCL_A8EZ |
| DLD1 cells | Colon | Homo sapiens (Human) | CVCL_0248 | |
| SW620 cells | Colon | Homo sapiens (Human) | CVCL_0547 | |
| LOVO cells | Colon | Homo sapiens (Human) | CVCL_0399 | |
| RkO cells | Colon | Homo sapiens (Human) | CVCL_0504 | |
| LS513 cells | Colon | Homo sapiens (Human) | CVCL_1386 | |
| In Vivo Model | BALB/c nude mouse xenograft model | Mus musculus | ||
| Experiment for Molecule Alteration |
qRT-PCR | |||
| Experiment for Drug Resistance |
MTS assay | |||
| Mechanism Description | COX-2 allows Wnt activation, which is essential for CSC growth, the decrease of colorectal CSC formation and growth could result from miR-451-mediated downregulation of cyclooxygenase-2 (COX-2) and Wnt pathway. | |||
|
Unusual Activation of Pro-survival Pathway (UAPP)
|
||||
| Key Molecule: Prostaglandin G/H synthase 2 (PTGS2) | [8] | |||
| Sensitive Disease | Colorectal cancer [ICD-11: 2B91.1] | |||
| Molecule Alteration | Expression | Down-regulation |
||
| Experimental Note | Identified from the Human Clinical Data | |||
| Cell Pathway Regulation | Sphere tumorogenicity | Inhibition | hsa04140 | |
| Wnt signaling pathway | Inhibition | hsa04310 | ||
| In Vitro Model | HT29 Cells | Colon | Homo sapiens (Human) | CVCL_A8EZ |
| DLD1 cells | Colon | Homo sapiens (Human) | CVCL_0248 | |
| SW620 cells | Colon | Homo sapiens (Human) | CVCL_0547 | |
| LOVO cells | Colon | Homo sapiens (Human) | CVCL_0399 | |
| RkO cells | Colon | Homo sapiens (Human) | CVCL_0504 | |
| LS513 cells | Colon | Homo sapiens (Human) | CVCL_1386 | |
| In Vivo Model | BALB/c nude mouse xenograft model | Mus musculus | ||
| Experiment for Molecule Alteration |
Western blot analysis | |||
| Experiment for Drug Resistance |
MTS assay | |||
| Mechanism Description | COX-2 allows Wnt activation, which is essential for CSC growth, the decrease of colorectal CSC formation and growth could result from miR-451-mediated downregulation of cyclooxygenase-2 (COX-2) and Wnt pathway. | |||
References
If you find any error in data or bug in web service, please kindly report it to Dr. Sun and Dr. Yu.