Molecule Information
General Information of the Molecule (ID: Mol00037)
| Name |
Caspase-9 (CASP9)
,Homo sapiens
|
||||
|---|---|---|---|---|---|
| Synonyms |
CASP-9; Apoptotic protease Mch-6; Apoptotic protease-activating factor 3; APAF-3; ICE-like apoptotic protease 6; ICE-LAP6; MCH6
Click to Show/Hide
|
||||
| Molecule Type |
Protein
|
||||
| Gene Name |
CASP9
|
||||
| Gene ID | |||||
| Location |
chr1:15490832-15526534[-]
|
||||
| Sequence |
MDEADRRLLRRCRLRLVEELQVDQLWDALLSRELFRPHMIEDIQRAGSGSRRDQARQLII
DLETRGSQALPLFISCLEDTGQDMLASFLRTNRQAAKLSKPTLENLTPVVLRPEIRKPEV LRPETPRPVDIGSGGFGDVGALESLRGNADLAYILSMEPCGHCLIINNVNFCRESGLRTR TGSNIDCEKLRRRFSSLHFMVEVKGDLTAKKMVLALLELAQQDHGALDCCVVVILSHGCQ ASHLQFPGAVYGTDGCPVSVEKIVNIFNGTSCPSLGGKPKLFFIQACGGEQKDHGFEVAS TSPEDESPGSNPEPDATPFQEGLRTFDQLDAISSLPTPSDIFVSYSTFPGFVSWRDPKSG SWYVETLDDIFEQWAHSEDLQSLLLRVANAVSVKGIYKQMPGCFNFLRKKLFFKTS Click to Show/Hide
|
||||
| 3D-structure |
|
||||
| Function |
Involved in the activation cascade of caspases responsible for apoptosis execution. Binding of caspase-9 to Apaf-1 leads to activation of the protease which then cleaves and activates caspase-3. Promotes DNA damage-induced apoptosis in a ABL1/c-Abl-dependent manner. Proteolytically cleaves poly(ADP-ribose) polymerase (PARP).; FUNCTION: Isoform 2 lacks activity is an dominant-negative inhibitor of caspase-9.
Click to Show/Hide
|
||||
| Uniprot ID | |||||
| Ensembl ID | |||||
| HGNC ID | |||||
| Click to Show/Hide the Complete Species Lineage | |||||
Type(s) of Resistant Mechanism of This Molecule
 UAPP: Unusual Activation of Pro-survival Pathway
Drug Resistance Data Categorized by Drug
Approved Drug(s)
3 drug(s) in total
| Drug Sensitivity Data Categorized by Their Corresponding Mechanisms | ||||
|
Unusual Activation of Pro-survival Pathway (UAPP)
|
||||
| Disease Class: Non-small cell lung cancer [ICD-11: 2C25.Y] | [1] | |||
| Sensitive Disease | Non-small cell lung cancer [ICD-11: 2C25.Y] | |||
| Sensitive Drug | Cisplatin | |||
| Molecule Alteration | Expression | Up-regulation |
||
| Differential expression of the molecule in resistant disease | ||||
| Classification of Disease | Lung cancer [ICD-11: 2C25] | |||
| The Specified Disease | Lung cancer | |||
| The Studied Tissue | Lung tissue | |||
| The Expression Level of Disease Section Compare with the Healthy Individual Tissue | p-value: 6.38E-01 Fold-change: 2.75E-03 Z-score: 4.71E-01 |
|||
| Experimental Note | Revealed Based on the Cell Line Data | |||
| Cell Pathway Regulation | Cell apoptosis | Activation | hsa04210 | |
| In Vitro Model | A549 cells | Lung | Homo sapiens (Human) | CVCL_0023 |
| Sk-MES-1 cells | Lung | Homo sapiens (Human) | CVCL_0630 | |
| Experiment for Molecule Alteration |
Western blot analysis | |||
| Experiment for Drug Resistance |
CCK8 assay | |||
| Mechanism Description | Down-regulation of miR-21 inhibited growth, colony formation, antiapoptotic Bcl-2 expression and promoted proapoptotic Bax and caspase-9 expression in A549 cells treated with DDP. Upregulation of miR-21 promoted growth and colony formation in Sk-MES-1 cells treated with DDP. Furthermore, downregulation of miR-21 reduced growth of implanted tumors, suggesting that miR-21 inhibition could enhance the sensitivity of A549 cells to DDP in vivo. These data suggest an appropriate combination of DDP and miR-21 regulation might be a potential approach to lung cancer therapy. Combined DDP application with miR-21 downregulation for the treatment of lung cancer would help achieve effective treatment and reduce DDP side effects. | |||
| Drug Resistance Data Categorized by Their Corresponding Mechanisms | ||||
|
Unusual Activation of Pro-survival Pathway (UAPP)
|
||||
| Disease Class: Breast cancer [ICD-11: 2C60.3] | [2] | |||
| Resistant Disease | Breast cancer [ICD-11: 2C60.3] | |||
| Resistant Drug | Fluorouracil | |||
| Molecule Alteration | Expression | Down-regulation |
||
| Differential expression of the molecule in resistant disease | ||||
| Classification of Disease | Breast cancer [ICD-11: 2C60] | |||
| The Specified Disease | Breast cancer | |||
| The Studied Tissue | Breast tissue | |||
| The Expression Level of Disease Section Compare with the Healthy Individual Tissue | p-value: 1.78E-02 Fold-change: -1.19E-02 Z-score: -2.38E+00 |
|||
| Experimental Note | Revealed Based on the Cell Line Data | |||
| Cell Pathway Regulation | Cell apoptosis | Inhibition | hsa04210 | |
| Cell invasion | Activation | hsa05200 | ||
| Cell migration | Activation | hsa04670 | ||
| Epithelial mesenchymal transition signaling pathway | Activation | hsa01521 | ||
| In Vitro Model | MCF-7 cells | Breast | Homo sapiens (Human) | CVCL_0031 |
| MDA-MB-231 cells | Breast | Homo sapiens (Human) | CVCL_0062 | |
| MDA-MB-468 cells | Breast | Homo sapiens (Human) | CVCL_0419 | |
| Experiment for Molecule Alteration |
Western blot analysis; TUNEL assay | |||
| Experiment for Drug Resistance |
MTT assay | |||
| Mechanism Description | Long noncoding RNA LINP1 acts as an oncogene and promotes chemoresistance against 5-fluoroutacil and doxorubicin by inhibiting chemotherapeutics-induced apoptosis (apoptosis-related proteins such as caspase-8, caspase-9 and Bax proteins) in breast cancer. | |||
| Drug Resistance Data Categorized by Their Corresponding Mechanisms | ||||
|
Unusual Activation of Pro-survival Pathway (UAPP)
|
||||
| Disease Class: Breast cancer [ICD-11: 2C60.3] | [2] | |||
| Resistant Disease | Breast cancer [ICD-11: 2C60.3] | |||
| Resistant Drug | Doxorubicin | |||
| Molecule Alteration | Expression | Down-regulation |
||
| Experimental Note | Revealed Based on the Cell Line Data | |||
| Cell Pathway Regulation | Cell apoptosis | Inhibition | hsa04210 | |
| Cell invasion | Activation | hsa05200 | ||
| Cell migration | Activation | hsa04670 | ||
| Epithelial mesenchymal transition signaling pathway | Activation | hsa01521 | ||
| In Vitro Model | MCF-7 cells | Breast | Homo sapiens (Human) | CVCL_0031 |
| MDA-MB-231 cells | Breast | Homo sapiens (Human) | CVCL_0062 | |
| MDA-MB-468 cells | Breast | Homo sapiens (Human) | CVCL_0419 | |
| Experiment for Molecule Alteration |
Western blot analysis; TUNEL assay | |||
| Experiment for Drug Resistance |
MTT assay | |||
| Mechanism Description | Long noncoding RNA LINP1 acts as an oncogene and promotes chemoresistance against 5-fluoroutacil and doxorubicin by inhibiting chemotherapeutics-induced apoptosis (apoptosis-related proteins such as caspase-8, caspase-9 and Bax proteins) in breast cancer. | |||
Disease- and Tissue-specific Abundances of This Molecule
ICD Disease Classification 02

| Differential expression of molecule in resistant diseases | ||
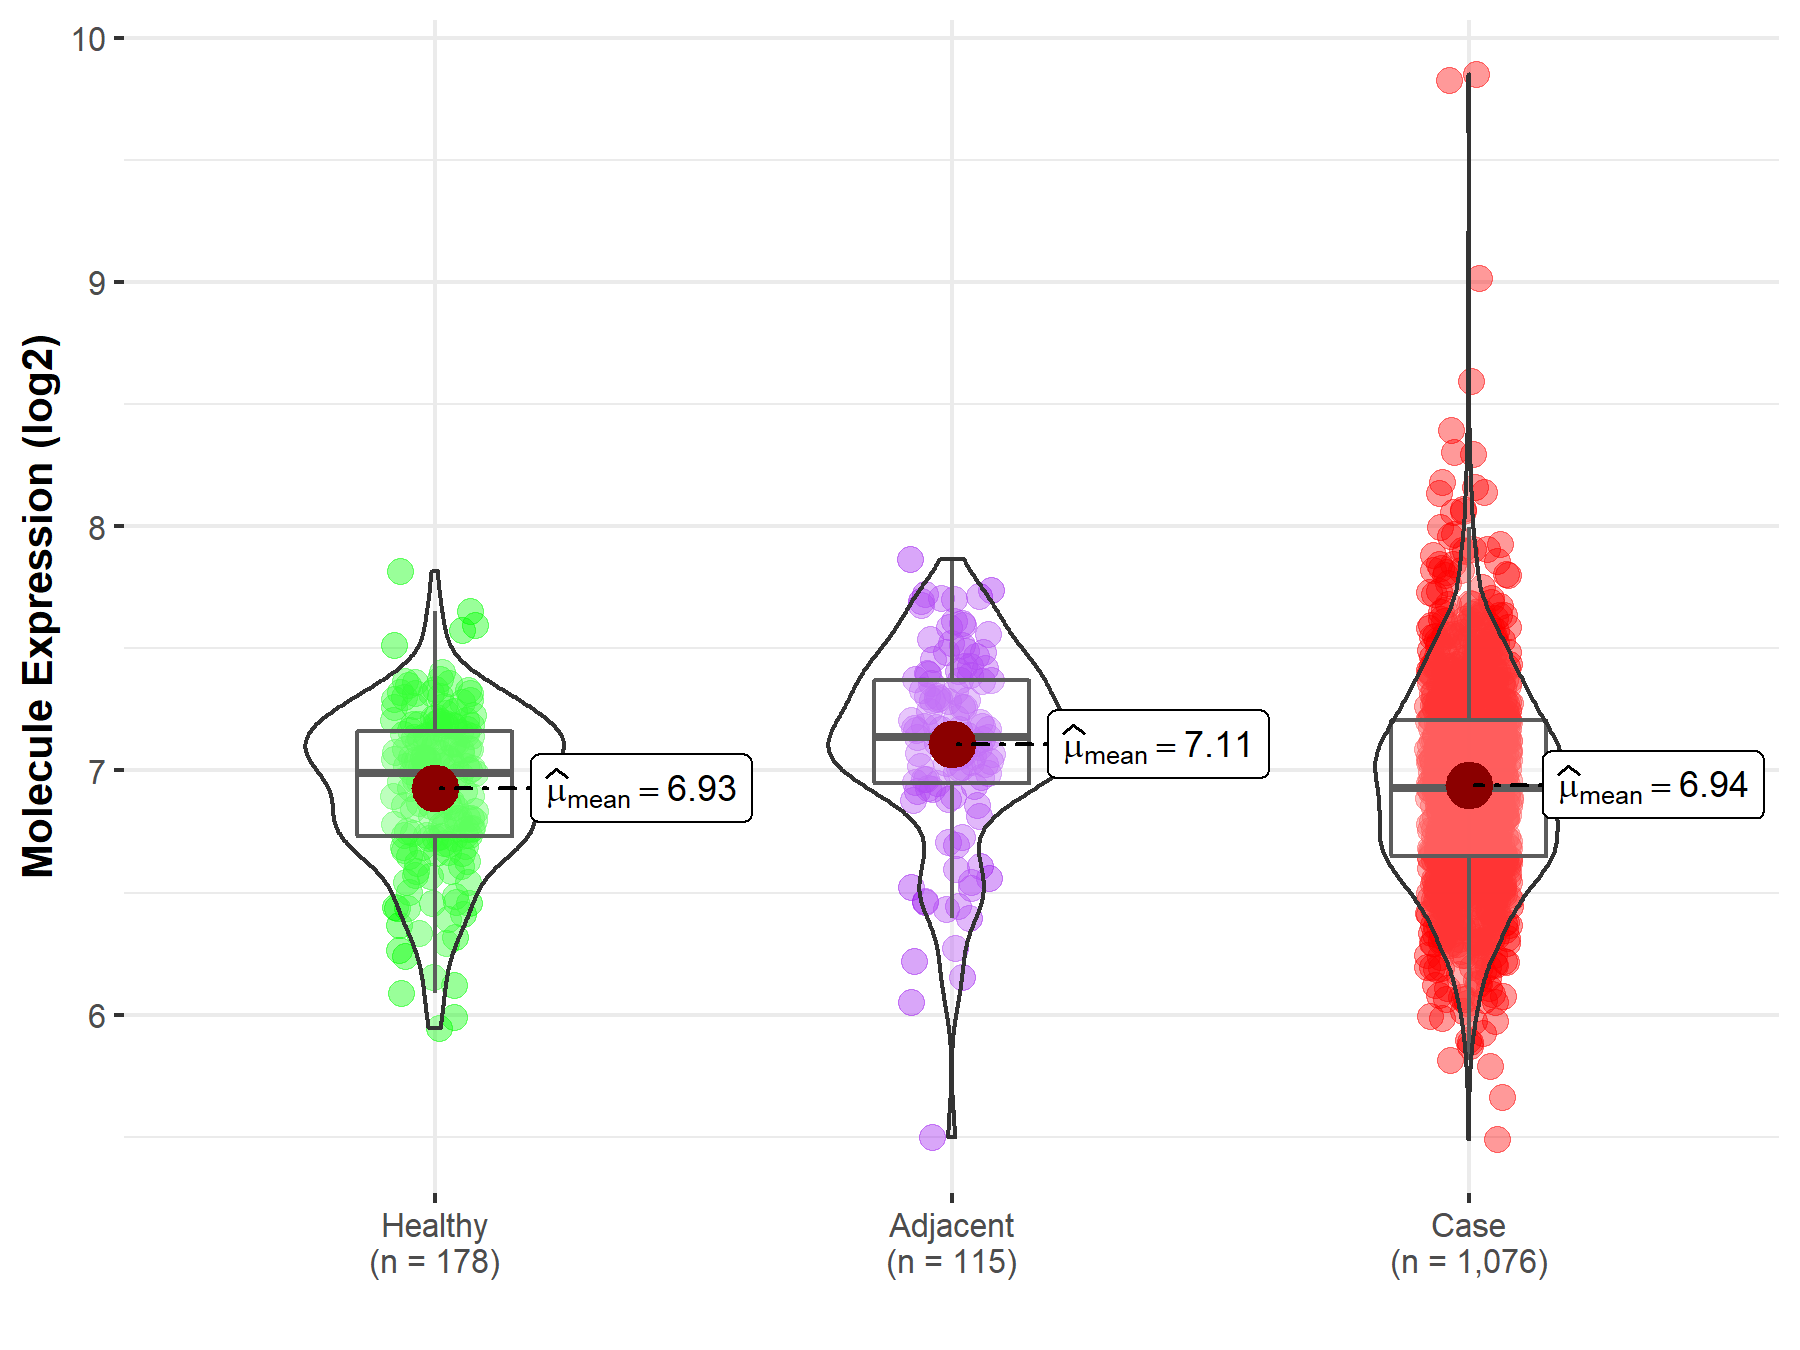
| The Studied Tissue | Lung | |
| The Specified Disease | Lung cancer | |
| The Expression Level of Disease Section Compare with the Healthy Individual Tissue | p-value: 6.38E-01; Fold-change: -5.80E-02; Z-score: -1.77E-01 | |
| The Expression Level of Disease Section Compare with the Adjacent Tissue | p-value: 4.45E-05; Fold-change: -2.06E-01; Z-score: -5.15E-01 | |
|
Molecule expression in the normal tissue adjacent to the diseased tissue of patients
Molecule expression in the diseased tissue of patients
Molecule expression in the normal tissue of healthy individuals
|
||
| Disease-specific Molecule Abundances |
|
Click to View the Clearer Original Diagram |
| Differential expression of molecule in resistant diseases | ||
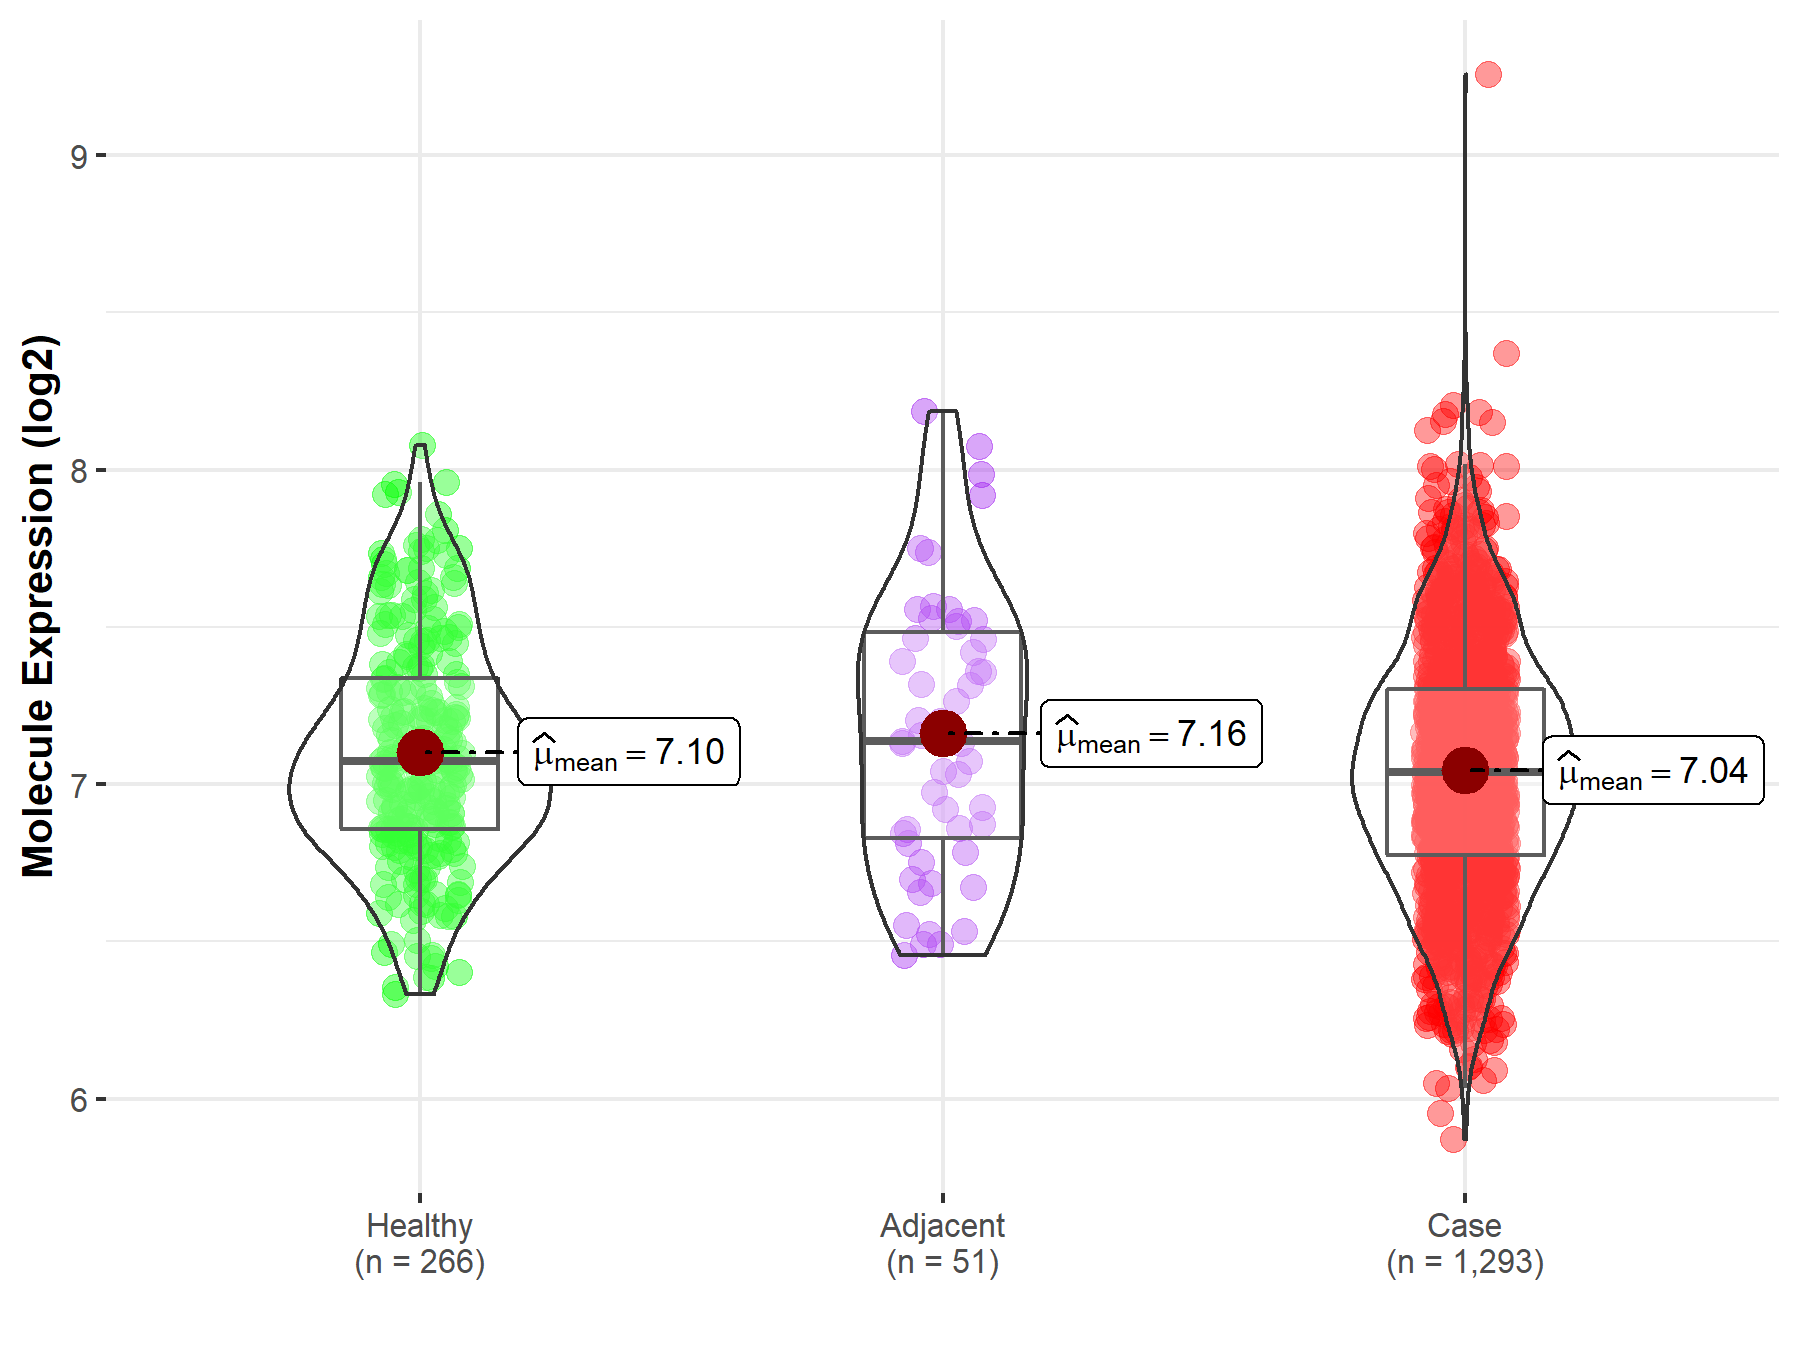
| The Studied Tissue | Breast tissue | |
| The Specified Disease | Breast cancer | |
| The Expression Level of Disease Section Compare with the Healthy Individual Tissue | p-value: 1.78E-02; Fold-change: -3.38E-02; Z-score: -9.44E-02 | |
| The Expression Level of Disease Section Compare with the Adjacent Tissue | p-value: 6.74E-02; Fold-change: -9.88E-02; Z-score: -2.24E-01 | |
|
Molecule expression in the normal tissue adjacent to the diseased tissue of patients
Molecule expression in the diseased tissue of patients
Molecule expression in the normal tissue of healthy individuals
|
||
| Disease-specific Molecule Abundances |
|
Click to View the Clearer Original Diagram |
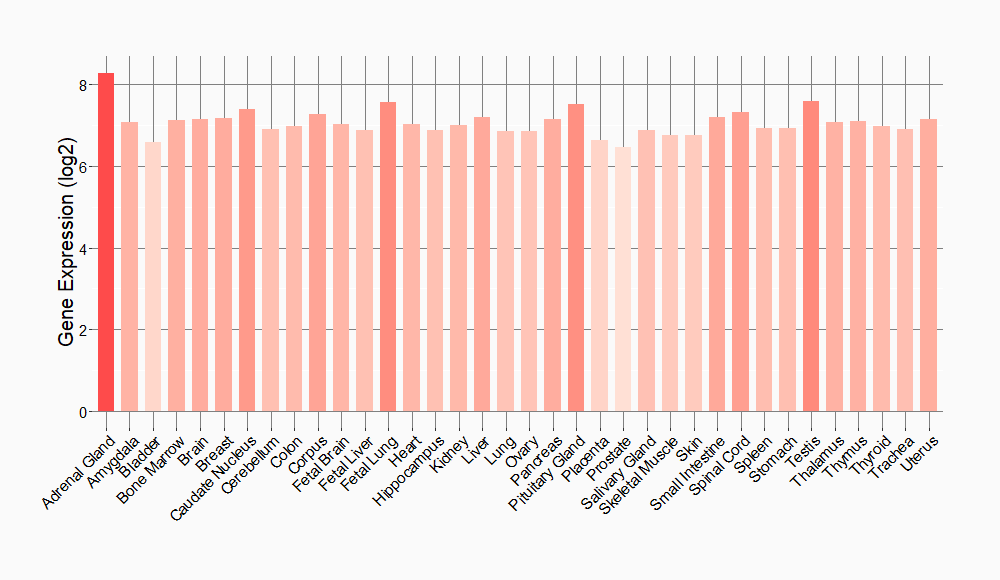
Tissue-specific Molecule Abundances in Healthy Individuals

|
||
References
If you find any error in data or bug in web service, please kindly report it to Dr. Sun and Dr. Yu.