Drug Information
Drug (ID: DG00618) and It's Reported Resistant Information
| Name |
Lenvatinib
|
||||
|---|---|---|---|---|---|
| Synonyms |
Lenvatinib; 417716-92-8; E7080; Lenvima; 4-(3-chloro-4-(3-cyclopropylureido)phenoxy)-7-methoxyquinoline-6-carboxamide; E7080 (Lenvatinib); Lenvatinib (E7080); E 7080; E-7080; Lenvatinib free base; ER-203492-00; UNII-EE083865G2; 4-[3-Chloro-4-(cyclopropylaminocarbonyl)aminophenoxy]-7-methoxy-6-quinolinecarboxamide; 4-{3-Chloro-4-[(Cyclopropylcarbamoyl)amino]phenoxy}-7-Methoxyquinoline-6-Carboxamide; 4-[3-chloro-4-(cyclopropylcarbamoylamino)phenoxy]-7-methoxyquinoline-6-carboxamide; CHEMBL1289601; CHEBI:85994; 417716-92-8 (free base); EE083865G2; 4-(3-chloro-4-(N'-cyclopropylureido)phenoxy)-7-methoxyquinoline-6-carboxamide; Lenvatinib [USAN:INN]; Kisplyx; 4-(3-Chloro-4-(cyclopropylaminocarbonyl)aminophenoxy)-7-methoxy-6-quinolinecarboxamide; LEV; LenvatinibE7080); Lenvatinib; E7080; Lenvatinib base- Bio-X; Lenvatinib (USAN/INN); MLS006011239; SCHEMBL864638; GTPL7426; AMY9240; DTXSID50194605; EX-A249; QCR-115; SYN1038; BCPP000247; HMS3244A07; HMS3244A08; HMS3244B07; HMS3654A14; AOB87766; BCP01799; ZINC3816292; BDBM50331094; MFCD16038644; NSC755980; NSC800781; s1164; AKOS025401742; BCP9000633; CCG-264842; CS-0109; DB09078; NSC-755980; NSC-800781; SB16580; 4-(3-chloro-4-((cyclopropylaminocarbonyl)amino)phenoxy)-7-methoxy-6-quinolinecarboxamide; NCGC00263198-01; NCGC00263198-04; NCGC00263198-07; AC-25047; AS-16203; BL164616; HY-10981; SMR004702999; DB-070219; FT-0700727; SW219259-1; D09919; 716C928; A825653; J-513372; Q6523413; BRD-K39974922-001-02-7; 4-[3-chloranyl-4-(cyclopropylcarbamoylamino)phenoxy]-7-methoxy-quinoline-6-carboxamide; 4-[3-Chloro-4-[[(cyclopropylamino)carbonyl]amino]phenoxy]-7-methoxy-6-quinolinecarboxamide; 4-[3-chloro-4-[[(cyclopropylamino)-oxomethyl]amino]phenoxy]-7-methoxy-6-quinolinecarboxamide; 6-Quinolinecarboxamide, 4-(3-chloro-4- (((cyclopropylamino)carbonyl)amino)phenoxy)-7-methoxy-
Click to Show/Hide
|
||||
| Indication |
In total 8 Indication(s)
|
||||
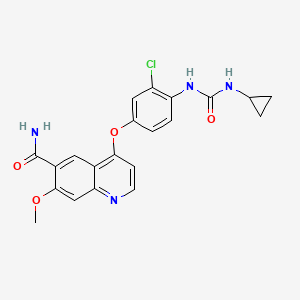
| Structure |
|
||||
| Drug Resistance Disease(s) |
Disease(s) with Clinically Reported Resistance for This Drug
(2 diseases)
[2]
[3]
Disease(s) with Resistance Information Discovered by Cell Line Test for This Drug
(1 diseases)
[1]
|
||||
| Click to Show/Hide the Molecular Information and External Link(s) of This Drug | |||||
| Formula |
C21H19ClN4O4
|
||||
| IsoSMILES |
COC1=CC2=NC=CC(=C2C=C1C(=O)N)OC3=CC(=C(C=C3)NC(=O)NC4CC4)Cl
|
||||
| InChI |
1S/C21H19ClN4O4/c1-29-19-10-17-13(9-14(19)20(23)27)18(6-7-24-17)30-12-4-5-16(15(22)8-12)26-21(28)25-11-2-3-11/h4-11H,2-3H2,1H3,(H2,23,27)(H2,25,26,28)
|
||||
| InChIKey |
WOSKHXYHFSIKNG-UHFFFAOYSA-N
|
||||
| PubChem CID | |||||
| TTD Drug ID | |||||
| VARIDT ID | |||||
| DrugBank ID | |||||
Type(s) of Resistant Mechanism of This Drug
 ADTT: Aberration of the Drug's Therapeutic Target
 EADR: Epigenetic Alteration of DNA, RNA or Protein
 MRAP: Metabolic Reprogramming via Altered Pathways
 UAPP: Unusual Activation of Pro-survival Pathway
Drug Resistance Data Categorized by Their Corresponding Diseases
ICD-02: Benign/in-situ/malignant neoplasm
| Drug Resistance Data Categorized by Their Corresponding Mechanisms | ||||
|
Metabolic Reprogramming via Altered Pathways (MRAP)
|
||||
| Key Molecule: Acylphosphatase 1 (ACYP1) | [4] | |||
| Metabolic Type | Glucose metabolism | |||
| Resistant Disease | Hepatocellular carcinoma [ICD-11: 2C12.02] | |||
| Molecule Alteration | Expression | Up-regulation |
||
| Differential expression of the molecule in resistant disease | ||||
| Classification of Disease | Liver cancer [ICD-11: 2C12] | |||
| The Specified Disease | Hepatocellular carcinoma | |||
| The Studied Tissue | Liver tissue | |||
| The Expression Level of Disease Section Compare with the Healthy Individual Tissue | p-value: 1.80E-05 Fold-change: 2.38E-01 Z-score: 4.38E+00 |
|||
| Experimental Note | Revealed Based on the Cell Line Data | |||
| In Vivo Model | LvACYP1 Hep3B cells lung metastasis model; LvACYP1 Hep3B cells xenograft model; LvCON Hep3B cells lung metastasis model; LvCON Hep3B cells xenograft model | Mice | ||
| Experiment for Molecule Alteration |
RT-qPCR | |||
| Experiment for Drug Resistance |
Tumor volume assay | |||
| Mechanism Description | Mechanistically, ACYP1 enhanced glycolysis by upregulating the expression of LDHA, and the upregulation of LDHA is MYC-dependent. Additionally, the stability of c-Myc can be attributed to the interaction of ACYP1 and HSP90. More importantly, the ACYP1/HSP90/MYC/LDHA axis is associated with lenvatinib resistance in HCC cells. | |||
| Key Molecule: Acylphosphatase 1 (ACYP1) | [4] | |||
| Metabolic Type | Glucose metabolism | |||
| Resistant Disease | Hepatocellular carcinoma [ICD-11: 2C12.02] | |||
| Molecule Alteration | Expression | Up-regulation |
||
| Differential expression of the molecule in resistant disease | ||||
| Classification of Disease | Liver cancer [ICD-11: 2C12] | |||
| The Specified Disease | Hepatocellular carcinoma | |||
| The Studied Tissue | Liver tissue | |||
| The Expression Level of Disease Section Compare with the Healthy Individual Tissue | p-value: 1.80E-05 Fold-change: 2.38E-01 Z-score: 4.38E+00 |
|||
| Experimental Note | Revealed Based on the Cell Line Data | |||
| In Vitro Model | Hep3B cells | Liver | Homo sapiens (Human) | CVCL_0326 |
| Huh7 cells | Kidney | Homo sapiens (Human) | CVCL_U442 | |
| Experiment for Molecule Alteration |
RT-qPCR | |||
| Experiment for Drug Resistance |
MTS assay; Cell colony formation assay | |||
| Mechanism Description | Mechanistically, ACYP1 enhanced glycolysis by upregulating the expression of LDHA, and the upregulation of LDHA is MYC-dependent. Additionally, the stability of c-Myc can be attributed to the interaction of ACYP1 and HSP90. More importantly, the ACYP1/HSP90/MYC/LDHA axis is associated with lenvatinib resistance in HCC cells. | |||
| Key Molecule: Acylphosphatase 1 (ACYP1) | [4] | |||
| Metabolic Type | Glucose metabolism | |||
| Resistant Disease | Hepatocellular carcinoma [ICD-11: 2C12.02] | |||
| Molecule Alteration | Expression | Up-regulation |
||
| Differential expression of the molecule in resistant disease | ||||
| Classification of Disease | Liver cancer [ICD-11: 2C12] | |||
| The Specified Disease | Hepatocellular carcinoma | |||
| The Studied Tissue | Liver tissue | |||
| The Expression Level of Disease Section Compare with the Healthy Individual Tissue | p-value: 1.80E-05 Fold-change: 2.38E-01 Z-score: 4.38E+00 |
|||
| Experimental Note | Identified from the Human Clinical Data | |||
| In Vivo Model | HCC patients | Homo Sapiens | ||
| Experiment for Molecule Alteration |
RT-qPCR | |||
| Experiment for Drug Resistance |
Overall survival assay (OS) | |||
| Mechanism Description | Mechanistically, ACYP1 enhanced glycolysis by upregulating the expression of LDHA, and the upregulation of LDHA is MYC-dependent. Additionally, the stability of c-Myc can be attributed to the interaction of ACYP1 and HSP90. More importantly, the ACYP1/HSP90/MYC/LDHA axis is associated with lenvatinib resistance in HCC cells. | |||
| Key Molecule: Acylphosphatase 1 (ACYP1) | [4] | |||
| Metabolic Type | Glucose metabolism | |||
| Resistant Disease | Hepatocellular carcinoma [ICD-11: 2C12.02] | |||
| Molecule Alteration | Expression | Up-regulation |
||
| Differential expression of the molecule in resistant disease | ||||
| Classification of Disease | Liver cancer [ICD-11: 2C12] | |||
| The Specified Disease | Hepatocellular carcinoma | |||
| The Studied Tissue | Liver tissue | |||
| The Expression Level of Disease Section Compare with the Healthy Individual Tissue | p-value: 1.80E-05 Fold-change: 2.38E-01 Z-score: 4.38E+00 |
|||
| Experimental Note | Identified from the Human Clinical Data | |||
| In Vivo Model | HCC patients | Homo Sapiens | ||
| Experiment for Molecule Alteration |
RT-qPCR | |||
| Experiment for Drug Resistance |
Tumor volume assay | |||
| Mechanism Description | Mechanistically, ACYP1 enhanced glycolysis by upregulating the expression of LDHA, and the upregulation of LDHA is MYC-dependent. Additionally, the stability of c-Myc can be attributed to the interaction of ACYP1 and HSP90. More importantly, the ACYP1/HSP90/MYC/LDHA axis is associated with lenvatinib resistance in HCC cells. | |||
| Key Molecule: Insulin-like growth factor 2 mRNA-binding protein 3 (IGF2BP3) | [2] | |||
| Metabolic Type | Glucose metabolism | |||
| Resistant Disease | Hepatocellular carcinoma [ICD-11: 2C12.02] | |||
| Molecule Alteration | Lactylation | K76 |
||
| Experimental Note | Identified from the Human Clinical Data | |||
| In Vivo Model | HCC patients | Homo Sapiens | ||
| Experiment for Molecule Alteration |
Liquid chromatography mass spectrometry (LC-MS) | |||
| Experiment for Drug Resistance |
Modified response evaluation criteria in solid tumors (mRECIST) | |||
| Mechanism Description | This study reveals that in lenvatinib-resistant hepatocellular carcinoma, increased glycolysis results in lactate accumulation and lysine lactylation of IGF2BP3, which increase the expression of PCK2 and NRF2. This leads to a reprogramming of serine metabolism, S-adenosylmethionine (SAM) production, RNA m6A modification, and the antioxidant system. The IGF2BP3 lactylation-PCK2-SAM-m6A loop sustains the upregulation of PCK2 and NRF2 expression and ultimately confers lenvatinib resistance. | |||
| Key Molecule: Zinc finger and BTB domain-containing protein 7A (ZBTB7A) | [8] | |||
| Metabolic Type | Glucose metabolism | |||
| Resistant Disease | Hepatocellular carcinoma [ICD-11: 2C12.02] | |||
| Molecule Alteration | Expression | Up-regulation |
||
| Experimental Note | Identified from the Human Clinical Data | |||
| In Vivo Model | HCC patients | Homo Sapiens | ||
| Experiment for Molecule Alteration |
Western blot analysis | |||
| Experiment for Drug Resistance |
Cell prognosis assay | |||
| Mechanism Description | In the present work, our results, for the first time, revealed that FBI-1 induced the aerobic glycolysis/Warburg effect of HCC cells by enhancing the expression of HIF-1alpha and its target genes. | |||
| Key Molecule: BCL2 interacting protein 3 (BNIP3) | [9] | |||
| Metabolic Type | Mitochondrial metabolism | |||
| Resistant Disease | Hepatocellular carcinoma [ICD-11: 2C12.02] | |||
| Molecule Alteration | Expression | Up-regulation |
||
| Experimental Note | Revealed Based on the Cell Line Data | |||
| In Vitro Model | Huh7 cells | Kidney | Homo sapiens (Human) | CVCL_U442 |
| Experiment for Molecule Alteration |
Mitochondrial morphology assay; Mitophagy colocalization assay; Western blot analysis | |||
| Experiment for Drug Resistance |
Cell viability assay | |||
| Mechanism Description | Of note, our transcriptome analyses showed that, in HCC cell competition scenario, lenvatinib-resistant cells captured the increased glycolysis activity but the attenuated oxidative phosphorylation level as well as decreased mitochondria mass; however, lenvatinib-sensitive cells obtain opposite metabolic features. | |||
| Key Molecule: Zinc finger and BTB domain-containing protein 7A (ZBTB7A) | [8] | |||
| Metabolic Type | Glucose metabolism | |||
| Resistant Disease | Hepatocellular carcinoma [ICD-11: 2C12.02] | |||
| Molecule Alteration | Expression | Up-regulation |
||
| Experimental Note | Revealed Based on the Cell Line Data | |||
| In Vitro Model | HepG2 cells | Liver | Homo sapiens (Human) | CVCL_0027 |
| MHCC97-H cells | Liver | Homo sapiens (Human) | CVCL_4972 | |
| MHCC97-L cells | Liver | Homo sapiens (Human) | CVCL_4973 | |
| L-02 hepatic non-tumor cells | Liver | Homo sapiens (Human) | CVCL_6926 | |
| Experiment for Molecule Alteration |
Western blot analysis | |||
| Experiment for Drug Resistance |
MTT assay | |||
| Mechanism Description | In the present work, our results, for the first time, revealed that FBI-1 induced the aerobic glycolysis/Warburg effect of HCC cells by enhancing the expression of HIF-1alpha and its target genes. | |||
| Key Molecule: BCL2 interacting protein 3 (BNIP3) | [9] | |||
| Metabolic Type | Mitochondrial metabolism | |||
| Resistant Disease | Hepatocellular carcinoma [ICD-11: 2C12.02] | |||
| Molecule Alteration | Expression | Up-regulation |
||
| Experimental Note | Revealed Based on the Cell Line Data | |||
| In Vivo Model | Six-week-old female BALB/c nude mice, Huh7R/PLC-PRF-5R | Mice | ||
| Experiment for Molecule Alteration |
Mitochondrial morphology assay; Mitophagy colocalization assay; Western blot analysis | |||
| Experiment for Drug Resistance |
Tumor volume assay | |||
| Mechanism Description | Of note, our transcriptome analyses showed that, in HCC cell competition scenario, lenvatinib-resistant cells captured the increased glycolysis activity but the attenuated oxidative phosphorylation level as well as decreased mitochondria mass; however, lenvatinib-sensitive cells obtain opposite metabolic features. | |||
| Key Molecule: Zinc finger and BTB domain-containing protein 7A (ZBTB7A) | [8] | |||
| Metabolic Type | Glucose metabolism | |||
| Resistant Disease | Hepatocellular carcinoma [ICD-11: 2C12.02] | |||
| Molecule Alteration | Expression | Up-regulation |
||
| Experimental Note | Revealed Based on the Cell Line Data | |||
| In Vivo Model | Nude mice, MHCC97-H cells | Mice | ||
| Experiment for Molecule Alteration |
Western blot analysis | |||
| Experiment for Drug Resistance |
Tumor volume assay | |||
| Mechanism Description | In the present work, our results, for the first time, revealed that FBI-1 induced the aerobic glycolysis/Warburg effect of HCC cells by enhancing the expression of HIF-1alpha and its target genes. | |||
| Key Molecule: Insulin-like growth factor 2 mRNA-binding protein 3 (IGF2BP3) | [2] | |||
| Metabolic Type | Glucose metabolism | |||
| Resistant Disease | Hepatocellular carcinoma [ICD-11: 2C12.02] | |||
| Molecule Alteration | Lactylation | K76 |
||
| Experimental Note | Revealed Based on the Cell Line Data | |||
| In Vivo Model | Hydrodynamic transfection mouse model | Mice | ||
| Experiment for Molecule Alteration |
Liquid chromatography?mass spectrometry (LC?MS) | |||
| Experiment for Drug Resistance |
Tumor volume assay | |||
| Mechanism Description | This study reveals that in lenvatinib-resistant hepatocellular carcinoma, increased glycolysis results in lactate accumulation and lysine lactylation of IGF2BP3, which increase the expression of PCK2 and NRF2. This leads to a reprogramming of serine metabolism, S-adenosylmethionine (SAM) production, RNA m6A modification, and the antioxidant system. The IGF2BP3 lactylation-PCK2-SAM-m6A loop sustains the upregulation of PCK2 and NRF2 expression and ultimately confers lenvatinib resistance. | |||
|
Aberration of the Drug's Therapeutic Target (ADTT)
|
||||
| Key Molecule: Double-stranded RNA-specific adenosine deaminase (ADAR) | [7] | |||
| Resistant Disease | Cholangiocarcinoma [ICD-11: 2C12.0] | |||
| Molecule Alteration | Missense mutation | Loss |
||
| Experimental Note | Revealed Based on the Cell Line Data | |||
| In Vitro Model | B76.1/Huh7 cells | N.A. | Homo sapiens (Human) | CVCL_U443 |
| MHCC97H cells | Liver | Homo sapiens (Human) | CVCL_4972 | |
| In Vivo Model | NYG male nude mice model; Balb/c male nude mice model | Mus musculus | ||
| Experiment for Molecule Alteration |
Western blot assay; RNA extraction assay; RT-PCR; RNA sequencing assay; ChIP-qPCR; Immunohistochemistry | |||
| Experiment for Drug Resistance |
Viability assay | |||
| Mechanism Description | Key results: Based on The Cancer Genome Atlas (TCGA) data, we screened 6 most frequently lost tumour suppressor genes in HCC (TP53, ARID1A, AXIN1, CDKN2A, ARID2 and PTEN) and identified AXIN1 as the most crucial gene for lenvatinib sensitivity. Further study showed that AXIN1-knockout HCC cells had a more malignant phenotype and lower sensitivity to lenvatinib in vitro and in vivo. Mechanistically, the WNT pathway and its target gene c-Myc were activated when AXIN1 was missing, and the expression of tumour suppressor p15 was inhibited by transcription co-repressors c-Myc and Miz-1, resulting in the exacerbation of the resistant phenotype. Screening of a library of epigenetic-related enzyme inhibitors showed that a KDM5B inhibitor up-regulated p15 expression, leading to increased sensitivity to lenvatinib in vitro and in vivo.Conclusion and implications: AXIN1-deficient patients have a lower response to lenvatinib, which may be associated with suppression of p15 mediated by WNT pathway activation. KDM5B inhibitors can restore p15 levels, resulting in efficient killing of resistant cells in HCC. | |||
|
Unusual Activation of Pro-survival Pathway (UAPP)
|
||||
| Key Molecule: Dual specificity phosphatase 9 (DUSP9) | [1] | |||
| Resistant Disease | Hepatocellular carcinoma [ICD-11: 2C12.2] | |||
| Molecule Alteration | Expression | Down-regulation |
||
| Experimental Note | Revealed Based on the Cell Line Data | |||
| Cell Pathway Regulation | PI3K/AKT signaling pathway | Activation | hsa04151 | |
| MAPK/ERK signaling pathway | Activation | hsa04010 | ||
| FOXO3 signaling pathway | Inhibition | hsa04068 | ||
| In Vivo Model | Xenograft-nude mouse model | Mus musculus | ||
| Experiment for Molecule Alteration |
Quantitative RT-PCR; Western blotting assay | |||
| Experiment for Drug Resistance |
MTT assay; Transwell invasion assay | |||
| Mechanism Description | With RNAi knockdown and CRISPR/Cas9 knockout models, we further clarified the mechanisms by which NF1 loss reactivates the PI3K/AKT and MAPK/ERK signaling pathways, while DUSP9 loss activates the MAPK/ERK signaling pathways, thereby inactivating FOXO3, followed by degradation of FOXO3, finally induced lenvatinib resistance. | |||
| Key Molecule: Neurofibromin (NF1) | [1] | |||
| Resistant Disease | Hepatocellular carcinoma [ICD-11: 2C12.2] | |||
| Molecule Alteration | Expression | Down-regulation |
||
| Experimental Note | Revealed Based on the Cell Line Data | |||
| Cell Pathway Regulation | PI3K/AKT signaling pathway | Activation | hsa04151 | |
| MAPK/ERK signaling pathway | Activation | hsa04010 | ||
| FOXO3 signaling pathway | Inhibition | hsa04068 | ||
| In Vivo Model | Xenograft-nude mouse model | Mus musculus | ||
| Experiment for Molecule Alteration |
Quantitative RT-PCR; Western blotting assay | |||
| Experiment for Drug Resistance |
MTT assay; Transwell invasion assay | |||
| Mechanism Description | With RNAi knockdown and CRISPR/Cas9 knockout models, we further clarified the mechanisms by which NF1 loss reactivates the PI3K/AKT and MAPK/ERK signaling pathways, while DUSP9 loss activates the MAPK/ERK signaling pathways, thereby inactivating FOXO3, followed by degradation of FOXO3, finally induced lenvatinib resistance. | |||
| Drug Sensitivity Data Categorized by Their Corresponding Mechanisms | ||||
|
Metabolic Reprogramming via Altered Pathways (MRAP)
|
||||
| Key Molecule: Insulin-like growth factor 2 mRNA-binding protein 3 (IGF2BP3) | [2] | |||
| Metabolic Type | Glucose metabolism | |||
| Sensitive Disease | Hepatocellular carcinoma [ICD-11: 2C12.02] | |||
| Molecule Alteration | Lactylation | K76 |
||
| Experimental Note | Identified from the Human Clinical Data | |||
| In Vivo Model | Orthotopic HCC model with the glycolysis inhibitor 2-DG | Homo Sapiens | ||
| Experiment for Molecule Alteration |
Liquid chromatography mass spectrometry (LC-MS) | |||
| Experiment for Drug Resistance |
Tumor volume assay | |||
| Mechanism Description | This study reveals that in lenvatinib-resistant hepatocellular carcinoma, increased glycolysis results in lactate accumulation and lysine lactylation of IGF2BP3, which increase the expression of PCK2 and NRF2. This leads to a reprogramming of serine metabolism, S-adenosylmethionine (SAM) production, RNA m6A modification, and the antioxidant system. The IGF2BP3 lactylation-PCK2-SAM-m6A loop sustains the upregulation of PCK2 and NRF2 expression and ultimately confers lenvatinib resistance. | |||
| Key Molecule: Insulin-like growth factor 2 mRNA-binding protein 3 (IGF2BP3) | [2] | |||
| Metabolic Type | Glucose metabolism | |||
| Sensitive Disease | Hepatocellular carcinoma [ICD-11: 2C12.02] | |||
| Molecule Alteration | Lactylation | K76 |
||
| Experimental Note | Revealed Based on the Cell Line Data | |||
| In Vitro Model | IGF2BP3 knockdown Hep3B-LR cells | Liver | Homo sapiens (Human) | CVCL_0326 |
| IGF2BP3 knockdown Huh7-LR cells | Liver | Homo sapiens (Human) | CVCL_0336 | |
| Experiment for Molecule Alteration |
Liquid chromatography?mass spectrometry (LC?MS) | |||
| Experiment for Drug Resistance |
IC50 assay | |||
| Mechanism Description | This study reveals that in lenvatinib-resistant hepatocellular carcinoma, increased glycolysis results in lactate accumulation and lysine lactylation of IGF2BP3, which increase the expression of PCK2 and NRF2. This leads to a reprogramming of serine metabolism, S-adenosylmethionine (SAM) production, RNA m6A modification, and the antioxidant system. The IGF2BP3 lactylation-PCK2-SAM-m6A loop sustains the upregulation of PCK2 and NRF2 expression and ultimately confers lenvatinib resistance. | |||
| Key Molecule: Acylphosphatase 1 (ACYP1) | [4] | |||
| Metabolic Type | Glucose metabolism | |||
| Sensitive Disease | Hepatocellular carcinoma [ICD-11: 2C12.02] | |||
| Molecule Alteration | Expression | Down-regulation |
||
| Experimental Note | Revealed Based on the Cell Line Data | |||
| In Vitro Model | ACYP1 overexpression cells | Liver | Homo sapiens (Human) | N.A. |
| SK-Hep1 cells | Ascites | Homo sapiens (Human) | CVCL_0525 | |
| In Vivo Model | ACYP1 knockdown nude mice | Mice | ||
| Experiment for Molecule Alteration |
RT-qPCR | |||
| Experiment for Drug Resistance |
Tumor volume assay | |||
| Mechanism Description | Mechanistically, ACYP1 enhanced glycolysis by upregulating the expression of LDHA, and the upregulation of LDHA is MYC-dependent. Additionally, the stability of c-Myc can be attributed to the interaction of ACYP1 and HSP90. More importantly, the ACYP1/HSP90/MYC/LDHA axis is associated with lenvatinib resistance in HCC cells. | |||
|
Unusual Activation of Pro-survival Pathway (UAPP)
|
||||
| Key Molecule: Oncogenic epidermal growth factor receptor (EGFR) | [10] | |||
| Sensitive Disease | Cholangiocarcinoma [ICD-11: 2C12.0] | |||
| Molecule Alteration | Expression | Down-regulation |
||
| Experimental Note | Discovered Using In-vivo Testing Model | |||
| Cell Pathway Regulation | EGF-EGFR signaling pathway | Regulation | N.A. | |
| In Vivo Model | Mouse model | Mus musculus | ||
| Experiment for Molecule Alteration |
Immunoprecipitation assay; LC-MS/MS analysis | |||
| Experiment for Drug Resistance |
Cellular ROS and lipid peroxidation level assay; LOXL3 enzymatic assay; In vitro kinase assay | |||
| Mechanism Description | To overcome chemotherapy resistance, novel strategies sensitizing cancer cells to chemotherapy are required. Here, we screen the lysyl-oxidase (LOX) family to clarify its contribution to chemotherapy resistance in liver cancer. LOXL3 depletion significantly sensitizes liver cancer cells to Oxaliplatin by inducing ferroptosis. Chemotherapy-activated EGFR signaling drives LOXL3 to interact with TOM20, causing it to be hijacked into mitochondria, where LOXL3 lysyl-oxidase activity is reinforced by phosphorylation at S704. Metabolic adenylate kinase 2 (AK2) directly phosphorylates LOXL3-S704. Phosphorylated LOXL3-S704 targets dihydroorotate dehydrogenase (DHODH) and stabilizes it by preventing its ubiquitin-mediated proteasomal degradation. K344-deubiquitinated DHODH accumulates in mitochondria, in turn inhibiting chemotherapy-induced mitochondrial ferroptosis. CRISPR-Cas9-mediated site-mutation of mouse LOXL3-S704 to D704 causes a reduction in lipid peroxidation. Using an advanced liver cancer mouse model, we further reveal that low-dose Oxaliplatin in combination with the DHODH-inhibitor Leflunomide effectively inhibit liver cancer progression by inducing ferroptosis, with increased chemotherapy sensitivity and decreased chemotherapy toxicity. | |||
| Key Molecule: NTF2-related export protein 1 (NXT1) | [7] | |||
| Sensitive Disease | Cholangiocarcinoma [ICD-11: 2C12.0] | |||
| Molecule Alteration | Expression | Up-regulation |
||
| Experimental Note | Revealed Based on the Cell Line Data | |||
| Cell Pathway Regulation | WNT/KDM5B/p15 signaling pathway | Regulation | N.A. | |
| In Vitro Model | B76.1/Huh7 cells | N.A. | Homo sapiens (Human) | CVCL_U443 |
| MHCC97H cells | Liver | Homo sapiens (Human) | CVCL_4972 | |
| In Vivo Model | NYG male nude mice model; Balb/c male nude mice model | Mus musculus | ||
| Experiment for Molecule Alteration |
Western blot assay; RNA extraction assay; RT-PCR; RNA sequencing assay; ChIP-qPCR; Immunohistochemistry | |||
| Experiment for Drug Resistance |
Viability assay | |||
| Mechanism Description | Key results: Based on The Cancer Genome Atlas (TCGA) data, we screened 6 most frequently lost tumour suppressor genes in HCC (TP53, ARID1A, AXIN1, CDKN2A, ARID2 and PTEN) and identified AXIN1 as the most crucial gene for lenvatinib sensitivity. Further study showed that AXIN1-knockout HCC cells had a more malignant phenotype and lower sensitivity to lenvatinib in vitro and in vivo. Mechanistically, the WNT pathway and its target gene c-Myc were activated when AXIN1 was missing, and the expression of tumour suppressor p15 was inhibited by transcription co-repressors c-Myc and Miz-1, resulting in the exacerbation of the resistant phenotype. Screening of a library of epigenetic-related enzyme inhibitors showed that a KDM5B inhibitor up-regulated p15 expression, leading to increased sensitivity to lenvatinib in vitro and in vivo.Conclusion and implications: AXIN1-deficient patients have a lower response to lenvatinib, which may be associated with suppression of p15 mediated by WNT pathway activation. KDM5B inhibitors can restore p15 levels, resulting in efficient killing of resistant cells in HCC. | |||
| Drug Sensitivity Data Categorized by Their Corresponding Mechanisms | ||||
|
Aberration of the Drug's Therapeutic Target (ADTT)
|
||||
| Key Molecule: Fibroblast growth factor receptor 2 (FGFR2) | [5] | |||
| Sensitive Disease | Solid tumour/cancer [ICD-11: 2A00-2F9Z] | |||
| Molecule Alteration | Missense mutation | p.K660E (c.1978A>G) |
||
| Experimental Note | Identified from the Human Clinical Data | |||
| In Vitro Model | Ba/F3 cells | Colon | Homo sapiens (Human) | CVCL_0161 |
| NIH-3T3 cells | Embryo | Mus musculus (Mouse) | CVCL_0594 | |
| In Vivo Model | Mouse xenograft model | Mus musculus | ||
| Experiment for Molecule Alteration |
Western blot analysis | |||
| Experiment for Drug Resistance |
Soft-agar colony formation assay | |||
| Mechanism Description | The missense mutation p.K660E (c.1978A>G) in gene FGFR2 cause the sensitivity of Lenvatinib by aberration of the drug's therapeutic target | |||
| Key Molecule: Fibroblast growth factor receptor 2 (FGFR2) | [5] | |||
| Sensitive Disease | Solid tumour/cancer [ICD-11: 2A00-2F9Z] | |||
| Molecule Alteration | Missense mutation | p.K660N (c.1980G>C) |
||
| Experimental Note | Identified from the Human Clinical Data | |||
| In Vitro Model | Ba/F3 cells | Colon | Homo sapiens (Human) | CVCL_0161 |
| NIH-3T3 cells | Embryo | Mus musculus (Mouse) | CVCL_0594 | |
| In Vivo Model | Mouse xenograft model | Mus musculus | ||
| Experiment for Molecule Alteration |
Western blot analysis | |||
| Experiment for Drug Resistance |
Soft-agar colony formation assay | |||
| Mechanism Description | The missense mutation p.K660N (c.1980G>C) in gene FGFR2 cause the sensitivity of Lenvatinib by aberration of the drug's therapeutic target | |||
| Key Molecule: Fibroblast growth factor receptor 2 (FGFR2) | [5] | |||
| Sensitive Disease | Solid tumour/cancer [ICD-11: 2A00-2F9Z] | |||
| Molecule Alteration | Missense mutation | p.W290C (c.870G>T) |
||
| Experimental Note | Identified from the Human Clinical Data | |||
| In Vitro Model | Ba/F3 cells | Colon | Homo sapiens (Human) | CVCL_0161 |
| NIH-3T3 cells | Embryo | Mus musculus (Mouse) | CVCL_0594 | |
| In Vivo Model | Mouse xenograft model | Mus musculus | ||
| Experiment for Molecule Alteration |
Western blot analysis | |||
| Experiment for Drug Resistance |
Soft-agar colony formation assay | |||
| Mechanism Description | The missense mutation p.W290C (c.870G>T) in gene FGFR2 cause the sensitivity of Lenvatinib by aberration of the drug's therapeutic target | |||
| Drug Sensitivity Data Categorized by Their Corresponding Mechanisms | ||||
|
Epigenetic Alteration of DNA, RNA or Protein (EADR)
|
||||
| Key Molecule: VEGF-2 receptor (KDR) | [6] | |||
| Sensitive Disease | Colorectal cancer [ICD-11: 2B91.1] | |||
| Molecule Alteration | Missense mutation | p.R1032Q (c.3095G>A) |
||
| Experimental Note | Identified from the Human Clinical Data | |||
| Cell Pathway Regulation | VEGF signaling pathway | Activation | hsa04370 | |
| In Vitro Model | Colo-320 cells | Colon | Homo sapiens (Human) | CVCL_1989 |
| MDST8 cells | Colon | Homo sapiens (Human) | CVCL_2588 | |
| In Vivo Model | Nude mouse PDX model | Mus musculus | ||
| Experiment for Molecule Alteration |
BEAMing assay; Western blot analysis; immunofluorescence assay | |||
| Experiment for Drug Resistance |
Promega assay | |||
| Mechanism Description | VEGFR2 is somatically mutated across tumor types and that VEGFR2 mutants can be oncogenic and control sensitivity/resistance to antiangiogenic drugs. | |||
| Drug Sensitivity Data Categorized by Their Corresponding Mechanisms | ||||
|
Aberration of the Drug's Therapeutic Target (ADTT)
|
||||
| Key Molecule: Proto-oncogene tyrosine-protein kinase receptor Ret (RET) | [11] | |||
| Sensitive Disease | Thyroid gland cancer [ICD-11: 2D10.0] | |||
| Molecule Alteration | Missense mutation | p.C634W (c.1902C>G) |
||
| Experimental Note | Revealed Based on the Cell Line Data | |||
| In Vitro Model | FTC-133 cells | Thyroid | Homo sapiens (Human) | CVCL_1219 |
| 8305C cells | Thyroid | Homo sapiens (Human) | CVCL_1053 | |
| 8505C cells | Thyroid | Homo sapiens (Human) | CVCL_1054 | |
| KHM-5M cells | Pleural effusion | Homo sapiens (Human) | CVCL_2975 | |
| TT cells | Thyroid gland | Homo sapiens (Human) | CVCL_1774 | |
| TCO-1 cells | Lnguinal lymph node | Homo sapiens (Human) | CVCL_3179 | |
| RO82-W-1 cells | Thyroid | Homo sapiens (Human) | CVCL_0582/CVCL_1663 | |
| Nthy-ori 3-1 cells | N.A. | Homo sapiens (Human) | CVCL_2659 | |
| K1 cells | Thyroid | Homo sapiens (Human) | CVCL_2537 | |
| HTC-C3 cells | Pleural effusion | Homo sapiens (Human) | CVCL_2273 | |
| FTC-238 cells | Lung | Homo sapiens (Human) | CVCL_2447 | |
| FTC-236 cells | Cervical lymph node | Homo sapiens (Human) | CVCL_2446 | |
| In Vivo Model | Female nude mouse xenograft model | Mus musculus | ||
| Experiment for Molecule Alteration |
Western blot analysis; ICH assay | |||
| Experiment for Drug Resistance |
MSA assay; WST-8 assay | |||
| Drug Resistance Data Categorized by Their Corresponding Mechanisms | |||||||||||||
|
Aberration of the Drug's Therapeutic Target (ADTT)
|
|||||||||||||
| Key Molecule: Proto-oncogene tyrosine-protein kinase receptor Ret (RET) | [3] | ||||||||||||
| Resistant Disease | Multiple endocrine neoplasia [ICD-11: 2F7A.0] | ||||||||||||
| Molecule Alteration | Missense mutation | p.M918T |
|||||||||||
| Wild Type Structure | Method: X-ray diffraction | Resolution: 1.64 Å | |||||||||||
| Mutant Type Structure | Method: X-ray diffraction | Resolution: 2.12 Å | |||||||||||
| Download The Information of Sequence | Download The Structure File | ||||||||||||
-
700
|
G
G
P
P
L
L
S
S
L
L
S
S
V
V
D
D
A
A
F
F
710
|
K
K
I
I
L
L
E
E
D
D
P
P
K
K
W
W
E
E
F
F
720
|
P
P
R
R
K
K
N
N
L
L
V
V
L
L
G
G
K
K
T
T
730
|
L
L
G
G
E
E
G
G
E
E
F
F
G
G
K
K
V
V
V
V
740
|
K
K
A
A
T
T
A
A
F
F
H
H
L
L
K
K
G
G
R
R
750
|
A
A
G
G
Y
Y
T
T
T
T
V
V
A
A
V
V
K
K
M
M
760
|
L
L
K
K
E
E
N
N
A
A
S
S
P
P
S
S
E
E
L
L
770
|
R
R
D
D
L
L
L
L
S
S
E
E
F
F
N
N
V
V
L
L
780
|
K
K
Q
Q
V
V
N
N
H
H
P
P
H
H
V
V
I
I
K
K
790
|
L
L
Y
Y
G
G
A
A
C
C
S
S
Q
Q
D
D
G
G
P
P
800
|
L
L
L
L
L
L
I
I
V
V
E
E
Y
Y
A
A
K
K
Y
Y
810
|
G
G
S
S
L
L
R
R
G
G
F
F
L
L
R
R
E
E
S
S
820
|
R
R
K
K
V
V
G
G
P
P
G
G
Y
Y
L
L
G
G
S
S
830
|
G
G
G
G
S
S
R
R
N
N
S
S
S
S
S
S
L
L
D
D
840
|
H
H
P
P
D
D
E
E
R
R
A
A
L
L
T
T
M
M
G
G
850
|
D
D
L
L
I
I
S
S
F
F
A
A
W
W
Q
Q
I
I
S
S
860
|
Q
Q
G
G
M
M
Q
Q
Y
Y
L
L
A
A
E
E
M
M
K
K
870
|
L
L
V
V
H
H
R
R
D
D
L
L
A
A
A
A
R
R
N
N
880
|
I
I
L
L
V
V
A
A
E
E
G
G
R
R
K
K
M
M
K
K
890
|
I
I
S
S
D
D
F
F
G
G
L
L
S
S
R
R
D
D
V
V
900
|
Y
Y
E
E
E
E
D
D
S
S
Y
Y
V
V
K
K
R
R
S
S
910
|
Q
Q
G
G
R
R
I
I
P
P
V
V
K
K
W
W
M
T
A
A
920
|
I
I
E
E
S
S
L
L
F
F
D
D
H
H
I
I
Y
Y
T
T
930
|
T
T
Q
Q
S
S
D
D
V
V
W
W
S
S
F
F
G
G
V
V
940
|
L
L
L
L
W
W
E
E
I
I
V
V
T
T
L
L
G
G
G
G
950
|
N
N
P
P
Y
Y
P
P
G
G
I
I
P
P
P
P
E
E
R
R
960
|
L
L
F
F
N
N
L
L
L
L
K
K
T
T
G
G
H
H
R
R
970
|
M
M
E
E
R
R
P
P
D
D
N
N
C
C
S
S
E
E
E
E
980
|
M
M
Y
Y
R
R
L
L
M
M
L
L
Q
Q
C
C
W
W
K
K
990
|
Q
Q
E
E
P
P
D
D
K
K
R
R
P
P
V
V
F
F
A
A
1000
|
D
D
I
I
S
S
K
K
D
D
L
L
E
E
K
K
M
M
M
M
1010
|
V
V
K
K
R
R
R
R
|
|||||||||||||
| Experimental Note | Identified from the Human Clinical Data | ||||||||||||
| In Vitro Model | BaF3 cells | Bone | Mus musculus (Mouse) | CVCL_0161 | |||||||||
| Experiment for Molecule Alteration |
qRT-PCR | ||||||||||||
| Experiment for Drug Resistance |
LC50 assay | ||||||||||||
| Mechanism Description | M918T is a RET mutation prevalent in aggressive multiple endocrine neoplasia type 2B. M918T mutation is located at distant sites away from the TKI binding pocket. IC50s of cabozantinib, lenvatinib, vandetanib and nintedanib in BaF3/KR (M918T) cells were 6.5-fold, 7.5-fold, 4.3-fold and 1.7-fold, respectively, higher than in BaF3/KR cells. | ||||||||||||


References
If you find any error in data or bug in web service, please kindly report it to Dr. Sun and Dr. Yu.