Molecule Information
General Information of the Molecule (ID: Mol01877)
| Name |
3-hydroxy-3-methylglutaryl-CoA reductase (HMGCR)
,Homo sapiens
|
||||
|---|---|---|---|---|---|
| Synonyms |
HMGCR
Click to Show/Hide
|
||||
| Molecule Type |
Protein
|
||||
| Gene Name |
HMGCR
|
||||
| Gene ID | |||||
| Location |
chr5:75,336,329-75,364,001[+]
|
||||
| Sequence |
MLSRLFRMHGLFVASHPWEVIVGTVTLTICMMSMNMFTGNNKICGWNYECPKFEEDVLSS
DIIILTITRCIAILYIYFQFQNLRQLGSKYILGIAGLFTIFSSFVFSTVVIHFLDKELTG LNEALPFFLLLIDLSRASTLAKFALSSNSQDEVRENIARGMAILGPTFTLDALVECLVIG VGTMSGVRQLEIMCCFGCMSVLANYFVFMTFFPACVSLVLELSRESREGRPIWQLSHFAR VLEEEENKPNPVTQRVKMIMSLGLVLVHAHSRWIADPSPQNSTADTSKVSLGLDENVSKR IEPSVSLWQFYLSKMISMDIEQVITLSLALLLAVKYIFFEQTETESTLSLKNPITSPVVT QKKVPDNCCRREPMLVRNNQKCDSVEEETGINRERKVEVIKPLVAETDTPNRATFVVGNS SLLDTSSVLVTQEPEIELPREPRPNEECLQILGNAEKGAKFLSDAEIIQLVNAKHIPAYK LETLMETHERGVSIRRQLLSKKLSEPSSLQYLPYRDYNYSLVMGACCENVIGYMPIPVGV AGPLCLDEKEFQVPMATTEGCLVASTNRGCRAIGLGGGASSRVLADGMTRGPVVRLPRAC DSAEVKAWLETSEGFAVIKEAFDSTSRFARLQKLHTSIAGRNLYIRFQSRSGDAMGMNMI SKGTEKALSKLHEYFPEMQILAVSGNYCTDKKPAAINWIEGRGKSVVCEAVIPAKVVREV LKTTTEAMIEVNINKNLVGSAMAGSIGGYNAHAANIVTAIYIACGQDAAQNVGSSNCITL MEASGPTNEDLYISCTMPSIEIGTVGGGTNLLPQQACLQMLGVQGACKDNPGENARQLAR IVCGTVMAGELSLMAALAAGHLVKSHMIHNRSKINLQDLQGACTKKTA Click to Show/Hide
|
||||
| 3D-structure |
|
||||
| Function |
Catalyzes the conversion of (3S)-hydroxy-3-methylglutaryl-CoA (HMG-CoA) to mevalonic acid, the rate-limiting step in the synthesis of cholesterol and other isoprenoids, thus plays a critical role in cellular cholesterol homeostasis. HMGCR is the main target of statins, a class of cholesterol-lowering drugs.
Click to Show/Hide
|
||||
| Uniprot ID | |||||
| Ensembl ID | |||||
| HGNC ID | |||||
| Click to Show/Hide the Complete Species Lineage | |||||
Type(s) of Resistant Mechanism of This Molecule
 UAPP: Unusual Activation of Pro-survival Pathway
Drug Resistance Data Categorized by Drug
Approved Drug(s)
1 drug(s) in total
| Drug Resistance Data Categorized by Their Corresponding Mechanisms | ||||
|
Unusual Activation of Pro-survival Pathway (UAPP)
|
||||
| Disease Class: Breast cancer [ICD-11: 2C60.3] | [1] | |||
| Resistant Disease | Breast cancer [ICD-11: 2C60.3] | |||
| Resistant Drug | Fluvastatin | |||
| Molecule Alteration | Expression | Up-regulation |
||
| Differential expression of the molecule in resistant disease | ||||
| Classification of Disease | Breast cancer [ICD-11: 2C60] | |||
| The Specified Disease | Breast cancer | |||
| The Studied Tissue | Breast tissue | |||
| The Expression Level of Disease Section Compare with the Healthy Individual Tissue | p-value: 5.11E-15 Fold-change: 1.01E-01 Z-score: 8.22E+00 |
|||
| Experimental Note | Discovered Using In-vivo Testing Model | |||
| Cell Pathway Regulation | Steroid biosynthesis signaling pathway | Activation | hsa00100 | |
| Terpenoid bacKbone biosynthesis signaling pathway | Activation | hsa00900 | ||
| Steroid hormone biosynthesis signaling pathway | Activation | hsa00140 | ||
| In Vitro Model | MCF-10A-neoT cells | Breast | Homo sapiens (Human) | CVCL_5554 |
| In Vivo Model | SV40 C3TAg transgenic mouse model | Mus musculus | ||
| Experiment for Molecule Alteration |
Clariom D RNA profiling assay | |||
| Experiment for Drug Resistance |
MTT assay; Colony formation assay | |||
| Mechanism Description | Acquired resistance to fluvastatin is mediated by restorative upregulation of cholesterol biosynthesis pathway genes. | |||
Disease- and Tissue-specific Abundances of This Molecule
ICD Disease Classification 02

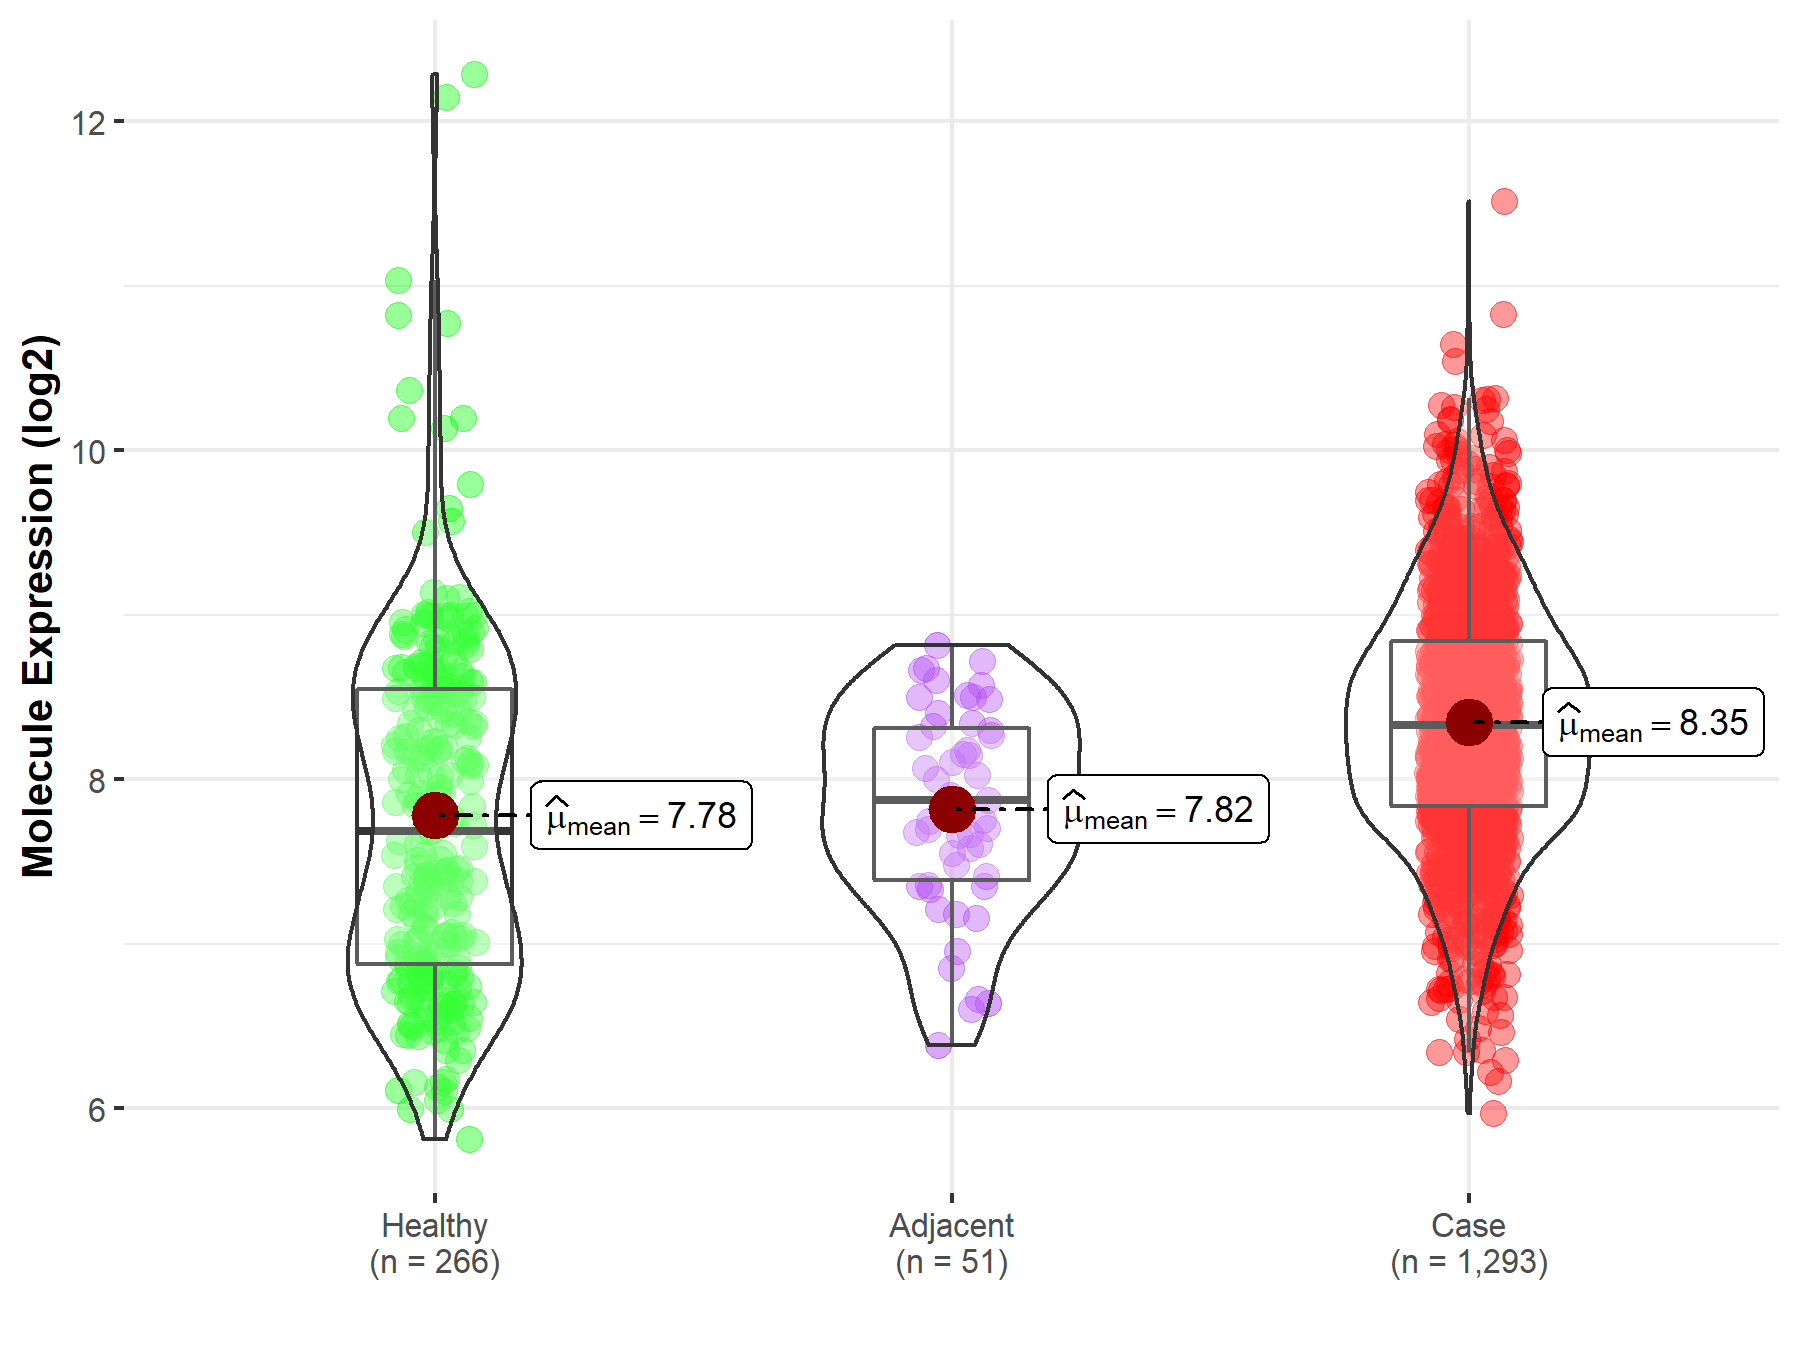
| Differential expression of molecule in resistant diseases | ||
| The Studied Tissue | Breast tissue | |
| The Specified Disease | Breast cancer | |
| The Expression Level of Disease Section Compare with the Healthy Individual Tissue | p-value: 5.11E-15; Fold-change: 6.45E-01; Z-score: 6.03E-01 | |
| The Expression Level of Disease Section Compare with the Adjacent Tissue | p-value: 1.91E-07; Fold-change: 4.57E-01; Z-score: 7.41E-01 | |
|
Molecule expression in the normal tissue adjacent to the diseased tissue of patients
Molecule expression in the diseased tissue of patients
Molecule expression in the normal tissue of healthy individuals
|
||
| Disease-specific Molecule Abundances |
|
Click to View the Clearer Original Diagram |
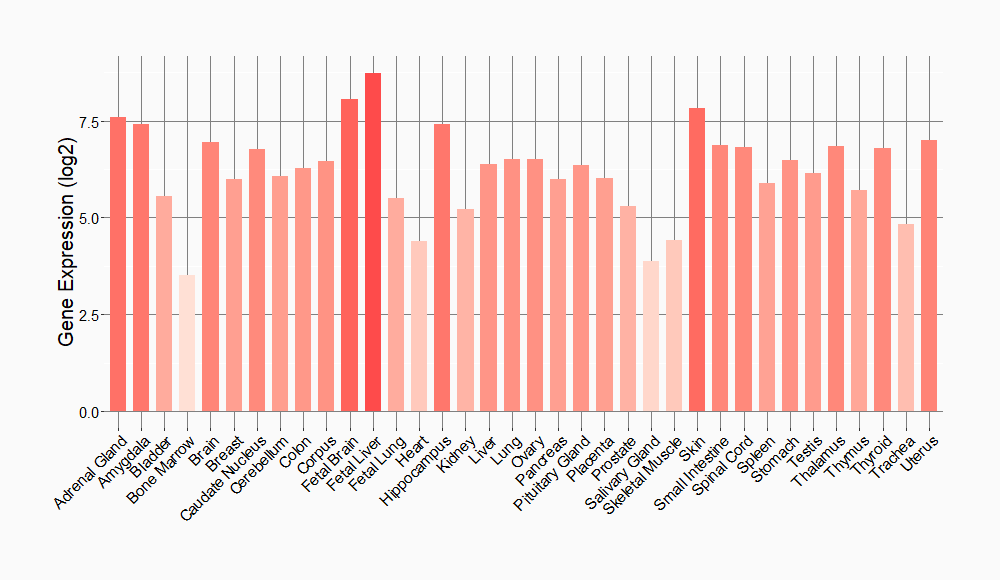
Tissue-specific Molecule Abundances in Healthy Individuals

|
||
References
If you find any error in data or bug in web service, please kindly report it to Dr. Sun and Dr. Yu.