Molecule Information
General Information of the Molecule (ID: Mol00641)
| Name |
Suppressor of cytokine signaling 6 (SOCS6)
,Homo sapiens
|
||||
|---|---|---|---|---|---|
| Synonyms |
SOCS-6; Cytokine-inducible SH2 protein 4; CIS-4; Suppressor of cytokine signaling 4; SOCS-4; CIS4; SOCS4
Click to Show/Hide
|
||||
| Molecule Type |
Protein
|
||||
| Gene Name |
SOCS6
|
||||
| Gene ID | |||||
| Location |
chr18:70289045-70330199[+]
|
||||
| Sequence |
MKKISLKTLRKSFNLNKSKEETDFMVVQQPSLASDFGKDDSLFGSCYGKDMASCDINGED
EKGGKNRSKSESLMGTLKRRLSAKQKSKGKAGTPSGSSADEDTFSSSSAPIVFKDVRAQR PIRSTSLRSHHYSPAPWPLRPTNSEETCIKMEVRVKALVHSSSPSPALNGVRKDFHDLQS ETTCQEQANSLKSSASHNGDLHLHLDEHVPVVIGLMPQDYIQYTVPLDEGMYPLEGSRSY CLDSSSPMEVSAVPPQVGGRAFPEDESQVDQDLVVAPEIFVDQSVNGLLIGTTGVMLQSP RAGHDDVPPLSPLLPPMQNNQIQRNFSGLTGTEAHVAESMRCHLNFDPNSAPGVARVYDS VQSSGPMVVTSLTEELKKLAKQGWYWGPITRWEAEGKLANVPDGSFLVRDSSDDRYLLSL SFRSHGKTLHTRIEHSNGRFSFYEQPDVEGHTSIVDLIEHSIRDSENGAFCYSRSRLPGS ATYPVRLTNPVSRFMQVRSLQYLCRFVIRQYTRIDLIQKLPLPNKMKDYLQEKHY Click to Show/Hide
|
||||
| 3D-structure |
|
||||
| Function |
SOCS family proteins form part of a classical negative feedback system that regulates cytokine signal transduction. May be a substrate recognition component of a SCF-like ECS (Elongin BC-CUL2/5-SOCS-box protein) E3 ubiquitin-protein ligase complex which mediates the ubiquitination and subsequent proteasomal degradation of target proteins (By similarity). Regulates KIT degradation by ubiquitination of the tyrosine-phosphorylated receptor.
Click to Show/Hide
|
||||
| Uniprot ID | |||||
| Ensembl ID | |||||
| HGNC ID | |||||
| Click to Show/Hide the Complete Species Lineage | |||||
Type(s) of Resistant Mechanism of This Molecule
 RTDM: Regulation by the Disease Microenvironment
 UAPP: Unusual Activation of Pro-survival Pathway
Drug Resistance Data Categorized by Drug
Approved Drug(s)
3 drug(s) in total
| Drug Sensitivity Data Categorized by Their Corresponding Mechanisms | ||||
|
Unusual Activation of Pro-survival Pathway (UAPP)
|
||||
| Disease Class: Hepatocellular cancer [ICD-11: 2C12.4] | [1] | |||
| Sensitive Disease | Hepatocellular cancer [ICD-11: 2C12.4] | |||
| Sensitive Drug | Fluorouracil | |||
| Molecule Alteration | Expression | Down-regulation |
||
| Differential expression of the molecule in resistant disease | ||||
| Classification of Disease | Liver cancer [ICD-11: 2C12] | |||
| The Specified Disease | Liver cancer | |||
| The Studied Tissue | Liver tissue | |||
| The Expression Level of Disease Section Compare with the Healthy Individual Tissue | p-value: 3.24E-04 Fold-change: -7.85E-02 Z-score: -3.85E+00 |
|||
| Experimental Note | Revealed Based on the Cell Line Data | |||
| Cell Pathway Regulation | Cell proliferation | Inhibition | hsa05200 | |
| miR183/IDH2/SOCS6/HIF1alpha feedback loop signaling pathway | Regulation | N.A. | ||
| In Vitro Model | BEL-7402 cells | Liver | Homo sapiens (Human) | CVCL_5492 |
| Experiment for Molecule Alteration |
Western blot analysis | |||
| Experiment for Drug Resistance |
MTT assay | |||
| Mechanism Description | IDH2 knockdown resulted in significantly increased HIF-1alpha expression in both BEL-7402 and BEL-7402/5-FU cells. knockdown of SOCS6 had similar but stronger effect as miR-183 in promoting MRP2, P-gp, p-STAT3 and HIF-1alpha expression in BEL-7402 cells, while SOCS6 overexpression also showed similar but stronger effect as miR-183 inhibition in reducing MRP2, P-gp, p-STAT3 and HIF-1alpha levels in BEL-7402/5-FU cells. Both SOCS6 overexpression and miR-183 knockdown significantly increased the sensitivity of BEL-7402/5-FU cells to 5-FU. miR-183 overexpression partly abrogated the effect of SOCS6 in enhancing 5-FU sensitivity. | |||
| Drug Resistance Data Categorized by Their Corresponding Mechanisms | ||||
|
Regulation by the Disease Microenvironment (RTDM)
|
||||
| Disease Class: Multiple myeloma [ICD-11: 2A83.0] | [2] | |||
| Resistant Disease | Multiple myeloma [ICD-11: 2A83.0] | |||
| Resistant Drug | Bortezomib | |||
| Molecule Alteration | Expression | Up-regulation |
||
| Experimental Note | Revealed Based on the Cell Line Data | |||
| In Vitro Model | NCI-H929 cells | Bone marrow | Homo sapiens (Human) | CVCL_1600 |
| Experiment for Molecule Alteration |
Western blot assay | |||
| Experiment for Drug Resistance |
MTT assay | |||
| Mechanism Description | In particular, the dynamic interaction between BM mesenchymal stem cells (BM-MSC) and MM cells has shown great relevance. Here we showed that inhibiting both PKC and NF-kappaB signalling pathways in BM-MSC reduced cell survival in the MM cell line H929 and increased its susceptibility to the proteasome inhibitor bortezomib. PKC-mediated cell survival inhibition and bortezomib susceptibility induction were better performed by the chimeric peptide HKPS than by the classical enzastaurin inhibitor, probably due to its greatest ability to inhibit cell adhesion and its increased capability to counteract the NF-kappaB-related signalling molecules increased by the co-cultivation of BM-MSC with H929 cells. Thus, inhibiting two coupled signalling molecules in BM-MSC was more effective in blocking the supportive cues emerging from the mesenchymal stroma. | |||
| Drug Resistance Data Categorized by Their Corresponding Mechanisms | ||||
|
Unusual Activation of Pro-survival Pathway (UAPP)
|
||||
| Disease Class: Breast cancer [ICD-11: 2C60.3] | [3] | |||
| Resistant Disease | Breast cancer [ICD-11: 2C60.3] | |||
| Resistant Drug | Tamoxifen | |||
| Molecule Alteration | Expression | Down-regulation |
||
| Experimental Note | Revealed Based on the Cell Line Data | |||
| Cell Pathway Regulation | Cell apoptosis | Inhibition | hsa04210 | |
| SOCS6/STAT3 signaling pathway | Regulation | N.A. | ||
| In Vitro Model | MCF-7 cells | Breast | Homo sapiens (Human) | CVCL_0031 |
| SkBR3 cells | Breast | Homo sapiens (Human) | CVCL_0033 | |
| Experiment for Molecule Alteration |
Western blot analysis | |||
| Experiment for Drug Resistance |
MTT assay | |||
| Mechanism Description | Inhibition of miR-155 sensitizes breast cancer cells to tamoxifen and SOCS6 sensitizes the cells to tamoxifen. | |||
Disease- and Tissue-specific Abundances of This Molecule
ICD Disease Classification 02

| Differential expression of molecule in resistant diseases | ||
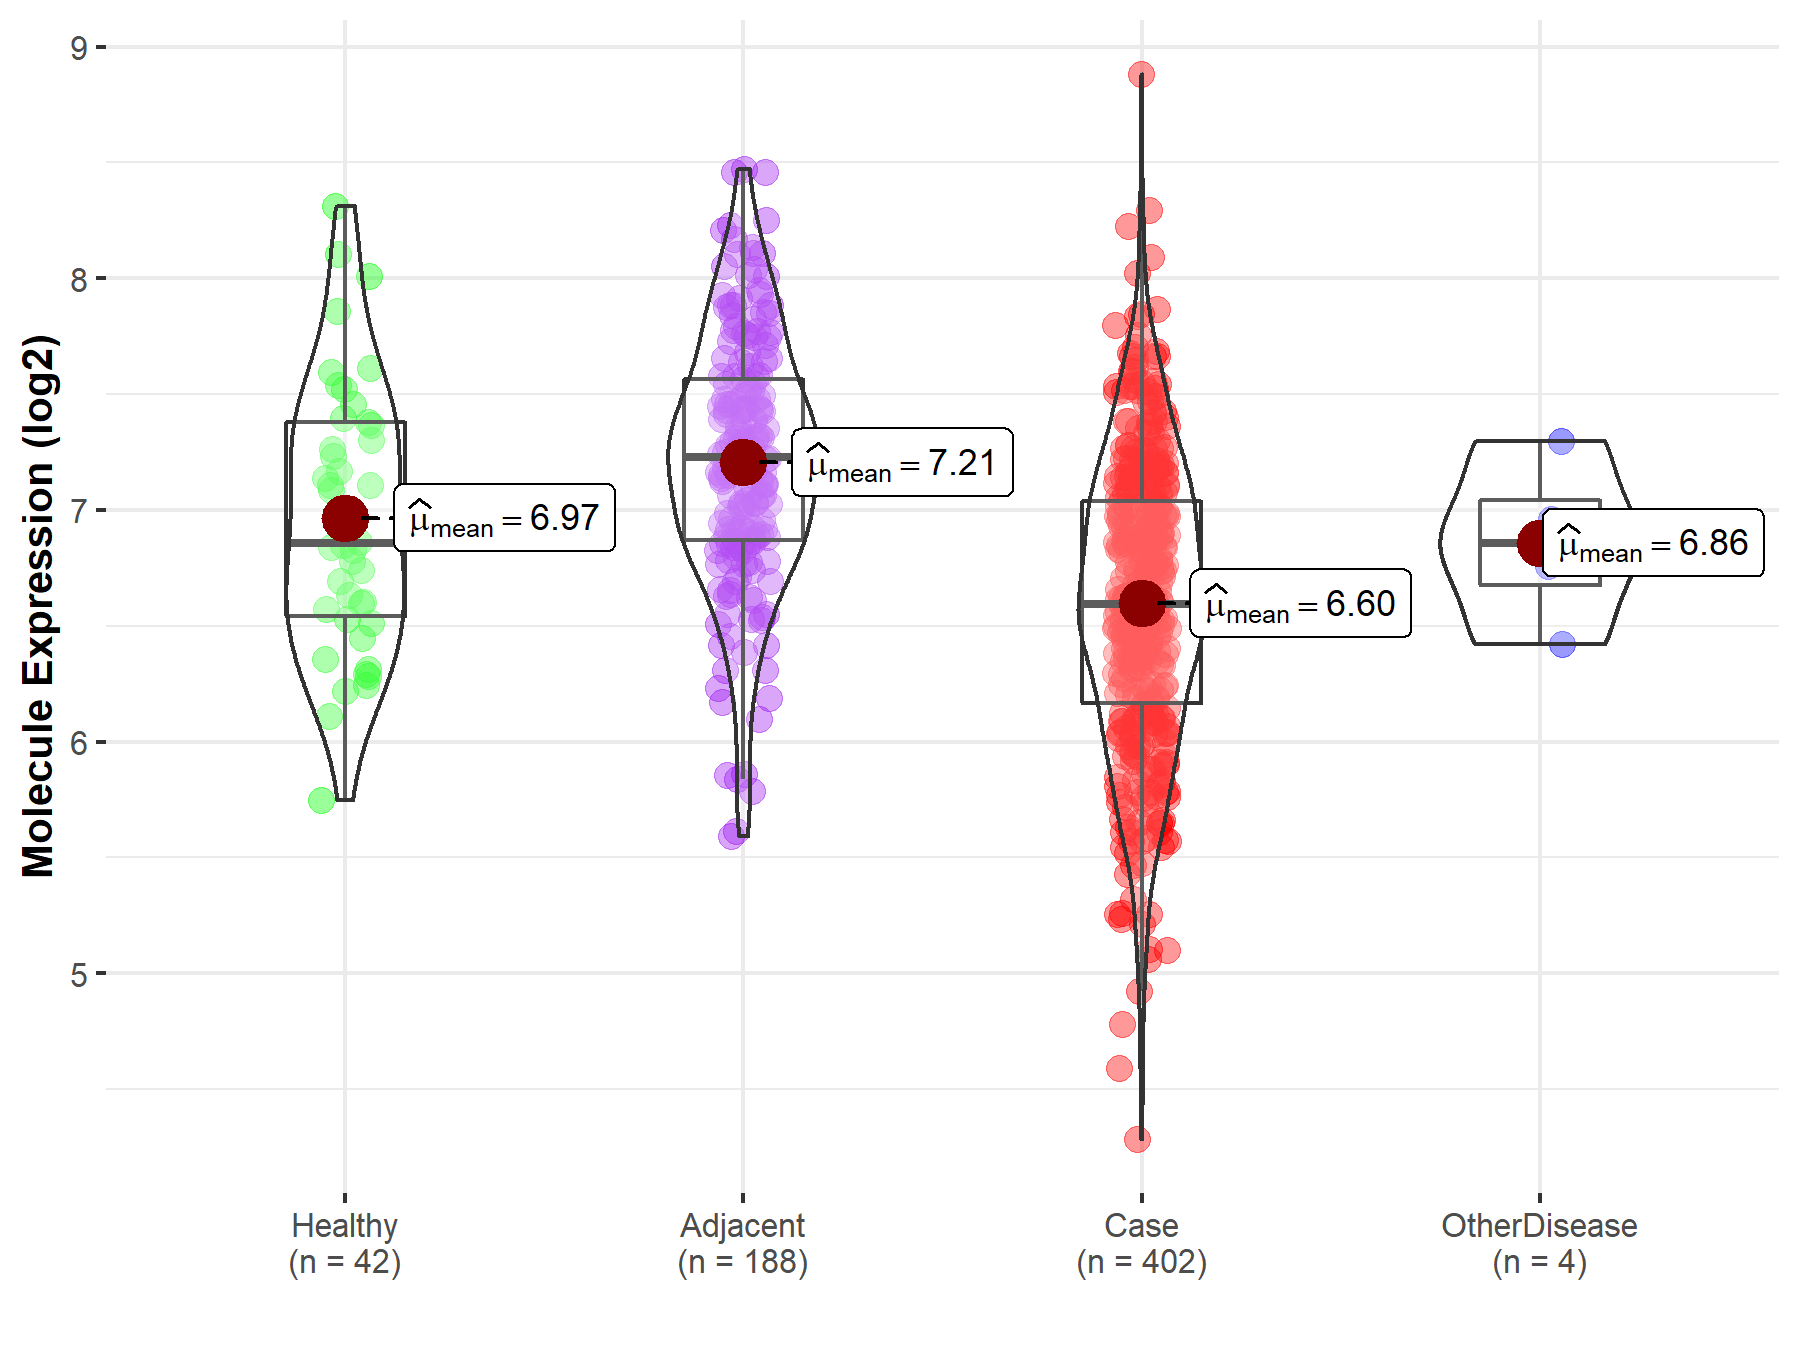
| The Studied Tissue | Liver | |
| The Specified Disease | Liver cancer | |
| The Expression Level of Disease Section Compare with the Healthy Individual Tissue | p-value: 3.24E-04; Fold-change: -2.63E-01; Z-score: -4.49E-01 | |
| The Expression Level of Disease Section Compare with the Adjacent Tissue | p-value: 8.46E-28; Fold-change: -6.33E-01; Z-score: -1.14E+00 | |
| The Expression Level of Disease Section Compare with the Other Disease Section | p-value: 2.52E-01; Fold-change: -2.65E-01; Z-score: -7.20E-01 | |
|
Molecule expression in the normal tissue adjacent to the diseased tissue of patients
Molecule expression in the diseased tissue of patients
Molecule expression in the normal tissue of healthy individuals
Molecule expression in tissue other than the diseased tissue of patients
|
||
| Disease-specific Molecule Abundances |
|
Click to View the Clearer Original Diagram |
| Differential expression of molecule in resistant diseases | ||
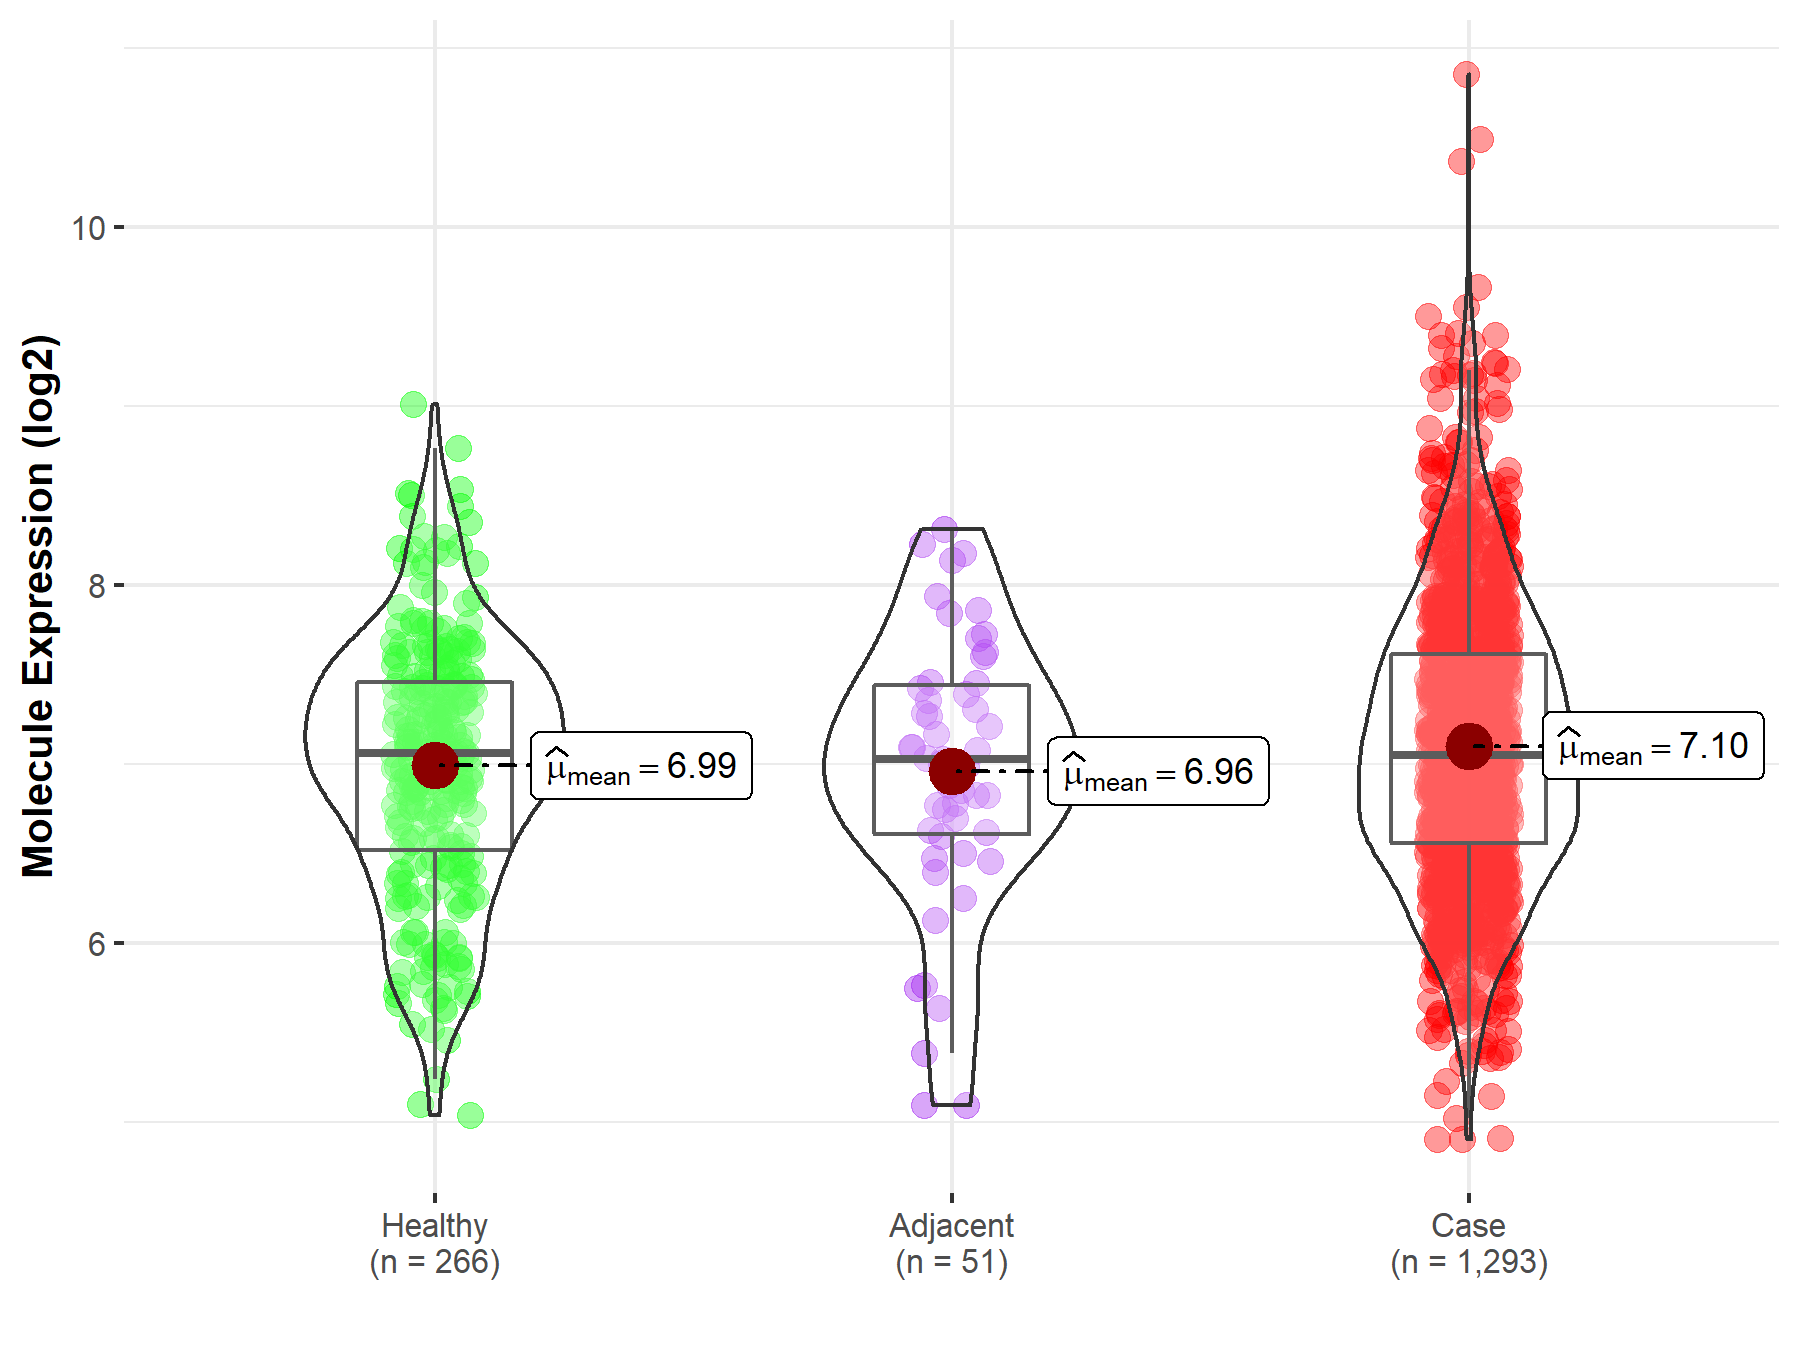
| The Studied Tissue | Breast tissue | |
| The Specified Disease | Breast cancer | |
| The Expression Level of Disease Section Compare with the Healthy Individual Tissue | p-value: 2.59E-02; Fold-change: -1.05E-02; Z-score: -1.46E-02 | |
| The Expression Level of Disease Section Compare with the Adjacent Tissue | p-value: 1.98E-01; Fold-change: 2.29E-02; Z-score: 2.99E-02 | |
|
Molecule expression in the normal tissue adjacent to the diseased tissue of patients
Molecule expression in the diseased tissue of patients
Molecule expression in the normal tissue of healthy individuals
|
||
| Disease-specific Molecule Abundances |
|
Click to View the Clearer Original Diagram |
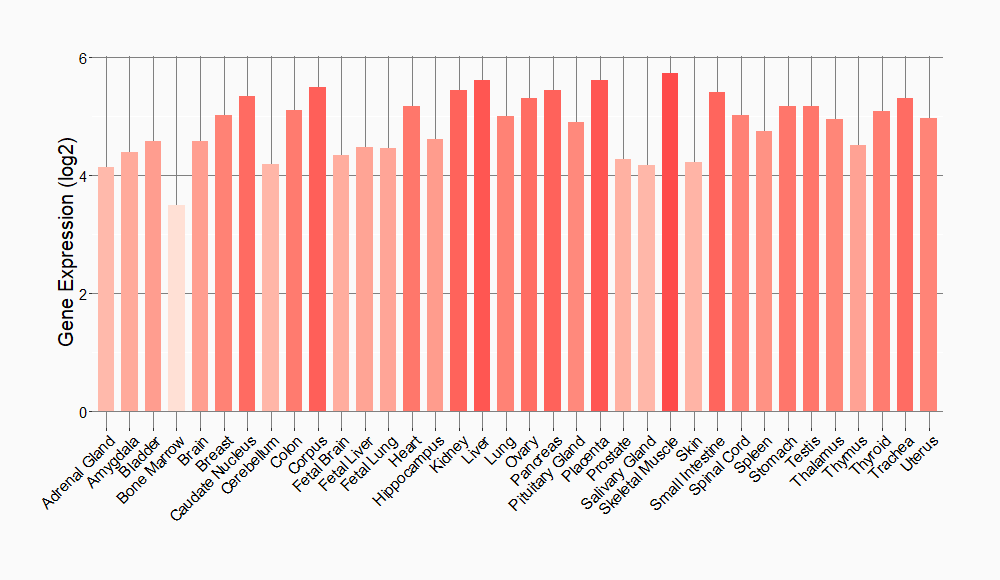
Tissue-specific Molecule Abundances in Healthy Individuals

|
||
References
If you find any error in data or bug in web service, please kindly report it to Dr. Sun and Dr. Yu.