Molecule Information
General Information of the Molecule (ID: Mol00627)
| Name |
Sialyltransferase St8Sia IV (SIAT8D)
,Homo sapiens
|
||||
|---|---|---|---|---|---|
| Synonyms |
Alpha-2;8-sialyltransferase 8D; Polysialyltransferase-1; Sialyltransferase 8D; SIAT8-D; Sialyltransferase St8Sia IV; ST8SiaIV; PST; PST1; SIAT8D
Click to Show/Hide
|
||||
| Molecule Type |
Protein
|
||||
| Gene Name |
ST8SIA4
|
||||
| Gene ID | |||||
| Location |
chr5:100806933-100903282[-]
|
||||
| Sequence |
MRSIRKRWTICTISLLLIFYKTKEIARTEEHQETQLIGDGELSLSRSLVNSSDKIIRKAG
SSIFQHNVEGWKINSSLVLEIRKNILRFLDAERDVSVVKSSFKPGDVIHYVLDRRRTLNI SHDLHSLLPEVSPMKNRRFKTCAVVGNSGILLDSECGKEIDSHNFVIRCNLAPVVEFAAD VGTKSDFITMNPSVVQRAFGGFRNESDREKFVHRLSMLNDSVLWIPAFMVKGGEKHVEWV NALILKNKLKVRTAYPSLRLIHAVRGYWLTNKVPIKRPSTGLLMYTLATRFCDEIHLYGF WPFPKDLNGKAVKYHYYDDLKYRYFSNASPHRMPLEFKTLNVLHNRGALKLTTGKCVKQ Click to Show/Hide
|
||||
| 3D-structure |
|
||||
| Function |
Catalyzes the polycondensation of alpha-2,8-linked sialic acid required for the synthesis of polysialic acid (PSA), which is present on the embryonic neural cell adhesion molecule (N-CAM), necessary for plasticity of neural cells.
Click to Show/Hide
|
||||
| Uniprot ID | |||||
| Ensembl ID | |||||
| HGNC ID | |||||
| Click to Show/Hide the Complete Species Lineage | |||||
Type(s) of Resistant Mechanism of This Molecule
 UAPP: Unusual Activation of Pro-survival Pathway
Drug Resistance Data Categorized by Drug
Approved Drug(s)
1 drug(s) in total
| Drug Sensitivity Data Categorized by Their Corresponding Mechanisms | ||||
|
Unusual Activation of Pro-survival Pathway (UAPP)
|
||||
| Disease Class: Chronic myeloid leukemia [ICD-11: 2A20.0] | [1] | |||
| Sensitive Disease | Chronic myeloid leukemia [ICD-11: 2A20.0] | |||
| Sensitive Drug | Doxorubicin | |||
| Molecule Alteration | Expression | Down-regulation |
||
| Experimental Note | Identified from the Human Clinical Data | |||
| Cell Pathway Regulation | Cell proliferation | Inhibition | hsa05200 | |
| PI3K/AKT signaling pathway | Inhibition | hsa04151 | ||
| In Vitro Model | K562 cells | Blood | Homo sapiens (Human) | CVCL_0004 |
| Ku812 cells | Bone marrow | Homo sapiens (Human) | CVCL_0379 | |
| kCL22 cells | Pleural effusion | Homo sapiens (Human) | CVCL_2091 | |
| Experiment for Molecule Alteration |
Western blot analysis | |||
| Experiment for Drug Resistance |
CCK8 assay | |||
| Mechanism Description | miR-181c directly targeted and inhibited the ST8SIA4 expression, as well as miR-181c was inversely correlated with the levels of ST8SIA4 expression in CML cell lines and samples. Moreover, ST8SIA4 could reverse the effect of miR-181c on drug resistance in k562 and k562/ADR cells in vitro. Upregulation of miR-181c sensitized k562/ADR cells to adriamycin in vivo through directly suppressing ST8SIA4 expression. Further investigation showed that miR-181c mediated the activity of phosphoinositide-3 kinase (PI3k)/AkT signal pathway, and inhibition of PI3k/Akt in k562 cells counteracted miR-181c-mediated MDR phenotype. | |||
Disease- and Tissue-specific Abundances of This Molecule
ICD Disease Classification 02

| Differential expression of molecule in resistant diseases | ||
| The Studied Tissue | Whole blood | |
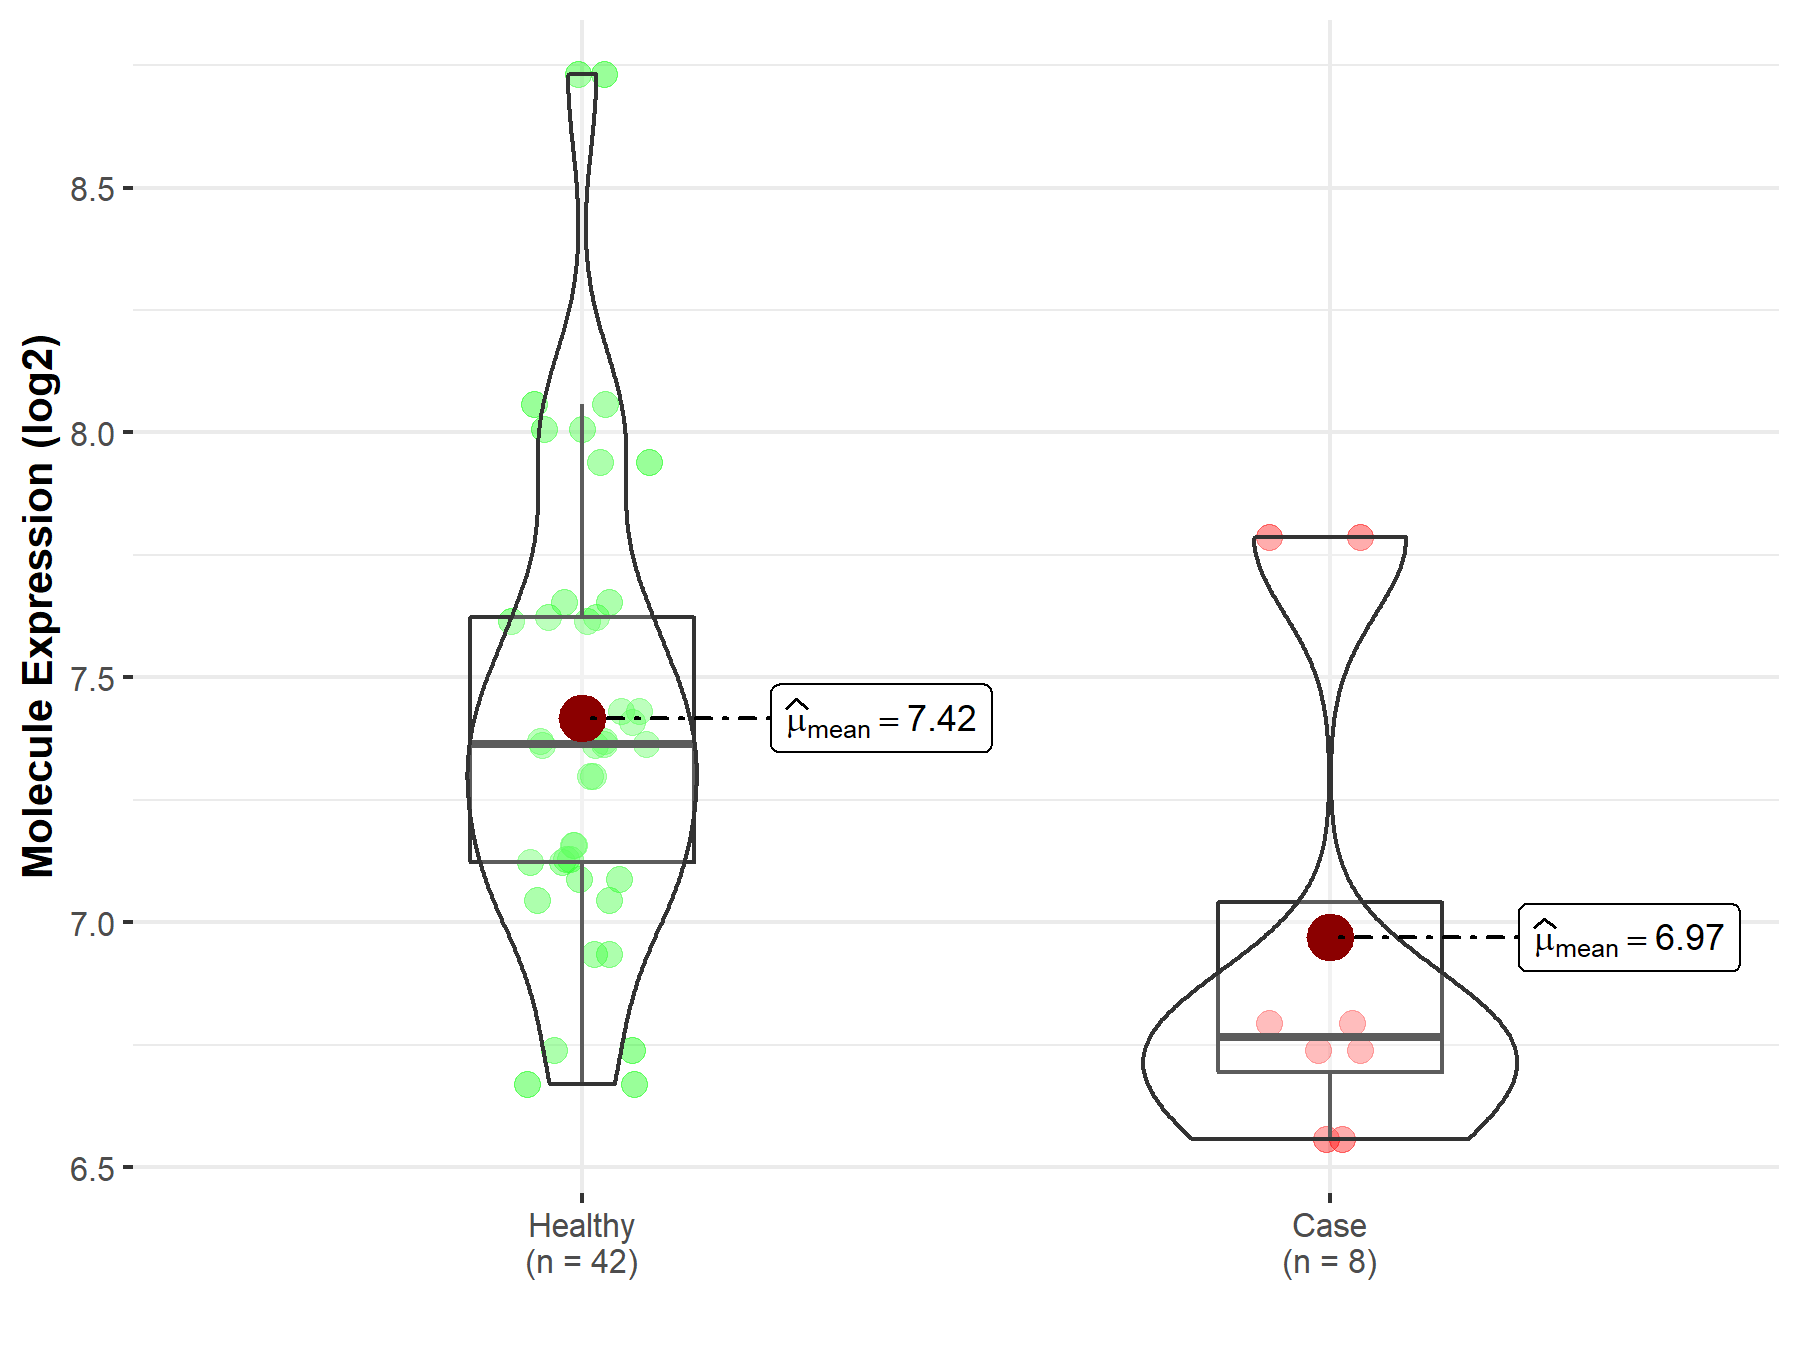
| The Specified Disease | Myelofibrosis | |
| The Expression Level of Disease Section Compare with the Healthy Individual Tissue | p-value: 4.67E-02; Fold-change: -5.98E-01; Z-score: -1.26E+00 | |
|
Molecule expression in the diseased tissue of patients
Molecule expression in the normal tissue of healthy individuals
|
||
| Disease-specific Molecule Abundances |
|
Click to View the Clearer Original Diagram |
| The Studied Tissue | Whole blood | |
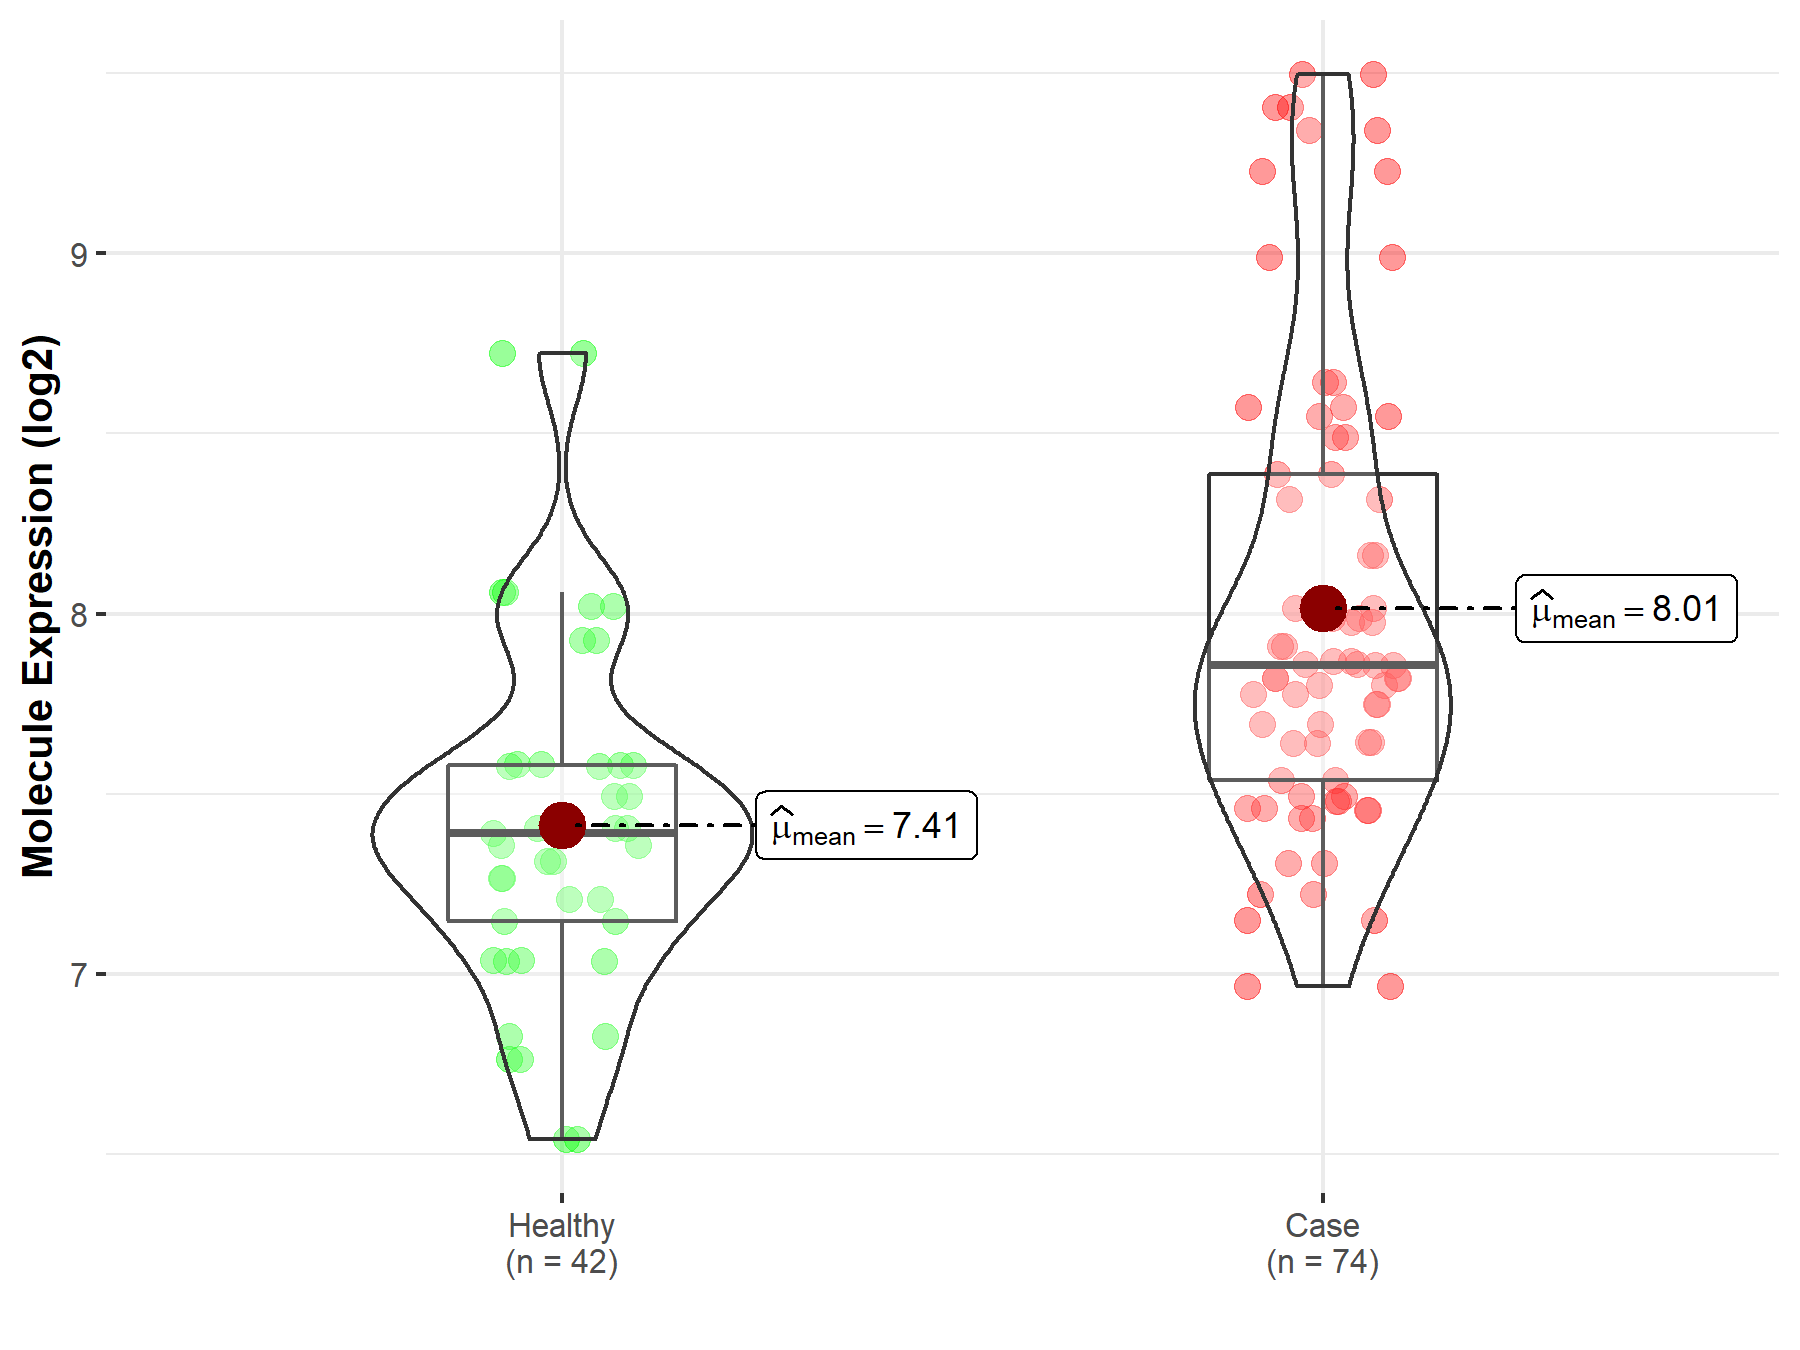
| The Specified Disease | Polycythemia vera | |
| The Expression Level of Disease Section Compare with the Healthy Individual Tissue | p-value: 1.23E-07; Fold-change: 4.64E-01; Z-score: 9.58E-01 | |
|
Molecule expression in the diseased tissue of patients
Molecule expression in the normal tissue of healthy individuals
|
||
| Disease-specific Molecule Abundances |
|
Click to View the Clearer Original Diagram |
Tissue-specific Molecule Abundances in Healthy Individuals

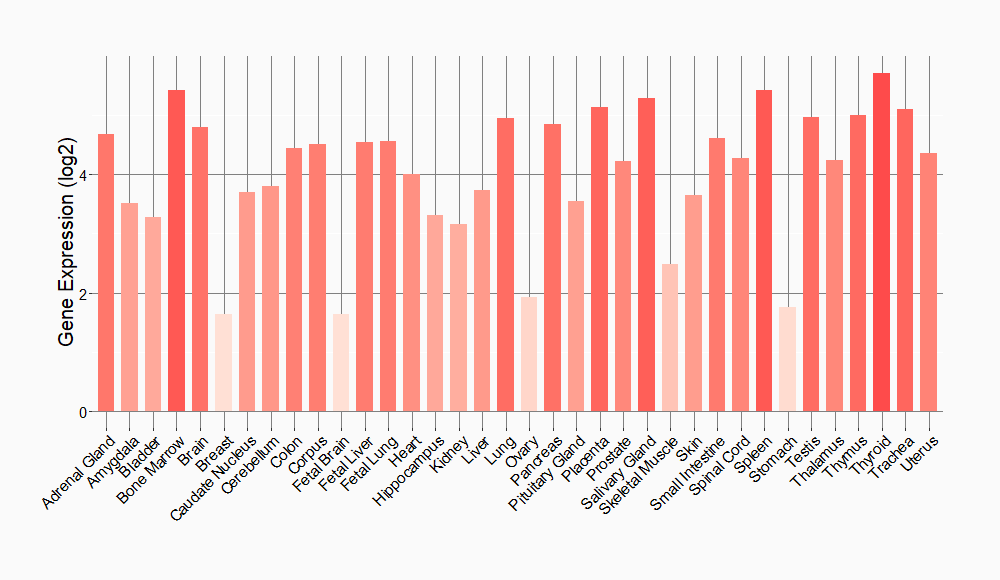
|
||
References
If you find any error in data or bug in web service, please kindly report it to Dr. Sun and Dr. Yu.