Molecule Information
General Information of the Molecule (ID: Mol00486)
| Name |
Mitogen-activated protein kinase kinase kinase 8 (MAP3K8)
,Homo sapiens
|
||||
|---|---|---|---|---|---|
| Synonyms |
Cancer Osaka thyroid oncogene; Proto-oncogene c-Cot; Serine/threonine-protein kinase cot; Tumor progression locus 2; TPL-2; COT; ESTF
Click to Show/Hide
|
||||
| Molecule Type |
Protein
|
||||
| Gene Name |
MAP3K8
|
||||
| Gene ID | |||||
| Location |
chr10:30434021-30461833[+]
|
||||
| Sequence |
MEYMSTGSDNKEEIDLLIKHLNVSDVIDIMENLYASEEPAVYEPSLMTMCQDSNQNDERS
KSLLLSGQEVPWLSSVRYGTVEDLLAFANHISNTAKHFYGQRPQESGILLNMVITPQNGR YQIDSDVLLIPWKLTYRNIGSDFIPRGAFGKVYLAQDIKTKKRMACKLIPVDQFKPSDVE IQACFRHENIAELYGAVLWGETVHLFMEAGEGGSVLEKLESCGPMREFEIIWVTKHVLKG LDFLHSKKVIHHDIKPSNIVFMSTKAVLVDFGLSVQMTEDVYFPKDLRGTEIYMSPEVIL CRGHSTKADIYSLGATLIHMQTGTPPWVKRYPRSAYPSYLYIIHKQAPPLEDIADDCSPG MRELIEASLERNPNHRPRAADLLKHEALNPPREDQPRCQSLDSALLERKRLLSRKELELP ENIADSSCTGSTEESEMLKRQRSLYIDLGALAGYFNLVRGPPTLEYG Click to Show/Hide
|
||||
| 3D-structure |
|
||||
| Function |
Required for lipopolysaccharide (LPS)-induced, TLR4-mediated activation of the MAPK/ERK pathway in macrophages, thus being critical for production of the proinflammatory cytokine TNF-alpha (TNF) during immune responses. Involved in the regulation of T-helper cell differentiation and IFNG expression in T-cells. Involved in mediating host resistance to bacterial infection through negative regulation of type I interferon (IFN) production. In vitro, activates MAPK/ERK pathway in response to IL1 in an IRAK1-independent manner, leading to up-regulation of IL8 and CCL4. Transduces CD40 and TNFRSF1A signals that activate ERK in B-cells and macrophages, and thus may play a role in the regulation of immunoglobulin production. May also play a role in the transduction of TNF signals that activate JNK and NF-kappa-B in some cell types. In adipocytes, activates MAPK/ERK pathway in an IKBKB-dependent manner in response to IL1B and TNF, but not insulin, leading to induction of lipolysis. Plays a role in the cell cycle. Isoform 1 shows some transforming activity, although it is much weaker than that of the activated oncogenic variant.
Click to Show/Hide
|
||||
| Uniprot ID | |||||
| Ensembl ID | |||||
| HGNC ID | |||||
| Click to Show/Hide the Complete Species Lineage | |||||
Type(s) of Resistant Mechanism of This Molecule
 EADR: Epigenetic Alteration of DNA, RNA or Protein
 UAPP: Unusual Activation of Pro-survival Pathway
Drug Resistance Data Categorized by Drug
Approved Drug(s)
3 drug(s) in total
| Drug Sensitivity Data Categorized by Their Corresponding Mechanisms | ||||
|
Epigenetic Alteration of DNA, RNA or Protein (EADR)
|
||||
| Disease Class: Diffuse large B-cell lymphoma [ICD-11: 2A81.0] | [1] | |||
| Sensitive Disease | Diffuse large B-cell lymphoma [ICD-11: 2A81.0] | |||
| Sensitive Drug | Cisplatin | |||
| Molecule Alteration | Expression | Up-regulation |
||
| Experimental Note | Identified from the Human Clinical Data | |||
| Cell Pathway Regulation | Cell apoptosis | Inhibition | hsa04210 | |
| Cell proliferation | Activation | hsa05200 | ||
| MAPK/BCR/PI signaling pathway | Regulation | N.A. | ||
| In Vitro Model | ECA-109 cells | Esophagus | Homo sapiens (Human) | CVCL_6898 |
| TE-1 cells | Esophagus | Homo sapiens (Human) | CVCL_1759 | |
| 293T cells | Breast | Homo sapiens (Human) | CVCL_0063 | |
| EC9706 cells | Esophagus | Homo sapiens (Human) | CVCL_E307 | |
| KYSE150 cells | Esophagus | Homo sapiens (Human) | CVCL_1348 | |
| Experiment for Molecule Alteration |
qPCR | |||
| Experiment for Drug Resistance |
CCK8, colony formation, Transwell, and sphere-forming assay | |||
| Mechanism Description | miR370-3p, miR381-3p, and miR409-3p miRNAs appear to be the most potent regulators of the MAPk, BCR, and PI signaling system. Overexpression of miR370-3p, miR381-3p, and miR409-3p increases sensitivity to rituximab and doxorubicin. | |||
| Drug Sensitivity Data Categorized by Their Corresponding Mechanisms | ||||
|
Unusual Activation of Pro-survival Pathway (UAPP)
|
||||
| Disease Class: Diffuse large B-cell lymphoma [ICD-11: 2A81.0] | [2] | |||
| Sensitive Disease | Diffuse large B-cell lymphoma [ICD-11: 2A81.0] | |||
| Sensitive Drug | Doxorubicin | |||
| Molecule Alteration | Expression | Down-regulation |
||
| Experimental Note | Identified from the Human Clinical Data | |||
| Cell Pathway Regulation | MAPK/BCR/PI signaling pathway | Regulation | N.A. | |
| In Vitro Model | SUDHL-4 cells | Peritoneal effusion | Homo sapiens (Human) | CVCL_0539 |
| Experiment for Molecule Alteration |
qRT-PCR | |||
| Experiment for Drug Resistance |
CellTiter-Blue Cell Viability assay | |||
| Mechanism Description | miR370-3p, miR381-3p, and miR409-3p miRNAs appear to be the most potent regulators of the MAPk, BCR, and PI signaling system. Overexpression of miR370-3p, miR381-3p, and miR409-3p increases sensitivity to rituximab and doxorubicin. | |||
| Drug Sensitivity Data Categorized by Their Corresponding Mechanisms | ||||
|
Unusual Activation of Pro-survival Pathway (UAPP)
|
||||
| Disease Class: Diffuse large B-cell lymphoma [ICD-11: 2A81.0] | [2] | |||
| Sensitive Disease | Diffuse large B-cell lymphoma [ICD-11: 2A81.0] | |||
| Sensitive Drug | Rituximab | |||
| Molecule Alteration | Expression | Down-regulation |
||
| Experimental Note | Identified from the Human Clinical Data | |||
| Cell Pathway Regulation | Cell apoptosis | Inhibition | hsa04210 | |
| Cell proliferation | Activation | hsa05200 | ||
| MAPK/BCR/PI signaling pathway | Regulation | N.A. | ||
| In Vitro Model | SUDHL-4 cells | Peritoneal effusion | Homo sapiens (Human) | CVCL_0539 |
| Experiment for Molecule Alteration |
qRT-PCR | |||
| Experiment for Drug Resistance |
CellTiter-Blue Cell Viability assay | |||
| Mechanism Description | miR370-3p, miR381-3p, and miR409-3p miRNAs appear to be the most potent regulators of the MAPk, BCR, and PI signaling system. Overexpression of miR370-3p, miR381-3p, and miR409-3p increases sensitivity to rituximab and doxorubicin. | |||
Disease- and Tissue-specific Abundances of This Molecule
ICD Disease Classification 02

| Differential expression of molecule in resistant diseases | ||
| The Studied Tissue | Esophagus | |
| The Specified Disease | Esophageal cancer | |
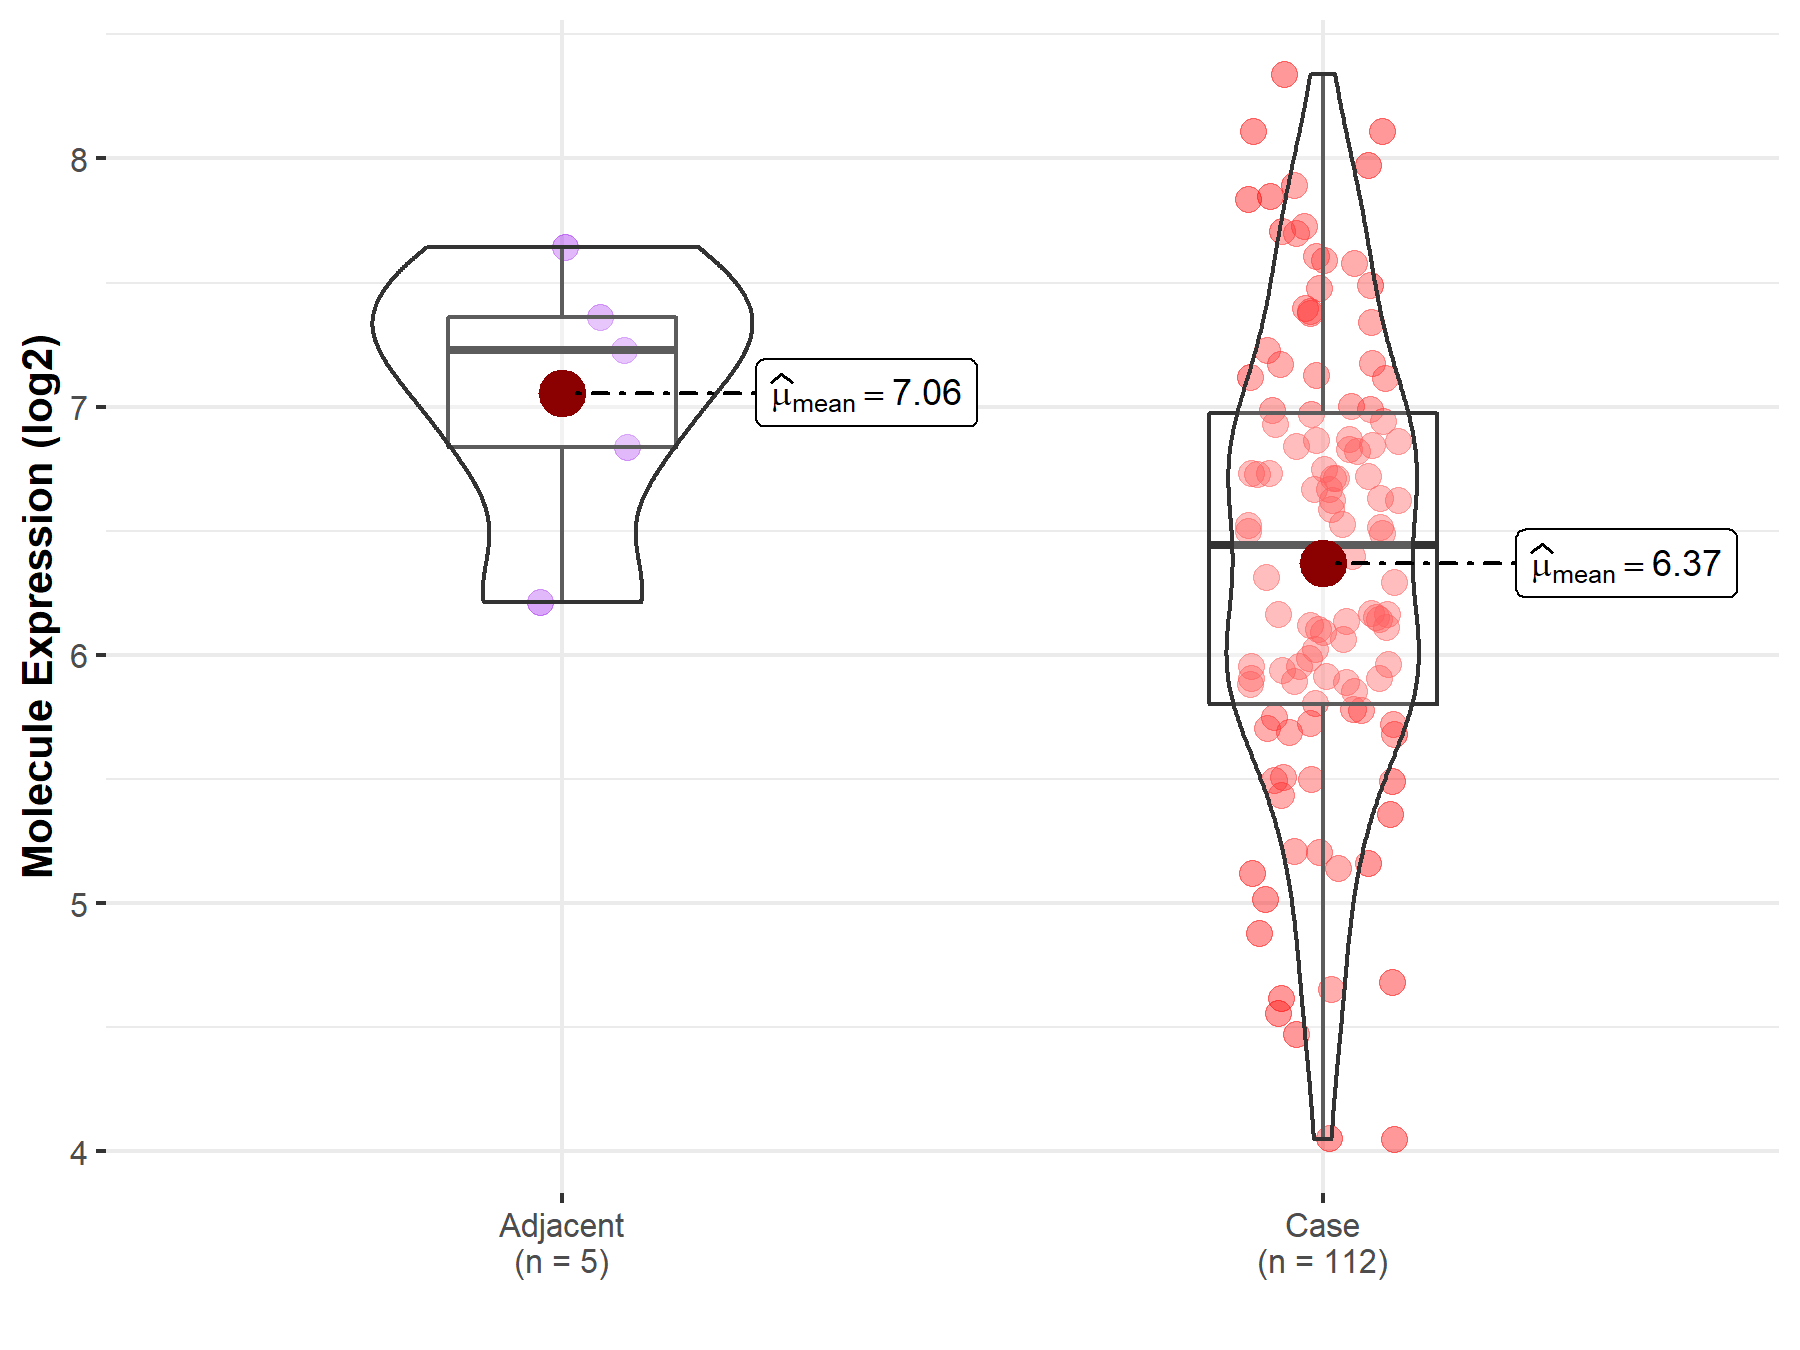
| The Expression Level of Disease Section Compare with the Adjacent Tissue | p-value: 4.70E-02; Fold-change: -7.83E-01; Z-score: -1.41E+00 | |
|
Molecule expression in the normal tissue adjacent to the diseased tissue of patients
Molecule expression in the diseased tissue of patients
|
||
| Disease-specific Molecule Abundances |
|
Click to View the Clearer Original Diagram |
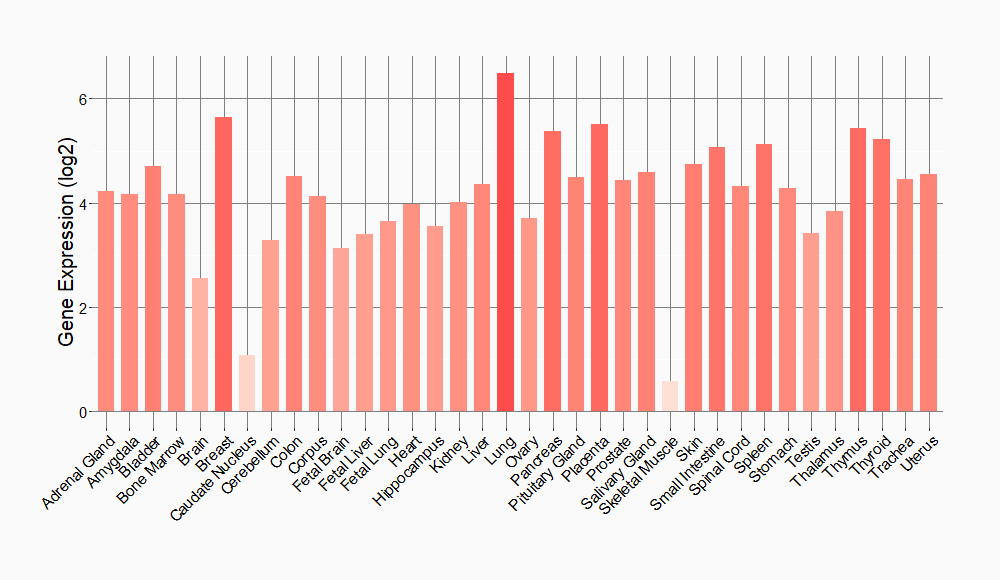
Tissue-specific Molecule Abundances in Healthy Individuals

|
||
References
If you find any error in data or bug in web service, please kindly report it to Dr. Sun and Dr. Yu.