Molecule Information
General Information of the Molecule (ID: Mol00484)
| Name |
Mitogen-activated protein kinase kinase kinase 1 (MAP3K1)
,Homo sapiens
|
||||
|---|---|---|---|---|---|
| Synonyms |
MAPK/ERK kinase kinase 1; MEK kinase 1; MEKK 1; MAPKKK1; MEKK; MEKK1
Click to Show/Hide
|
||||
| Molecule Type |
Protein
|
||||
| Gene Name |
MAP3K1
|
||||
| Gene ID | |||||
| Location |
chr5:56815549-56896152[+]
|
||||
| Sequence |
MAAAAGNRASSSGFPGARATSPEAGGGGGALKASSAPAAAAGLLREAGSGGRERADWRRR
QLRKVRSVELDQLPEQPLFLAASPPASSTSPSPEPADAAGSGTGFQPVAVPPPHGAASRG GAHLTESVAAPDSGASSPAAAEPGEKRAPAAEPSPAAAPAGREMENKETLKGLHKMDDRP EERMIREKLKATCMPAWKHEWLERRNRRGPVVVKPIPVKGDGSEMNHLAAESPGEVQASA ASPASKGRRSPSPGNSPSGRTVKSESPGVRRKRVSPVPFQSGRITPPRRAPSPDGFSPYS PEETNRRVNKVMRARLYLLQQIGPNSFLIGGDSPDNKYRVFIGPQNCSCARGTFCIHLLF VMLRVFQLEPSDPMLWRKTLKNFEVESLFQKYHSRRSSRIKAPSRNTIQKFVSRMSNSHT LSSSSTSTSSSENSIKDEEEQMCPICLLGMLDEESLTVCEDGCRNKLHHHCMSIWAEECR RNREPLICPLCRSKWRSHDFYSHELSSPVDSPSSLRAAQQQTVQQQPLAGSRRNQESNFN LTHYGTQQIPPAYKDLAEPWIQVFGMELVGCLFSRNWNVREMALRRLSHDVSGALLLANG ESTGNSGGSSGSSPSGGATSGSSQTSISGDVVEACCSVLSMVCADPVYKVYVAALKTLRA MLVYTPCHSLAERIKLQRLLQPVVDTILVKCADANSRTSQLSISTLLELCKGQAGELAVG REILKAGSIGIGGVDYVLNCILGNQTESNNWQELLGRLCLIDRLLLEFPAEFYPHIVSTD VSQAEPVEIRYKKLLSLLTFALQSIDNSHSMVGKLSRRIYLSSARMVTTVPHVFSKLLEM LSVSSSTHFTRMRRRLMAIADEVEIAEAIQLGVEDTLDGQQDSFLQASVPNNYLETTENS SPECTVHLEKTGKGLCATKLSASSEDISERLASISVGPSSSTTTTTTTTEQPKPMVQTKG RPHSQCLNSSPLSHHSQLMFPALSTPSSSTPSVPAGTATDVSKHRLQGFIPCRIPSASPQ TQRKFSLQFHRNCPENKDSDKLSPVFTQSRPLPSSNIHRPKPSRPTPGNTSKQGDPSKNS MTLDLNSSSKCDDSFGCSSNSSNAVIPSDETVFTPVEEKCRLDVNTELNSSIEDLLEASM PSSDTTVTFKSEVAVLSPEKAENDDTYKDDVNHNQKCKEKMEAEEEEALAIAMAMSASQD ALPIVPQLQVENGEDIIIIQQDTPETLPGHTKAKQPYREDTEWLKGQQIGLGAFSSCYQA QDVGTGTLMAVKQVTYVRNTSSEQEEVVEALREEIRMMSHLNHPNIIRMLGATCEKSNYN LFIEWMAGGSVAHLLSKYGAFKESVVINYTEQLLRGLSYLHENQIIHRDVKGANLLIDST GQRLRIADFGAAARLASKGTGAGEFQGQLLGTIAFMAPEVLRGQQYGRSCDVWSVGCAII EMACAKPPWNAEKHSNHLALIFKIASATTAPSIPSHLSPGLRDVALRCLELQPQDRPPSR ELLKHPVFRTTW Click to Show/Hide
|
||||
| 3D-structure |
|
||||
| Function |
Component of a protein kinase signal transduction cascade. Activates the ERK and JNK kinase pathways by phosphorylation of MAP2K1 and MAP2K4. May phosphorylate the MAPK8/JNK1 kinase. Activates CHUK and IKBKB, the central protein kinases of the NF-kappa-B pathway.
Click to Show/Hide
|
||||
| Uniprot ID | |||||
| Ensembl ID | |||||
| HGNC ID | |||||
| Click to Show/Hide the Complete Species Lineage | |||||
Type(s) of Resistant Mechanism of This Molecule
 UAPP: Unusual Activation of Pro-survival Pathway
Drug Resistance Data Categorized by Drug
Approved Drug(s)
1 drug(s) in total
| Drug Sensitivity Data Categorized by Their Corresponding Mechanisms | ||||
|
Unusual Activation of Pro-survival Pathway (UAPP)
|
||||
| Disease Class: Breast cancer [ICD-11: 2C60.3] | [1] | |||
| Sensitive Disease | Breast cancer [ICD-11: 2C60.3] | |||
| Sensitive Drug | Doxorubicin | |||
| Molecule Alteration | Expression | Down-regulation |
||
| Experimental Note | Revealed Based on the Cell Line Data | |||
| Cell Pathway Regulation | Cell proliferation | Inhibition | hsa05200 | |
| ERK signaling pathway | Regulation | N.A. | ||
| In Vitro Model | MCF-7 cells | Breast | Homo sapiens (Human) | CVCL_0031 |
| Experiment for Molecule Alteration |
Western blot analysis | |||
| Experiment for Drug Resistance |
MTS assay | |||
| Mechanism Description | MAP/ERk kinase kinase 1 (MEkk1) as a direct and functional target of miR-302. miR-302 showed combinatorial effects on MkEE1 repression and MEkk1-mediated ERk pathway. The suppression of P-gp by miR-302 was reversed by MEkk1 overexpression. miR-302 cooperatively sensitizes breast cancer cells to adriamycin via suppressing P-glycoprotein by targeting MEkk1 of ERk pathway. | |||
Disease- and Tissue-specific Abundances of This Molecule
ICD Disease Classification 02

| Differential expression of molecule in resistant diseases | ||
| The Studied Tissue | Breast tissue | |
| The Specified Disease | Breast cancer | |
| The Expression Level of Disease Section Compare with the Healthy Individual Tissue | p-value: 9.58E-01; Fold-change: -8.25E-02; Z-score: -1.24E-01 | |
| The Expression Level of Disease Section Compare with the Adjacent Tissue | p-value: 1.72E-03; Fold-change: 3.66E-01; Z-score: 4.65E-01 | |
|
Molecule expression in the normal tissue adjacent to the diseased tissue of patients
Molecule expression in the diseased tissue of patients
Molecule expression in the normal tissue of healthy individuals
|
||
| Disease-specific Molecule Abundances |
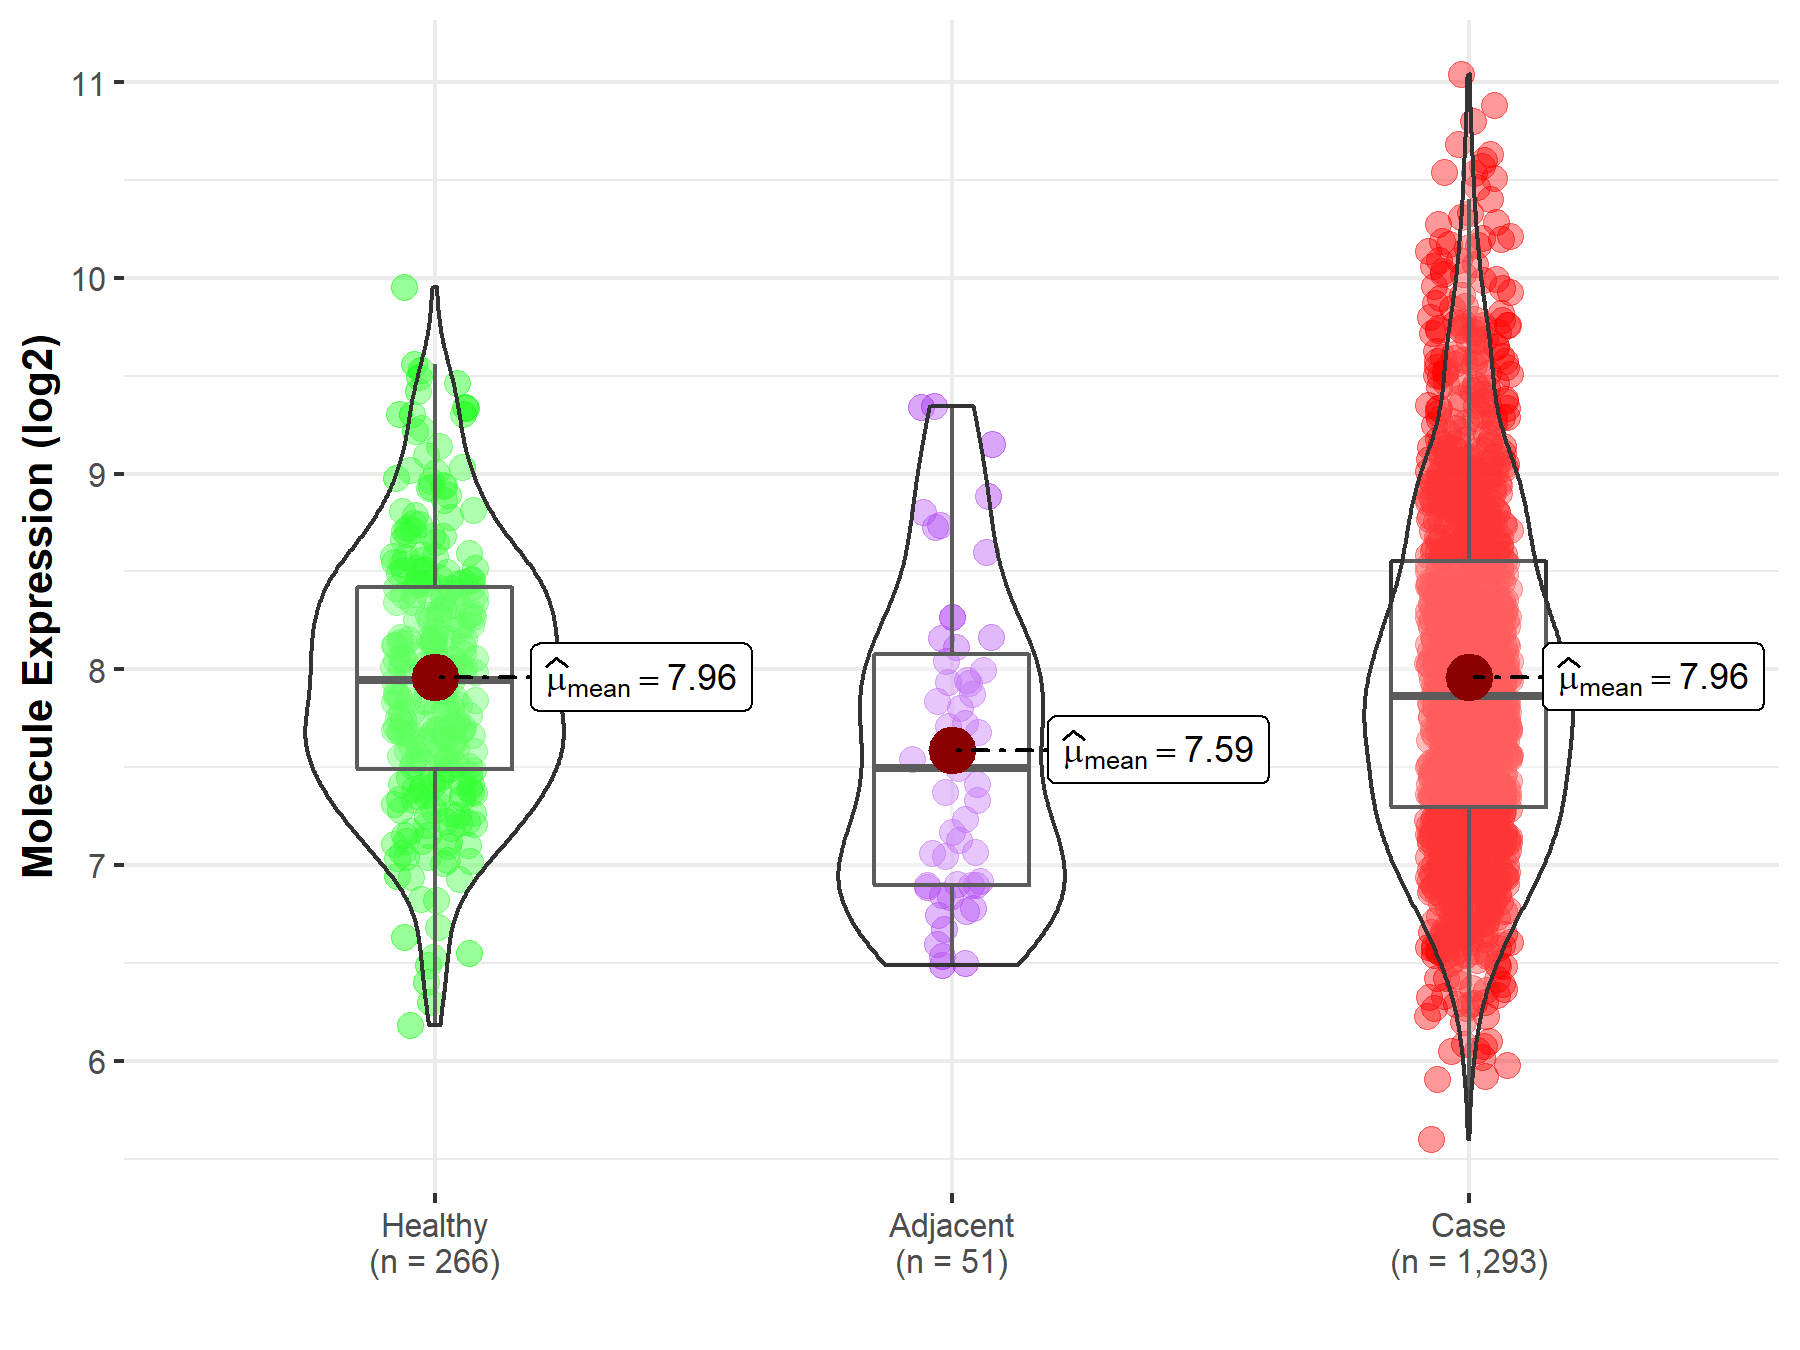
|
Click to View the Clearer Original Diagram |
Tissue-specific Molecule Abundances in Healthy Individuals

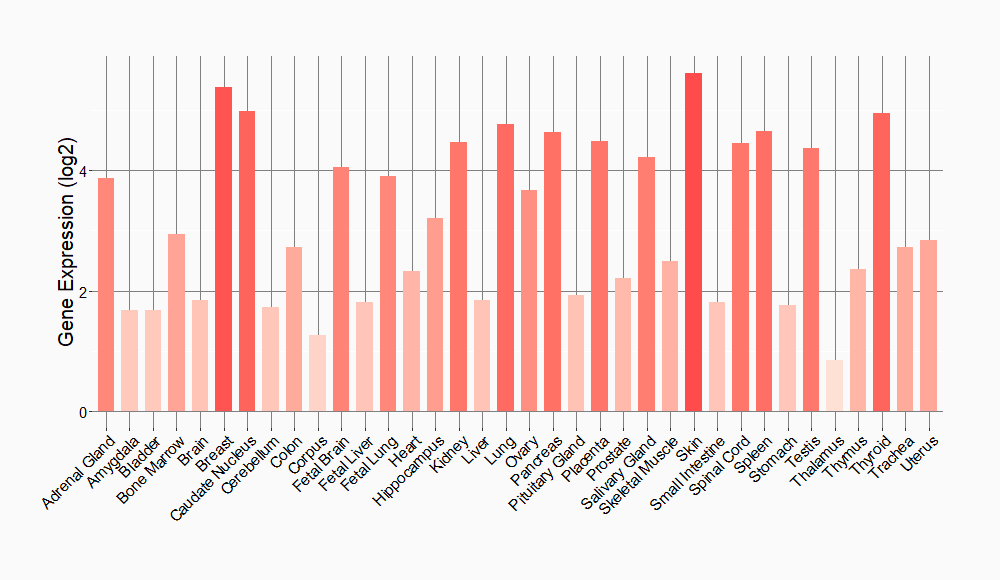
|
||
References
If you find any error in data or bug in web service, please kindly report it to Dr. Sun and Dr. Yu.