Molecule Information
General Information of the Molecule (ID: Mol00395)
| Name |
Growth factor receptor-bound protein 2 (GRB2)
,Homo sapiens
|
||||
|---|---|---|---|---|---|
| Synonyms |
Adapter protein GRB2; Protein Ash; SH2/SH3 adapter GRB2; ASH
Click to Show/Hide
|
||||
| Molecule Type |
Protein
|
||||
| Gene Name |
GRB2
|
||||
| Gene ID | |||||
| Location |
chr17:75318076-75405709[-]
|
||||
| Sequence |
MEAIAKYDFKATADDELSFKRGDILKVLNEECDQNWYKAELNGKDGFIPKNYIEMKPHPW
FFGKIPRAKAEEMLSKQRHDGAFLIRESESAPGDFSLSVKFGNDVQHFKVLRDGAGKYFL WVVKFNSLNELVDYHRSTSVSRNQQIFLRDIEQVPQQPTYVQALFDFDPQEDGELGFRRG DFIHVMDNSDPNWWKGACHGQTGMFPRNYVTPVNRNV Click to Show/Hide
|
||||
| 3D-structure |
|
||||
| Function |
Adapter protein that provides a critical link between cell surface growth factor receptors and the Ras signaling pathway.
Click to Show/Hide
|
||||
| Uniprot ID | |||||
| Ensembl ID | |||||
| HGNC ID | |||||
| Click to Show/Hide the Complete Species Lineage | |||||
Type(s) of Resistant Mechanism of This Molecule
 UAPP: Unusual Activation of Pro-survival Pathway
Drug Resistance Data Categorized by Drug
Approved Drug(s)
5 drug(s) in total
| Drug Resistance Data Categorized by Their Corresponding Mechanisms | ||||
|
Unusual Activation of Pro-survival Pathway (UAPP)
|
||||
| Disease Class: Head and neck cancer [ICD-11: 2D42.0] | [1] | |||
| Resistant Disease | Head and neck cancer [ICD-11: 2D42.0] | |||
| Resistant Drug | Alpelisib | |||
| Molecule Alteration | Interaction | K143R? |
||
| Experimental Note | Revealed Based on the Cell Line Data | |||
| Cell Pathway Regulation | MAPK signaling pathway | Activation | hsa04010 | |
| In Vitro Model | Cal-33 cells | Tongue | Homo sapiens (Human) | CVCL_1108 |
| FaDu cells | Pharynx | Homo sapiens (Human) | CVCL_1218 | |
| HSC-4 cells | Cervical lymph node | Homo sapiens (Human) | CVCL_1289 | |
| SAS cells | Oral | Homo sapiens (Human) | CVCL_1675 | |
| UT-SCC-5 cells | Head and Neck | Homo sapiens (Human) | CVCL_7858 | |
| UT-SCC-8 cells | Head and Neck | Homo sapiens (Human) | CVCL_7869 | |
| UT-SCC-14 cells | Head and Neck | Homo sapiens (Human) | CVCL_7810 | |
| UT-SCC-15 cells | Head and Neck | Homo sapiens (Human) | CVCL_7811 | |
| Experiment for Molecule Alteration |
Whole exome sequencing assay; Western blot assay; Akt activity assay; 3D foci assay; Phosphorylation pathway analysis; Gene enrichment assay; Network analysis; Functional enrichment analysis | |||
| Experiment for Drug Resistance |
3D colony formation assay | |||
| Mechanism Description | In terms of PI3K/Akt pathway activity, Alpelisib treatment reduced phosphorylation of Akt (Ser473), GSK3beta (Ser9) and 4E-BP1 (Ser65) to a similar extent in responder and non-responder cell models (Fig. 2A, B and S2). Likewise, Akt activity was not significantly modified upon Alpelisib exposure (Fig. 2C). Taken together, our data show that inhibition of PI3Kalpha kinase causes varying degrees of radiochemosensitization in different HNSCC models and without an obvious mutational biomarker to predict drug effect. | |||
| Drug Sensitivity Data Categorized by Their Corresponding Mechanisms | ||||
|
Unusual Activation of Pro-survival Pathway (UAPP)
|
||||
| Disease Class: Ovarian cancer [ICD-11: 2C73.0] | [2] | |||
| Sensitive Disease | Ovarian cancer [ICD-11: 2C73.0] | |||
| Sensitive Drug | Carboplatin | |||
| Molecule Alteration | Expression | Down-regulation |
||
| Experimental Note | Revealed Based on the Cell Line Data | |||
| Cell Pathway Regulation | Cell apoptosis | Activation | hsa04210 | |
| MAPK/RAS signaling pathway | Regulation | N.A. | ||
| In Vitro Model | A2780 cells | Ovary | Homo sapiens (Human) | CVCL_0134 |
| T24 cells | Bladder | Homo sapiens (Human) | CVCL_0554 | |
| HCT8 cells | Colon | Homo sapiens (Human) | CVCL_2478 | |
| Experiment for Molecule Alteration |
Western blot analysis | |||
| Experiment for Drug Resistance |
MTT assay | |||
| Mechanism Description | miR-634 is an important player in cisplatin-resistance. First of all, miR-634 was the only miR miR-634 overexpression in ovarian cancer cell lines and patient samples negatively regulates important cell-cycle genes (CCND1) and Ras-MAPk pathway components (GRB2, ERk2, RSk1 and RSk2). Inhibition of the Ras-MAPk pathway resulted in increased sensitivity to cisplatin, suggesting that the miR-634-mediated repression of this pathway is responsible for the effect of miR-634 on cisplatin resistance. | |||
| Drug Sensitivity Data Categorized by Their Corresponding Mechanisms | ||||
|
Unusual Activation of Pro-survival Pathway (UAPP)
|
||||
| Disease Class: Ovarian cancer [ICD-11: 2C73.0] | [3] | |||
| Sensitive Disease | Ovarian cancer [ICD-11: 2C73.0] | |||
| Sensitive Drug | Cisplatin | |||
| Molecule Alteration | Expression | Down-regulation |
||
| Experimental Note | Revealed Based on the Cell Line Data | |||
| Cell Pathway Regulation | Cell apoptosis | Activation | hsa04210 | |
| Cell colony | Inhibition | hsa05200 | ||
| Cell viability | Inhibition | hsa05200 | ||
| In Vitro Model | SkOV3 cells | Ovary | Homo sapiens (Human) | CVCL_0532 |
| HEK293T cells | Kidney | Homo sapiens (Human) | CVCL_0063 | |
| OVCAR3 cells | Ovary | Homo sapiens (Human) | CVCL_0465 | |
| Experiment for Molecule Alteration |
Western blot analysis | |||
| Experiment for Drug Resistance |
MTT assay; Flow cytometry assay | |||
| Mechanism Description | miR-378a-3p sensitizes ovarian cancer cells to cisplatin through downregulating MAPk1/GRB2. | |||
| Disease Class: Ovarian cancer [ICD-11: 2C73.0] | [2] | |||
| Sensitive Disease | Ovarian cancer [ICD-11: 2C73.0] | |||
| Sensitive Drug | Cisplatin | |||
| Molecule Alteration | Expression | Down-regulation |
||
| Experimental Note | Revealed Based on the Cell Line Data | |||
| Cell Pathway Regulation | Cell apoptosis | Activation | hsa04210 | |
| MAPK/RAS signaling pathway | Regulation | N.A. | ||
| In Vitro Model | A2780 cells | Ovary | Homo sapiens (Human) | CVCL_0134 |
| T24 cells | Bladder | Homo sapiens (Human) | CVCL_0554 | |
| HCT8 cells | Colon | Homo sapiens (Human) | CVCL_2478 | |
| Experiment for Molecule Alteration |
Western blot analysis | |||
| Experiment for Drug Resistance |
MTT assay | |||
| Mechanism Description | miR-634 is an important player in cisplatin-resistance. First of all, miR-634 was the only miR miR-634 overexpression in ovarian cancer cell lines and patient samples negatively regulates important cell-cycle genes (CCND1) and Ras-MAPk pathway components (GRB2, ERk2, RSk1 and RSk2). Inhibition of the Ras-MAPk pathway resulted in increased sensitivity to cisplatin, suggesting that the miR-634-mediated repression of this pathway is responsible for the effect of miR-634 on cisplatin resistance. | |||
| Drug Sensitivity Data Categorized by Their Corresponding Mechanisms | ||||
|
Unusual Activation of Pro-survival Pathway (UAPP)
|
||||
| Disease Class: Ovarian cancer [ICD-11: 2C73.0] | [2] | |||
| Sensitive Disease | Ovarian cancer [ICD-11: 2C73.0] | |||
| Sensitive Drug | Doxorubicin | |||
| Molecule Alteration | Expression | Down-regulation |
||
| Experimental Note | Revealed Based on the Cell Line Data | |||
| Cell Pathway Regulation | Cell apoptosis | Activation | hsa04210 | |
| MAPK/RAS signaling pathway | Regulation | N.A. | ||
| In Vitro Model | A2780 cells | Ovary | Homo sapiens (Human) | CVCL_0134 |
| T24 cells | Bladder | Homo sapiens (Human) | CVCL_0554 | |
| HCT8 cells | Colon | Homo sapiens (Human) | CVCL_2478 | |
| Experiment for Molecule Alteration |
Western blot analysis | |||
| Experiment for Drug Resistance |
MTT assay | |||
| Mechanism Description | miR-634 is an important player in cisplatin-resistance. First of all, miR-634 was the only miR miR-634 overexpression in ovarian cancer cell lines and patient samples negatively regulates important cell-cycle genes (CCND1) and Ras-MAPk pathway components (GRB2, ERk2, RSk1 and RSk2). Inhibition of the Ras-MAPk pathway resulted in increased sensitivity to cisplatin, suggesting that the miR-634-mediated repression of this pathway is responsible for the effect of miR-634 on cisplatin resistance. | |||
| Drug Sensitivity Data Categorized by Their Corresponding Mechanisms | ||||
|
Unusual Activation of Pro-survival Pathway (UAPP)
|
||||
| Disease Class: Breast cancer [ICD-11: 2C60.3] | [4] | |||
| Sensitive Disease | Breast cancer [ICD-11: 2C60.3] | |||
| Sensitive Drug | Paclitaxel | |||
| Molecule Alteration | Expression | Down-regulation |
||
| Experimental Note | Identified from the Human Clinical Data | |||
| Cell Pathway Regulation | Cell apoptosis | Activation | hsa04210 | |
| Cell viability | Inhibition | hsa05200 | ||
| MAPK/ERK signaling pathway | Inhibition | hsa04010 | ||
| PI3K/AKT signaling pathway | Inhibition | hsa04151 | ||
| In Vitro Model | BCap37 cells | Breast | Homo sapiens (Human) | CVCL_0164 |
| Bads-200 cells | Breast | Homo sapiens (Human) | N.A. | |
| In Vivo Model | Nude mouse xenograft model | Mus musculus | ||
| Experiment for Molecule Alteration |
Western blot analysis | |||
| Experiment for Drug Resistance |
MTT assay; Flow cytometry assay | |||
| Mechanism Description | miR-27b inhibits proliferation and resistance to PTX of breast cancer cell by repressing CBLB and GRB2 and suppresses activities of PI3k/AkT and MAPk/ERk signaling pathways through downregulation of CBLB and GRB2. | |||
Disease- and Tissue-specific Abundances of This Molecule
ICD Disease Classification 02

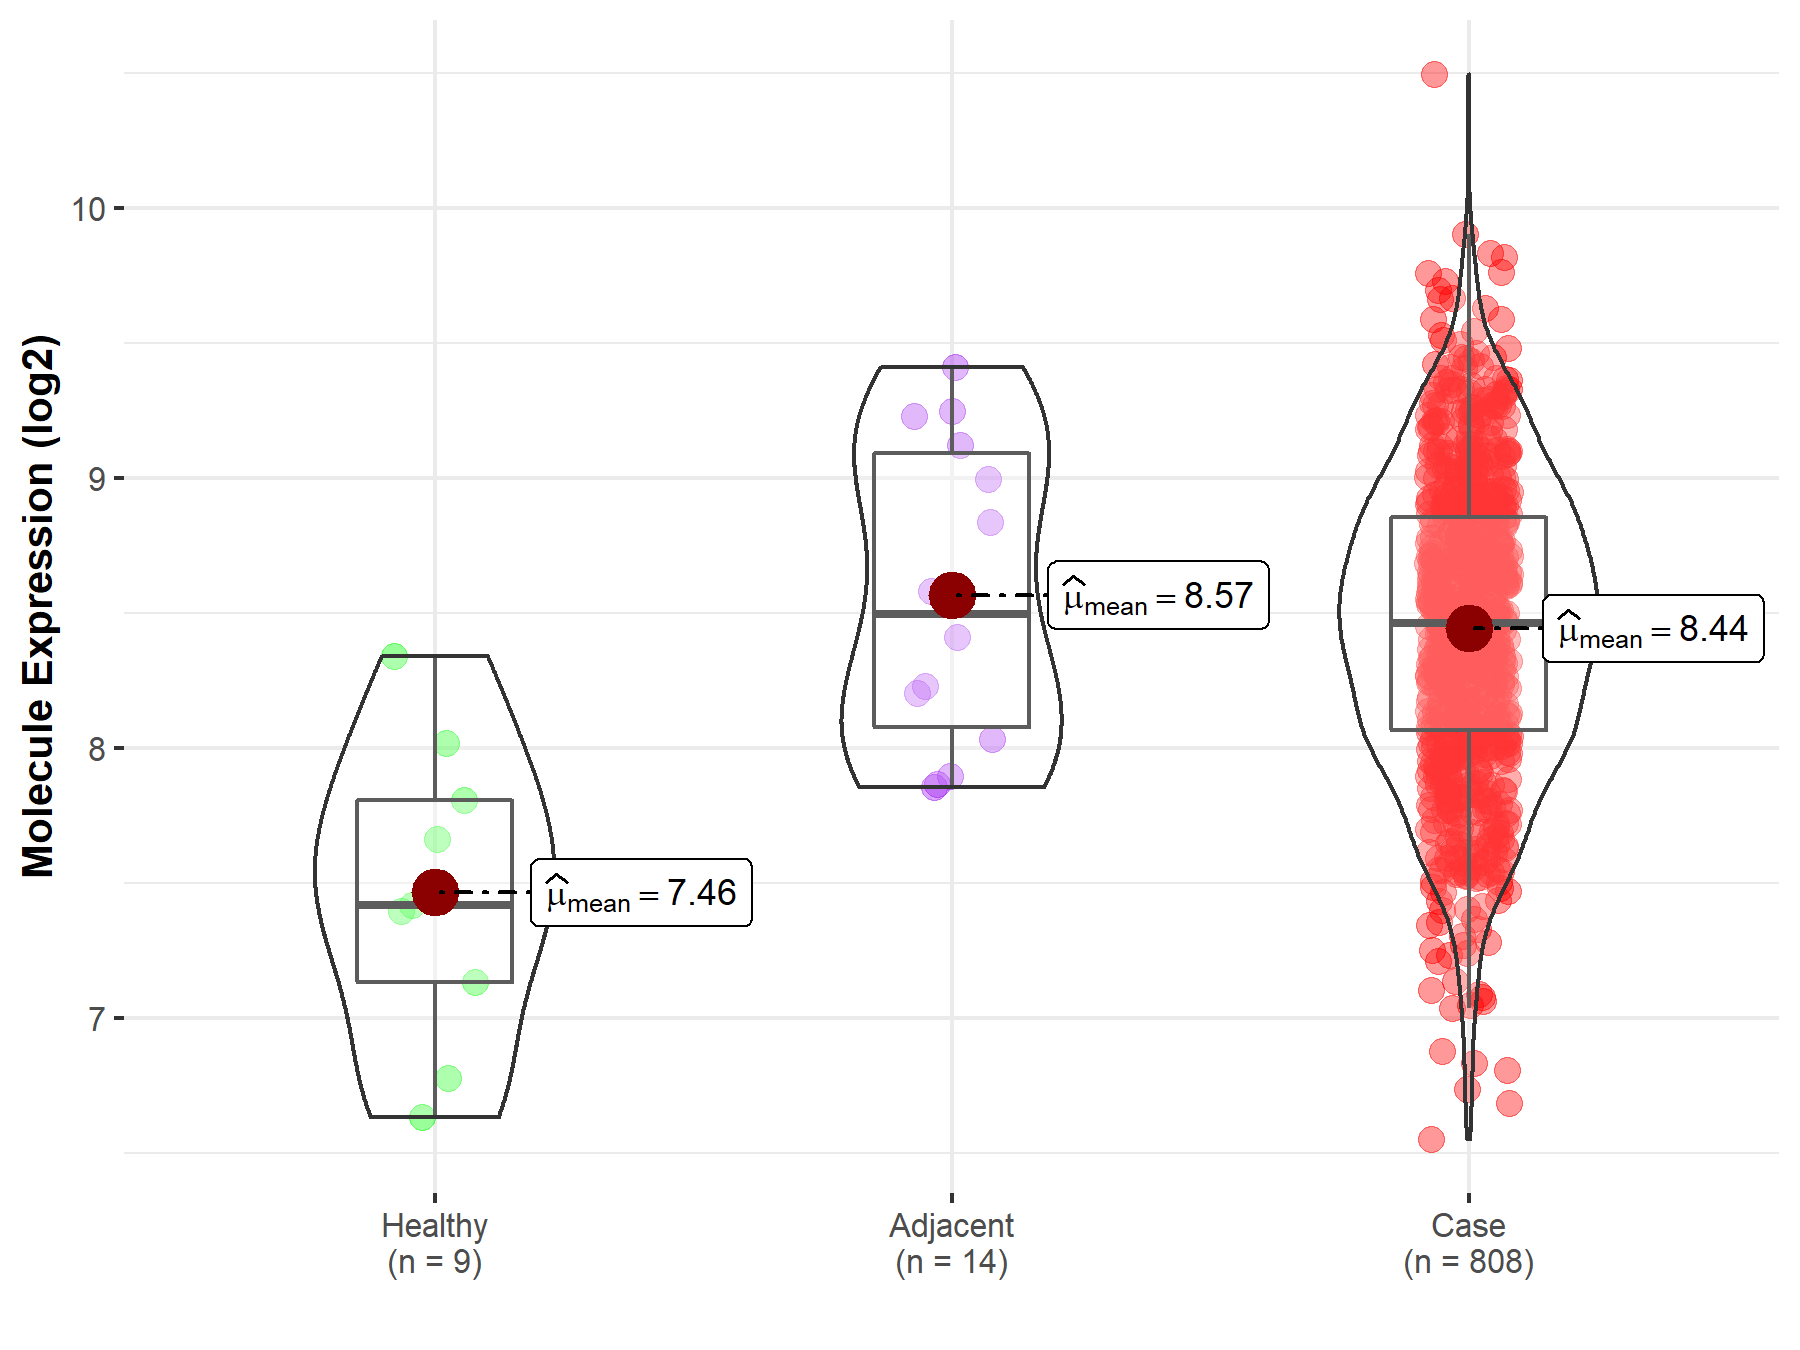
| Differential expression of molecule in resistant diseases | ||
| The Studied Tissue | Breast tissue | |
| The Specified Disease | Breast cancer | |
| The Expression Level of Disease Section Compare with the Healthy Individual Tissue | p-value: 2.52E-27; Fold-change: 3.48E-01; Z-score: 7.66E-01 | |
| The Expression Level of Disease Section Compare with the Adjacent Tissue | p-value: 1.25E-06; Fold-change: 6.88E-01; Z-score: 1.00E+00 | |
|
Molecule expression in the normal tissue adjacent to the diseased tissue of patients
Molecule expression in the diseased tissue of patients
Molecule expression in the normal tissue of healthy individuals
|
||
| Disease-specific Molecule Abundances |

|
Click to View the Clearer Original Diagram |
| Differential expression of molecule in resistant diseases | ||
| The Studied Tissue | Ovary | |
| The Specified Disease | Ovarian cancer | |
| The Expression Level of Disease Section Compare with the Healthy Individual Tissue | p-value: 7.54E-04; Fold-change: 1.04E+00; Z-score: 1.86E+00 | |
| The Expression Level of Disease Section Compare with the Adjacent Tissue | p-value: 4.35E-01; Fold-change: -3.51E-02; Z-score: -6.19E-02 | |
|
Molecule expression in the normal tissue adjacent to the diseased tissue of patients
Molecule expression in the diseased tissue of patients
Molecule expression in the normal tissue of healthy individuals
|
||
| Disease-specific Molecule Abundances |
|
Click to View the Clearer Original Diagram |
Tissue-specific Molecule Abundances in Healthy Individuals

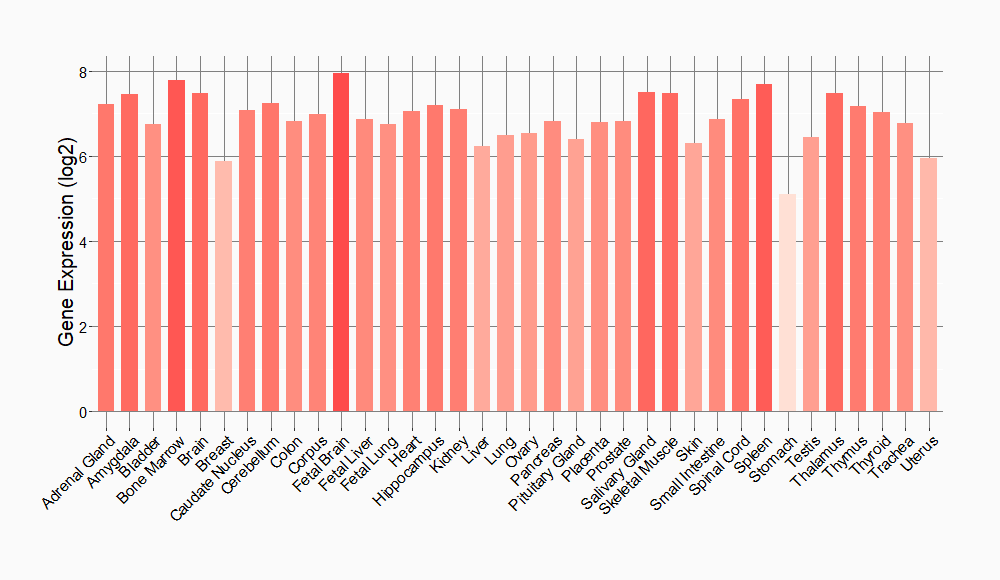
|
||
References
If you find any error in data or bug in web service, please kindly report it to Dr. Sun and Dr. Yu.