Molecule Information
General Information of the Molecule (ID: Mol00295)
| Name |
Claudin-2 (CLDN2)
,Homo sapiens
|
||||
|---|---|---|---|---|---|
| Synonyms |
SP82; PSEC0059; SP82; UNQ705/PRO1356
Click to Show/Hide
|
||||
| Molecule Type |
Protein
|
||||
| Gene Name |
CLDN2
|
||||
| Gene ID | |||||
| Location |
chrX:106900164-106930861[+]
|
||||
| Sequence |
MASLGLQLVGYILGLLGLLGTLVAMLLPSWKTSSYVGASIVTAVGFSKGLWMECATHSTG
ITQCDIYSTLLGLPADIQAAQAMMVTSSAISSLACIISVVGMRCTVFCQESRAKDRVAVA GGVFFILGGLLGFIPVAWNLHGILRDFYSPLVPDSMKFEIGEALYLGIISSLFSLIAGII LCFSCSSQRNRSNYYDAYQAQPLATRSSPRPGQPPKVKSEFNSYSLTGYV Click to Show/Hide
|
||||
| 3D-structure |
|
||||
| Function |
Plays a major role in tight junction-specific obliteration of the intercellular space, through calcium-independent cell-adhesion activity.
Click to Show/Hide
|
||||
| Uniprot ID | |||||
| Ensembl ID | |||||
| HGNC ID | |||||
| Click to Show/Hide the Complete Species Lineage | |||||
Type(s) of Resistant Mechanism of This Molecule
 UAPP: Unusual Activation of Pro-survival Pathway
Drug Resistance Data Categorized by Drug
Approved Drug(s)
1 drug(s) in total
| Drug Sensitivity Data Categorized by Their Corresponding Mechanisms | ||||
|
Unusual Activation of Pro-survival Pathway (UAPP)
|
||||
| Disease Class: Lung adenocarcinoma [ICD-11: 2C25.0] | [1] | |||
| Sensitive Disease | Lung adenocarcinoma [ICD-11: 2C25.0] | |||
| Sensitive Drug | Doxorubicin | |||
| Molecule Alteration | Expression | Down-regulation |
||
| Experimental Note | Revealed Based on the Cell Line Data | |||
| Cell Pathway Regulation | Nrf2 signaling pathway | Inhibition | hsa05208 | |
| In Vitro Model | A549 cells | Lung | Homo sapiens (Human) | CVCL_0023 |
| Experiment for Molecule Alteration |
Western blot analysis | |||
| Mechanism Description | CLDN2 knockdown attenuated the expression of Nrf2 and the Nrf2-targeted genes. The DXR-induced toxicity was enhanced by CLDN2 knockdown, which was inhibited by an Nrf2 activator sulforaphane. | |||
Disease- and Tissue-specific Abundances of This Molecule
ICD Disease Classification 02

| Differential expression of molecule in resistant diseases | ||
| The Studied Tissue | Lung | |
| The Specified Disease | Lung cancer | |
| The Expression Level of Disease Section Compare with the Healthy Individual Tissue | p-value: 1.91E-09; Fold-change: -4.85E-02; Z-score: -7.55E-02 | |
| The Expression Level of Disease Section Compare with the Adjacent Tissue | p-value: 6.13E-23; Fold-change: 1.17E-01; Z-score: 2.70E-01 | |
|
Molecule expression in the normal tissue adjacent to the diseased tissue of patients
Molecule expression in the diseased tissue of patients
Molecule expression in the normal tissue of healthy individuals
|
||
| Disease-specific Molecule Abundances |
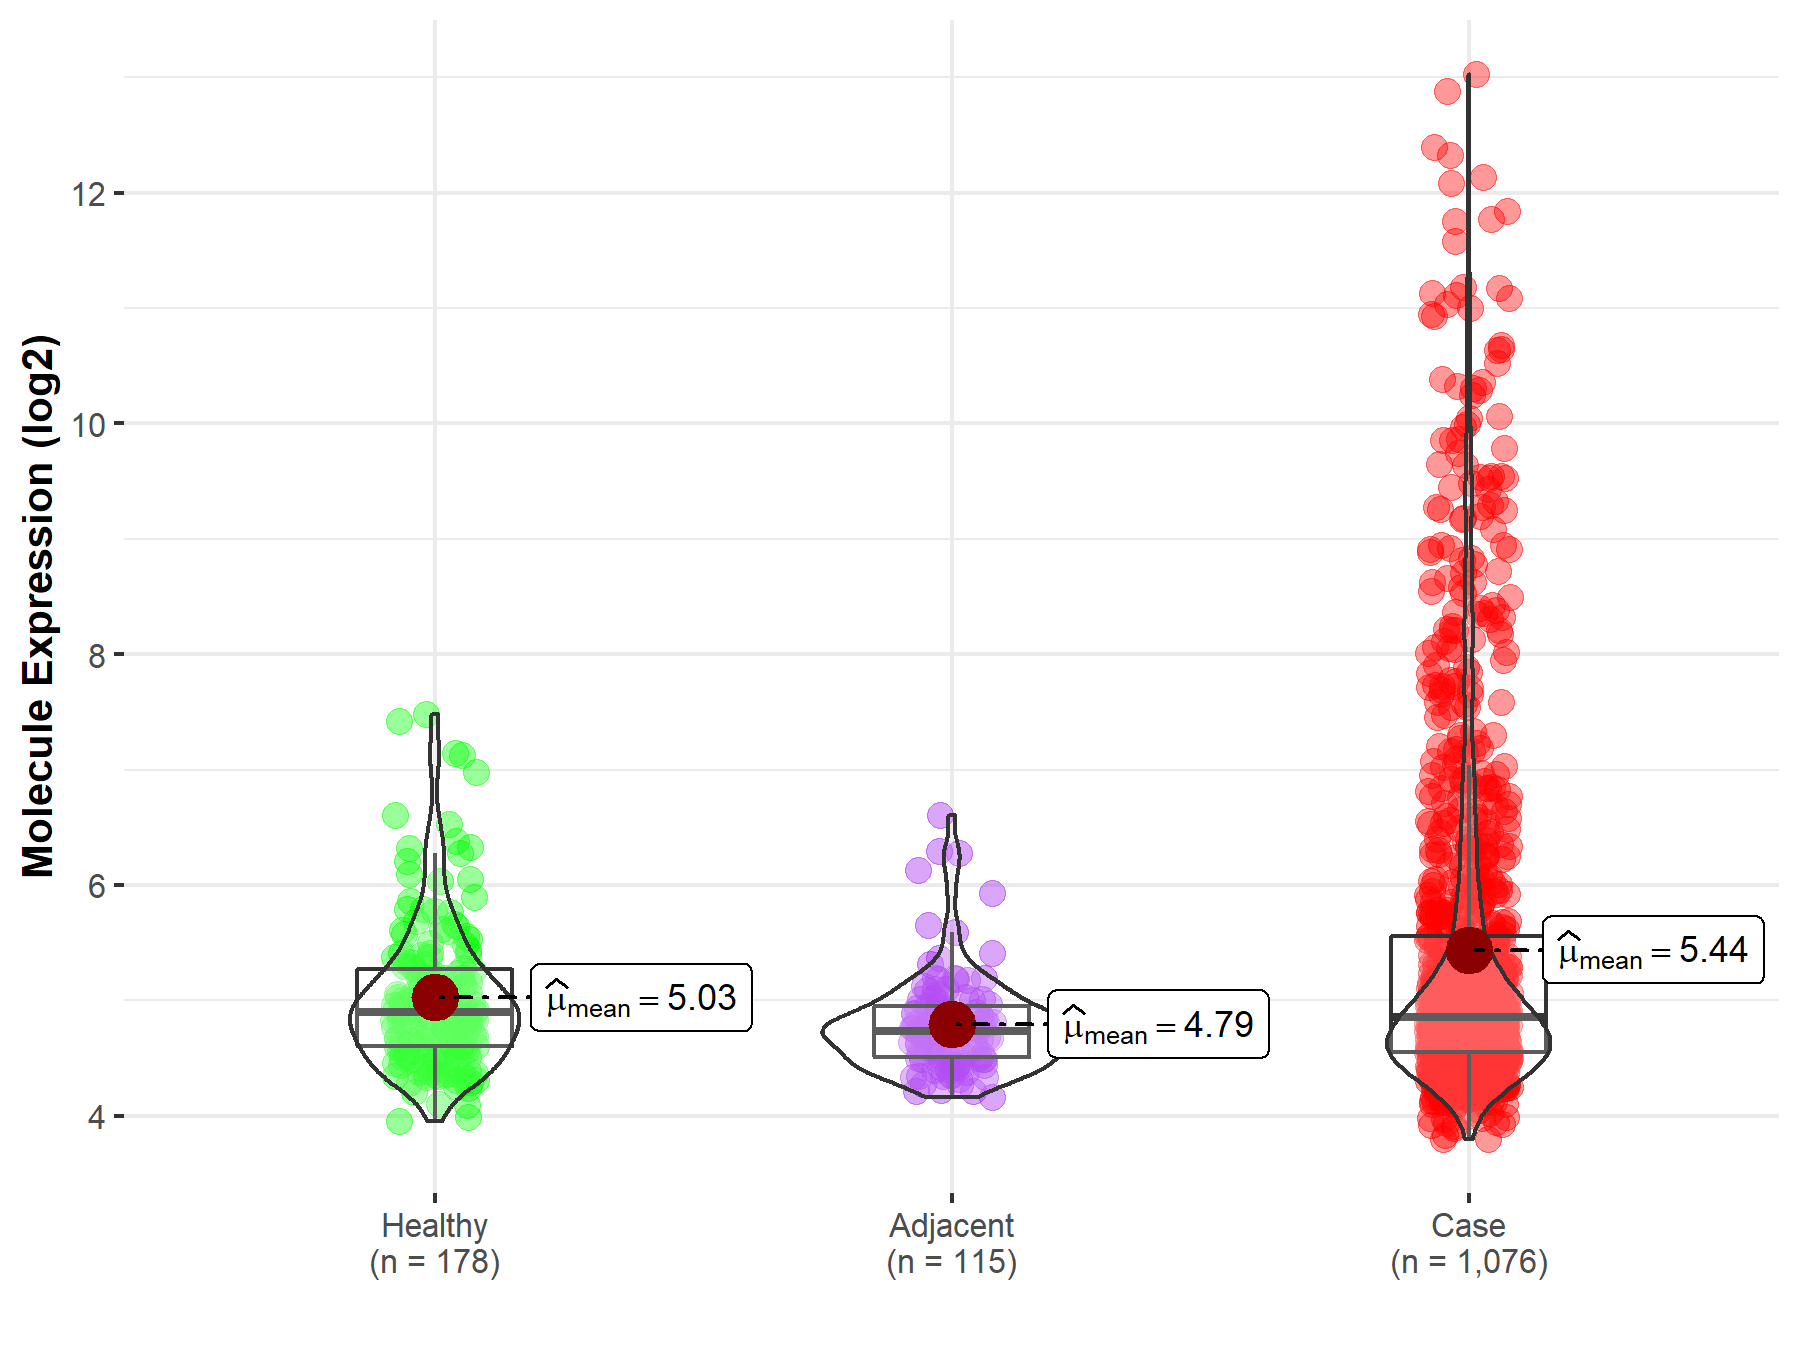
|
Click to View the Clearer Original Diagram |
References
If you find any error in data or bug in web service, please kindly report it to Dr. Sun and Dr. Yu.