Molecule Information
General Information of the Molecule (ID: Mol00207)
| Name |
ATP-binding cassette sub-family E1 (ABCE1)
,Homo sapiens
|
||||
|---|---|---|---|---|---|
| Synonyms |
2'-5'-oligoadenylate-binding protein; HuHP68; RNase L inhibitor; Ribonuclease 4 inhibitor; RNS4I; RLI; RNASEL1; RNASELI; RNS4I; OK/SW-cl.40
Click to Show/Hide
|
||||
| Molecule Type |
Protein
|
||||
| Gene Name |
ABCE1
|
||||
| Gene ID | |||||
| Location |
chr4:145098288-145129524[+]
|
||||
| Sequence |
MADKLTRIAIVNHDKCKPKKCRQECKKSCPVVRMGKLCIEVTPQSKIAWISETLCIGCGI
CIKKCPFGALSIVNLPSNLEKETTHRYCANAFKLHRLPIPRPGEVLGLVGTNGIGKSTAL KILAGKQKPNLGKYDDPPDWQEILTYFRGSELQNYFTKILEDDLKAIIKPQYVDQIPKAA KGTVGSILDRKDETKTQAIVCQQLDLTHLKERNVEDLSGGELQRFACAVVCIQKADIFMF DEPSSYLDVKQRLKAAITIRSLINPDRYIIVVEHDLSVLDYLSDFICCLYGVPSAYGVVT MPFSVREGINIFLDGYVPTENLRFRDASLVFKVAETANEEEVKKMCMYKYPGMKKKMGEF ELAIVAGEFTDSEIMVMLGENGTGKTTFIRMLAGRLKPDEGGEVPVLNVSYKPQKISPKS TGSVRQLLHEKIRDAYTHPQFVTDVMKPLQIENIIDQEVQTLSGGELQRVALALCLGKPA DVYLIDEPSAYLDSEQRLMAARVVKRFILHAKKTAFVVEHDFIMATYLADRVIVFDGVPS KNTVANSPQTLLAGMNKFLSQLEITFRRDPNNYRPRINKLNSIKDVEQKKSGNYFFLDD Click to Show/Hide
|
||||
| 3D-structure |
|
||||
| Function |
Cotranslational quality control factor involved in the No-Go Decay (NGD) pathway. Together with PELO and HBS1L, is required for 48S complex formation from 80S ribosomes and dissociation of vacant 80S ribosomes. Together with PELO and HBS1L, recognizes stalled ribosomes and promotes dissociation of elongation complexes assembled on non-stop mRNAs; this triggers endonucleolytic cleavage of the mRNA, a mechanism to release non-functional ribosomes and to degrade damaged mRNAs as part of the No-Go Decay (NGD) pathway. Plays a role in the regulation of mRNA turnover. Plays a role in quality control of translation of mitochondrial outer membrane-localized mRNA. As part of the PINK1-regulated signaling, ubiquitinated by CNOT4 upon mitochondria damage; this modification generates polyubiquitin signals that recruit autophagy receptors to the mitochondrial outer membrane and initiate mitophagy. RNASEL-specific protein inhibitor which antagonizes the binding of 2-5A (5'-phosphorylated 2',5'-linked oligoadenylates) to RNASEL. Negative regulator of the anti-viral effect of the interferon-regulated 2-5A/RNASEL pathway.
Click to Show/Hide
|
||||
| Uniprot ID | |||||
| Ensembl ID | |||||
| HGNC ID | |||||
| Click to Show/Hide the Complete Species Lineage | |||||
Type(s) of Resistant Mechanism of This Molecule
 IDUE: Irregularity in Drug Uptake and Drug Efflux
Drug Resistance Data Categorized by Drug
Approved Drug(s)
1 drug(s) in total
| Drug Sensitivity Data Categorized by Their Corresponding Mechanisms | ||||
|
Irregularity in Drug Uptake and Drug Efflux (IDUE)
|
||||
| Disease Class: Lung cancer [ICD-11: 2C25.5] | [1] | |||
| Sensitive Disease | Lung cancer [ICD-11: 2C25.5] | |||
| Sensitive Drug | Doxorubicin | |||
| Molecule Alteration | Expression | Down-regulation |
||
| Experimental Note | Revealed Based on the Cell Line Data | |||
| Cell Pathway Regulation | Cell apoptosis | Activation | hsa04210 | |
| Cell proliferation | Inhibition | hsa05200 | ||
| In Vitro Model | NCI-H69 cells | Lung | Homo sapiens (Human) | CVCL_1579 |
| In Vivo Model | Nude mouse xenograft model | Mus musculus | ||
| Experiment for Molecule Alteration |
Western blot analysis | |||
| Experiment for Drug Resistance |
MTT assay; Flow cytometry assay | |||
| Mechanism Description | miR-299-3p in doxorubicin-sensitive lung cancer was decreased less than that in doxorubicin-resistant lung cancer samples, which directly regulated the expression of ABCE1. Over-expression of miR-299-3p was significantly inhibited the cell proliferation and increased cell apoptosis in H69/ADR lung cancer cells, and also promoted cell inhibitory rate. Over-expression of miR-299-3p promotes the sensibility of lung cancer to doxorubicin. | |||
Disease- and Tissue-specific Abundances of This Molecule
ICD Disease Classification 02

| Differential expression of molecule in resistant diseases | ||
| The Studied Tissue | Lung | |
| The Specified Disease | Lung cancer | |
| The Expression Level of Disease Section Compare with the Healthy Individual Tissue | p-value: 1.15E-37; Fold-change: 5.00E-01; Z-score: 1.70E+00 | |
| The Expression Level of Disease Section Compare with the Adjacent Tissue | p-value: 5.31E-15; Fold-change: 4.35E-01; Z-score: 1.10E+00 | |
|
Molecule expression in the normal tissue adjacent to the diseased tissue of patients
Molecule expression in the diseased tissue of patients
Molecule expression in the normal tissue of healthy individuals
|
||
| Disease-specific Molecule Abundances |
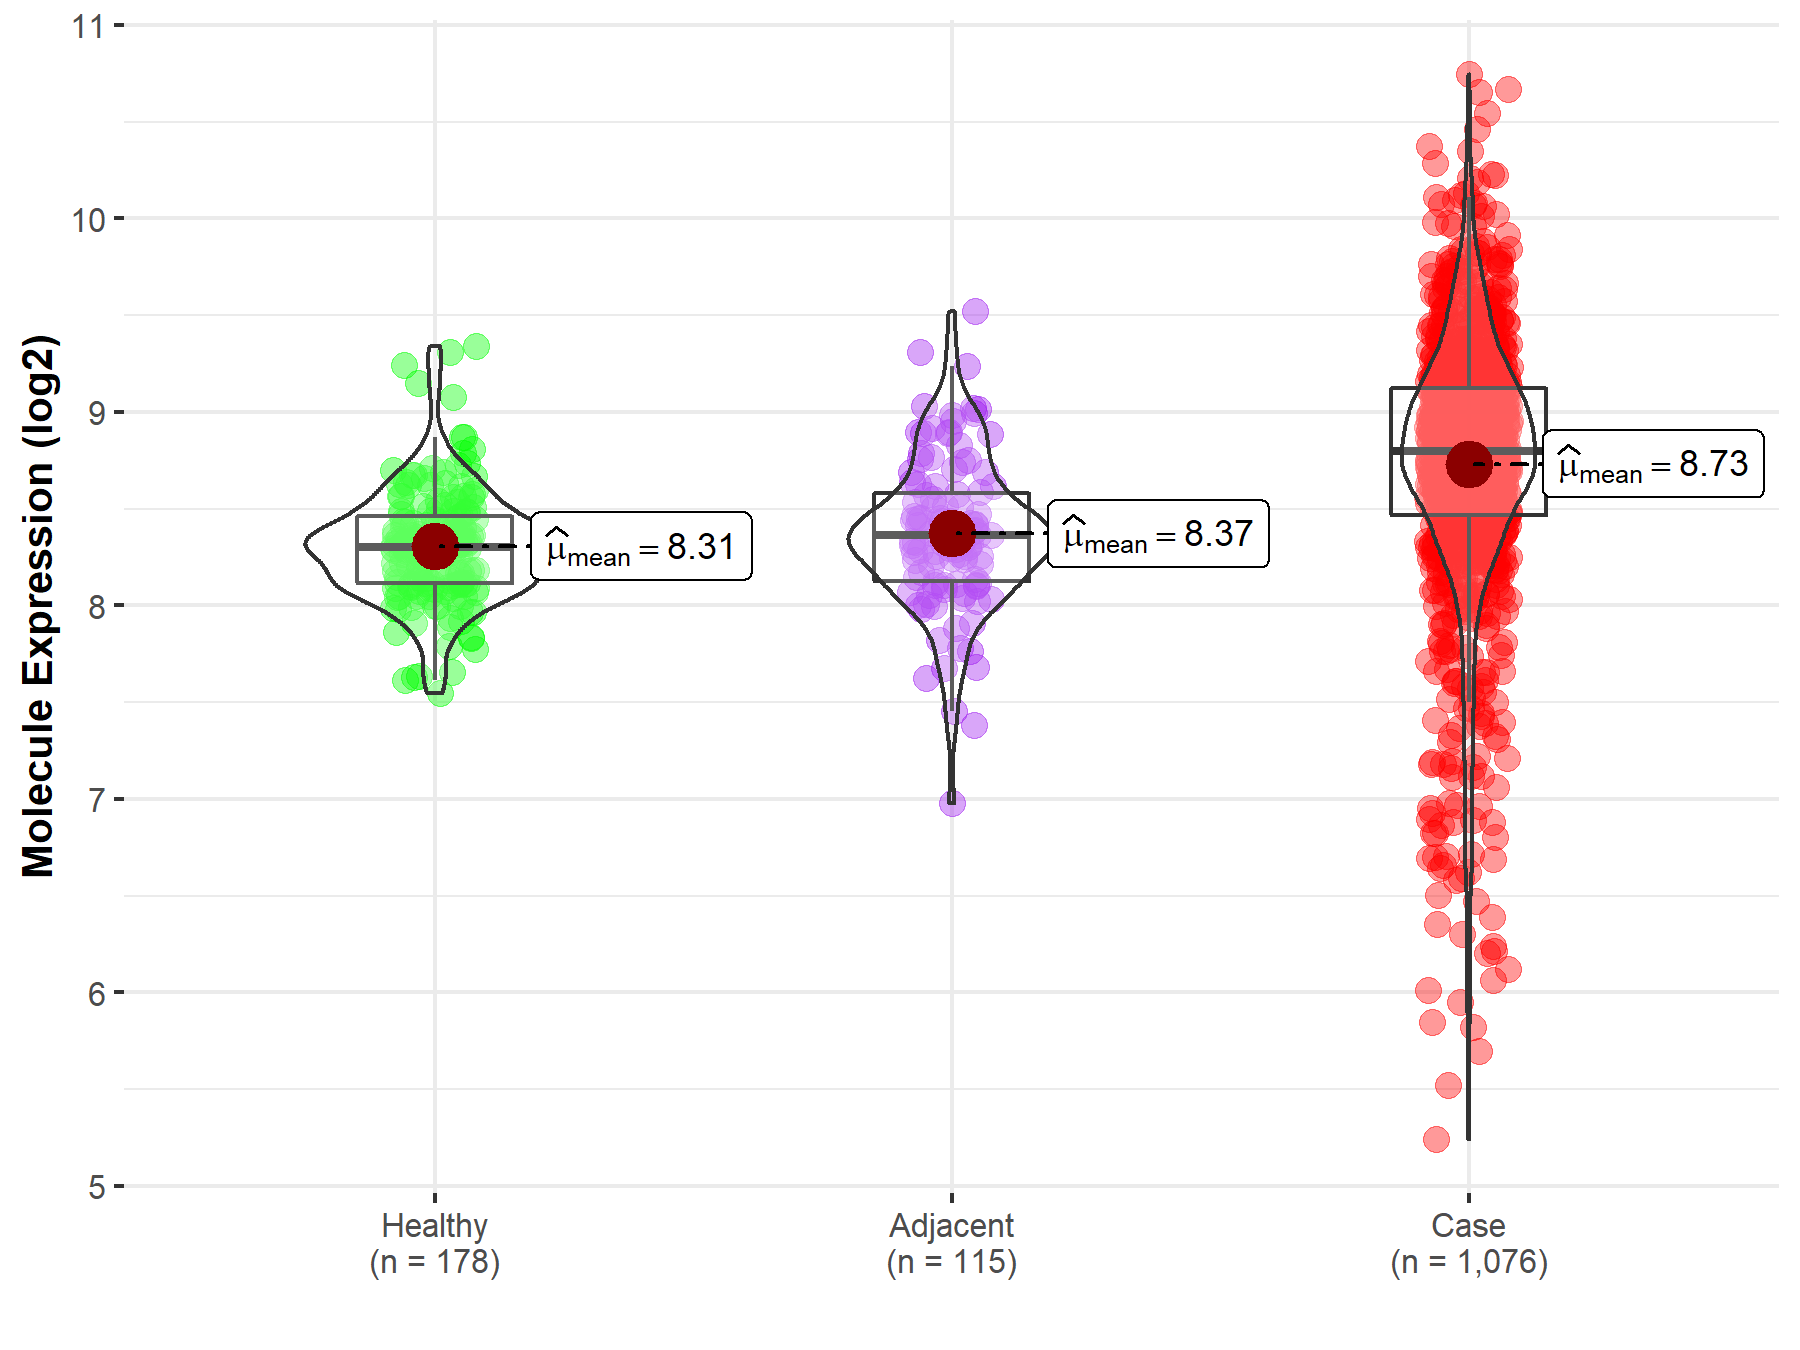
|
Click to View the Clearer Original Diagram |
Tissue-specific Molecule Abundances in Healthy Individuals

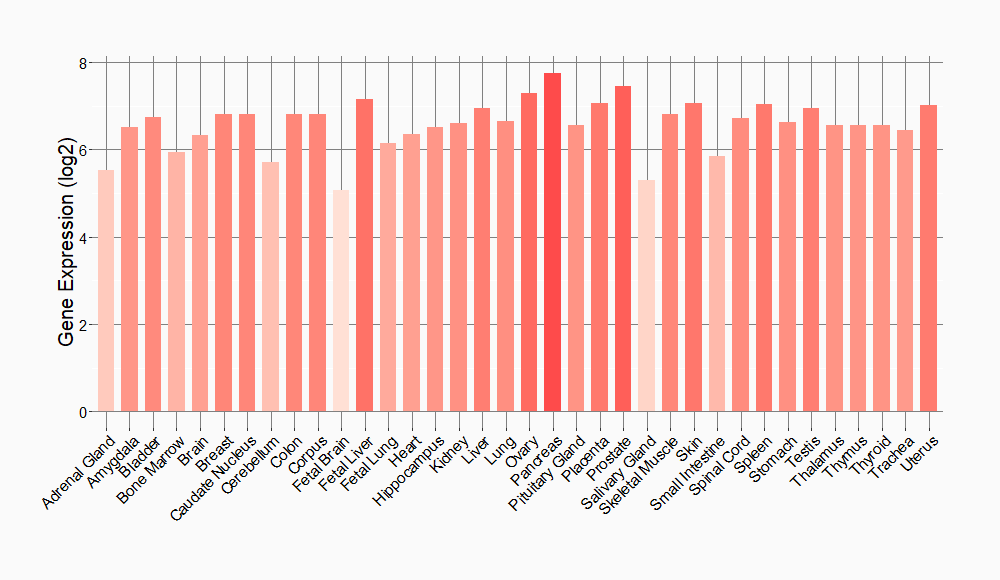
|
||
References
If you find any error in data or bug in web service, please kindly report it to Dr. Sun and Dr. Yu.