Molecule Information
General Information of the Molecule (ID: Mol00134)
| Name |
Programmed cell death 1 ligand 1 (PD-L1)
,Homo sapiens
|
||||
|---|---|---|---|---|---|
| Molecule Type |
Protein
|
||||
| Gene Name |
CD274
|
||||
| Gene ID | |||||
| Location |
chr9:5450503-5470566[+]
|
||||
| Sequence |
MRIFAVFIFMTYWHLLNAFTVTVPKDLYVVEYGSNMTIECKFPVEKQLDLAALIVYWEME
DKNIIQFVHGEEDLKVQHSSYRQRARLLKDQLSLGNAALQITDVKLQDAGVYRCMISYGG ADYKRITVKVNAPYNKINQRILVVDPVTSEHELTCQAEGYPKAEVIWTSSDHQVLSGKTT TTNSKREEKLFNVTSTLRINTTTNEIFYCTFRRLDPEENHTAELVIPELPLAHPPNERTH LVILGAILLCLGVALTFIFRLRKGRMMDVKKCGIQDTNSKKQSDTHLEET Click to Show/Hide
|
||||
| 3D-structure |
|
||||
| Function |
Plays a critical role in induction and maintenance of immune tolerance to self. As a ligand for the inhibitory receptor PDCD1/PD-1, modulates the activation threshold of T-cells and limits T-cell effector response. Through a yet unknown activating receptor, may costimulate T-cell subsets that predominantly produce interleukin-10 (IL10).
Click to Show/Hide
|
||||
| Uniprot ID | |||||
| Ensembl ID | |||||
| HGNC ID | |||||
| Click to Show/Hide the Complete Species Lineage | |||||
Type(s) of Resistant Mechanism of This Molecule
 UAPP: Unusual Activation of Pro-survival Pathway
Drug Resistance Data Categorized by Drug
Approved Drug(s)
5 drug(s) in total
| Drug Resistance Data Categorized by Their Corresponding Mechanisms | ||||
|
Unusual Activation of Pro-survival Pathway (UAPP)
|
||||
| Disease Class: Breast cancer [ICD-11: 2C60.3] | [1] | |||
| Resistant Disease | Breast cancer [ICD-11: 2C60.3] | |||
| Resistant Drug | Doxorubicin | |||
| Molecule Alteration | Expression | Up-regulation |
||
| Differential expression of the molecule in resistant disease | ||||
| Classification of Disease | Breast cancer [ICD-11: 2C60] | |||
| The Specified Disease | Breast cancer | |||
| The Studied Tissue | Breast tissue | |||
| The Expression Level of Disease Section Compare with the Healthy Individual Tissue | p-value: 4.29E-16 Fold-change: 5.17E-02 Z-score: 8.28E+00 |
|||
| Experimental Note | Revealed Based on the Cell Line Data | |||
| Cell Pathway Regulation | Cell viability | Activation | hsa05200 | |
| In Vitro Model | MCF-7 cells | Breast | Homo sapiens (Human) | CVCL_0031 |
| MDA-MB-231 cells | Breast | Homo sapiens (Human) | CVCL_0062 | |
| MDA-MB-468 cells | Breast | Homo sapiens (Human) | CVCL_0419 | |
| In Vivo Model | BALB/c mouse model | Mus musculus | ||
| Experiment for Molecule Alteration |
Western blot analysis | |||
| Experiment for Drug Resistance |
CCK8 assay | |||
| Mechanism Description | Transfection of a miR-3609 mimic markedly suppressed PD-L1 protein expression in MDA-MB-231 and MDA-MB-468 cells in a dose-dependent manner and increased the sensitivity of MCF7/ADR cells to adriamycin, whereas transfection of a miR-3609 inhibitor enhanced PD-L1 protein expression in HBL-100 and MCF-7 cells. | |||
| Drug Sensitivity Data Categorized by Their Corresponding Mechanisms | ||||
|
Unusual Activation of Pro-survival Pathway (UAPP)
|
||||
| Disease Class: Glioma [ICD-11: 2A00.1] | [2] | |||
| Sensitive Disease | Glioma [ICD-11: 2A00.1] | |||
| Sensitive Drug | Paclitaxel | |||
| Molecule Alteration | Expression | Down-regulation |
||
| Differential expression of the molecule in resistant disease | ||||
| Classification of Disease | Brain cancer [ICD-11: 2A00] | |||
| The Specified Disease | Neuroectodermal tumor | |||
| The Studied Tissue | Brainstem tissue | |||
| The Expression Level of Disease Section Compare with the Healthy Individual Tissue | p-value: 6.63E-05 Fold-change: -1.58E-01 Z-score: -6.10E+00 |
|||
| Experimental Note | Revealed Based on the Cell Line Data | |||
| Cell Pathway Regulation | miR34a/PD-L1 signaling pathway | Regulation | N.A. | |
| In Vitro Model | U87 cells | Brain | Homo sapiens (Human) | CVCL_0022 |
| U87-P cells | Brain | Homo sapiens (Human) | CVCL_0022 | |
| Experiment for Molecule Alteration |
Western blot analysis; Luciferase reporter assay | |||
| Experiment for Drug Resistance |
Annexin V/PI apoptosis assay; Cell cycle assay; MTT assay | |||
| Mechanism Description | miR34a attenuates glioma cells progression and chemoresistance via targeting PD-L1. | |||
| Drug Sensitivity Data Categorized by Their Corresponding Mechanisms | ||||
|
Unusual Activation of Pro-survival Pathway (UAPP)
|
||||
| Disease Class: Epithelial ovarian cancer [ICD-11: 2B5D.0] | [3] | |||
| Sensitive Disease | Epithelial ovarian cancer [ICD-11: 2B5D.0] | |||
| Sensitive Drug | Cisplatin | |||
| Molecule Alteration | Expression | Down-regulation |
||
| Experimental Note | Revealed Based on the Cell Line Data | |||
| Cell Pathway Regulation | Cell apoptosis | Activation | hsa04210 | |
| Cell proliferation | Inhibition | hsa05200 | ||
| PD-L1/PD-1 signaling pathway | Regulation | N.A. | ||
| In Vitro Model | SkOV3 cells | Ovary | Homo sapiens (Human) | CVCL_0532 |
| OVCAR3 cells | Ovary | Homo sapiens (Human) | CVCL_0465 | |
| Experiment for Molecule Alteration |
Western blot analysis | |||
| Experiment for Drug Resistance |
T-cell apoptosis assay | |||
| Mechanism Description | High expression levels of miR-424(322) were positively correlated with the PFS of ovarian cancer patients. miR-424(322) overexpression reduced PD-L1 and CD80 expression through direct binding to the 3'-UTR of these genes. Furthermore, low miR-424(322) and high PD-L1 expression were significantly correlated and strongly associated with chemoresistant phenotypes in ovarian cancer cells and tissues. Restoration of miR-424(322) expression (+) the sensitivity of cancer cells to drug treatment and was accompanied by T-cell activation by blocking the PD-L1 immune checkpoint in both in vitro and in vivo models. Our current findings indicate that miR-424(322) regulates PD-L1 and CD80 expression. Therefore, miR-424(322) might serve as a therapeutic target to enhance the chemosensitivity of ovarian cancer cells through checkpoint blockage, which thereby promotes the T-cell response in attacking tumour cells. | |||
| Drug Resistance Data Categorized by Their Corresponding Mechanisms | ||||
|
Unusual Activation of Pro-survival Pathway (UAPP)
|
||||
| Disease Class: egfr-mutant luad [ICD-11: 2C25.0] | [4] | |||
| Resistant Disease | egfr-mutant luad [ICD-11: 2C25.0] | |||
| Resistant Drug | Gefitinib | |||
| Molecule Alteration | Expression | Down-regulation |
||
| Experimental Note | Revealed Based on the Cell Line Data | |||
| Cell Pathway Regulation | Cell autophagy | Inhibition | hsa04140 | |
| In Vitro Model | PC-9 cells | Lung | Homo sapiens (Human) | CVCL_B260 |
| Experiment for Molecule Alteration |
Western blot assay | |||
| Experiment for Drug Resistance |
CCK8 assay | |||
| Mechanism Description | Our results suggested that PD-L1 might play a role in promoting autophagy and inhibiting apoptosis, which was responsible for the generation of primary resistance to EGFR-TKIs, and the combination therapy exerted a synergistic antitumor effect by inhibiting the activation of the MAPK/ERK signaling pathway. | |||
| Disease Class: egfr-mutant luad [ICD-11: 2C25.0] | [4] | |||
| Resistant Disease | egfr-mutant luad [ICD-11: 2C25.0] | |||
| Resistant Drug | Gefitinib | |||
| Molecule Alteration | Expression | Up-regulation |
||
| Experimental Note | Revealed Based on the Cell Line Data | |||
| Cell Pathway Regulation | Cell autophagy | Inhibition | hsa04140 | |
| In Vitro Model | HCC827 cells | Lung | Homo sapiens (Human) | CVCL_2063 |
| Experiment for Molecule Alteration |
Western blot assay | |||
| Experiment for Drug Resistance |
CCK8 assay | |||
| Mechanism Description | Our results suggested that PD-L1 might play a role in promoting autophagy and inhibiting apoptosis, which was responsible for the generation of primary resistance to EGFR-TKIs, and the combination therapy exerted a synergistic antitumor effect by inhibiting the activation of the MAPK/ERK signaling pathway. | |||
| Drug Resistance Data Categorized by Their Corresponding Mechanisms | ||||
|
Unusual Activation of Pro-survival Pathway (UAPP)
|
||||
| Disease Class: Colon cancer [ICD-11: 2B90.1] | [5] | |||
| Resistant Disease | Colon cancer [ICD-11: 2B90.1] | |||
| Resistant Drug | Irinotecan | |||
| Molecule Alteration | Expression | Up-regulation |
||
| Experimental Note | Revealed Based on the Cell Line Data | |||
| Cell Pathway Regulation | NF+kB signaling pathway | Activation | hsa04218 | |
| In Vitro Model | DLD-1 cells | Colon | Homo sapiens (Human) | CVCL_0248 |
| SW-480 cells | Colon | Homo sapiens (Human) | CVCL_0546 | |
| RkO cells | Colon | Homo sapiens (Human) | CVCL_0504 | |
| Experiment for Molecule Alteration |
Immunoblotting assay; qRT-PCR; Immunofluorescence staining assay; Reporter Gene assay; RNA sequencing assay | |||
| Experiment for Drug Resistance |
Cell cytotoxicity assay; Tumorigenicity assay | |||
| Mechanism Description | Our data suggest that irinotecan upregulates various oncogenes, proliferative pathways, and metastatic markers, which may compromise its efficacy. SN38 induces p53-independent CDKIs and regulates cancer cell growth. OPN silencing regulates the SN38-mediated increase in PD-L1. Inhibition of non-canonical NF-kappaB signaling by QNZ results in the regulation of SN38-induced survivin and ISG15 (Figure 7). The targeting of OPN, PD-L1, ISG15, and NF-kappaB pathways may elevate irinotecan potency and lead to its combination with immunomodulatory therapies for CRC prognostic strategies. | |||
Disease- and Tissue-specific Abundances of This Molecule
ICD Disease Classification 02

| Differential expression of molecule in resistant diseases | ||
| The Studied Tissue | Nervous tissue | |
| The Specified Disease | Brain cancer | |
| The Expression Level of Disease Section Compare with the Healthy Individual Tissue | p-value: 4.19E-01; Fold-change: -2.03E-02; Z-score: -5.60E-02 | |
|
Molecule expression in the diseased tissue of patients
Molecule expression in the normal tissue of healthy individuals
|
||
| Disease-specific Molecule Abundances |
|
Click to View the Clearer Original Diagram |
| The Studied Tissue | Brainstem tissue | |
| The Specified Disease | Glioma | |
| The Expression Level of Disease Section Compare with the Healthy Individual Tissue | p-value: 1.29E-01; Fold-change: -9.42E-01; Z-score: -3.08E+00 | |
|
Molecule expression in the diseased tissue of patients
Molecule expression in the normal tissue of healthy individuals
|
||
| Disease-specific Molecule Abundances |
|
Click to View the Clearer Original Diagram |
| The Studied Tissue | White matter | |
| The Specified Disease | Glioma | |
| The Expression Level of Disease Section Compare with the Healthy Individual Tissue | p-value: 8.52E-02; Fold-change: 5.74E-01; Z-score: 7.69E-01 | |
|
Molecule expression in the diseased tissue of patients
Molecule expression in the normal tissue of healthy individuals
|
||
| Disease-specific Molecule Abundances |

|
Click to View the Clearer Original Diagram |
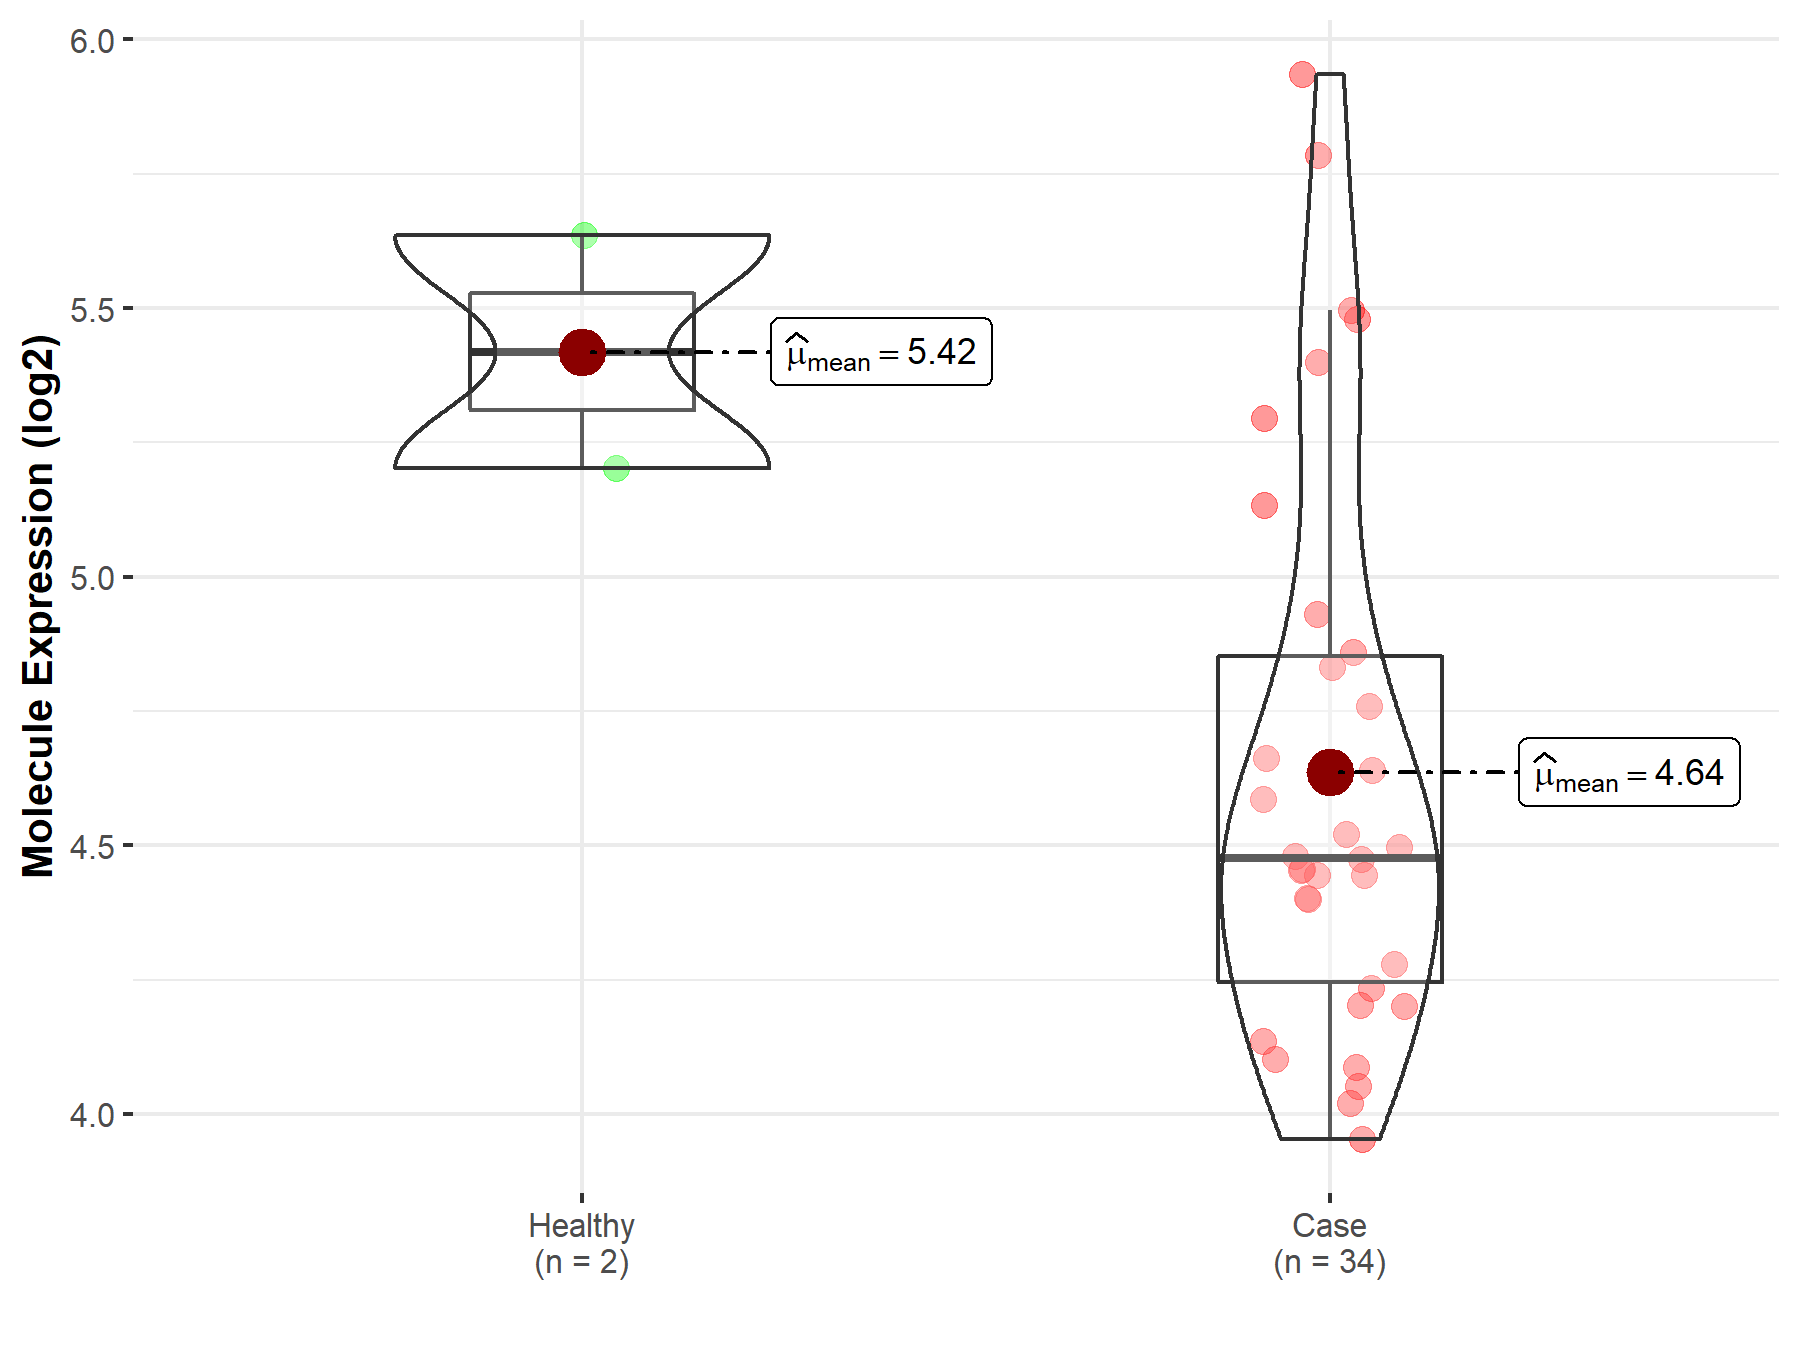
| The Studied Tissue | Brainstem tissue | |
| The Specified Disease | Neuroectodermal tumor | |
| The Expression Level of Disease Section Compare with the Healthy Individual Tissue | p-value: 6.63E-05; Fold-change: -7.58E-01; Z-score: -2.71E+00 | |
|
Molecule expression in the diseased tissue of patients
Molecule expression in the normal tissue of healthy individuals
|
||
| Disease-specific Molecule Abundances |

|
Click to View the Clearer Original Diagram |
| Differential expression of molecule in resistant diseases | ||
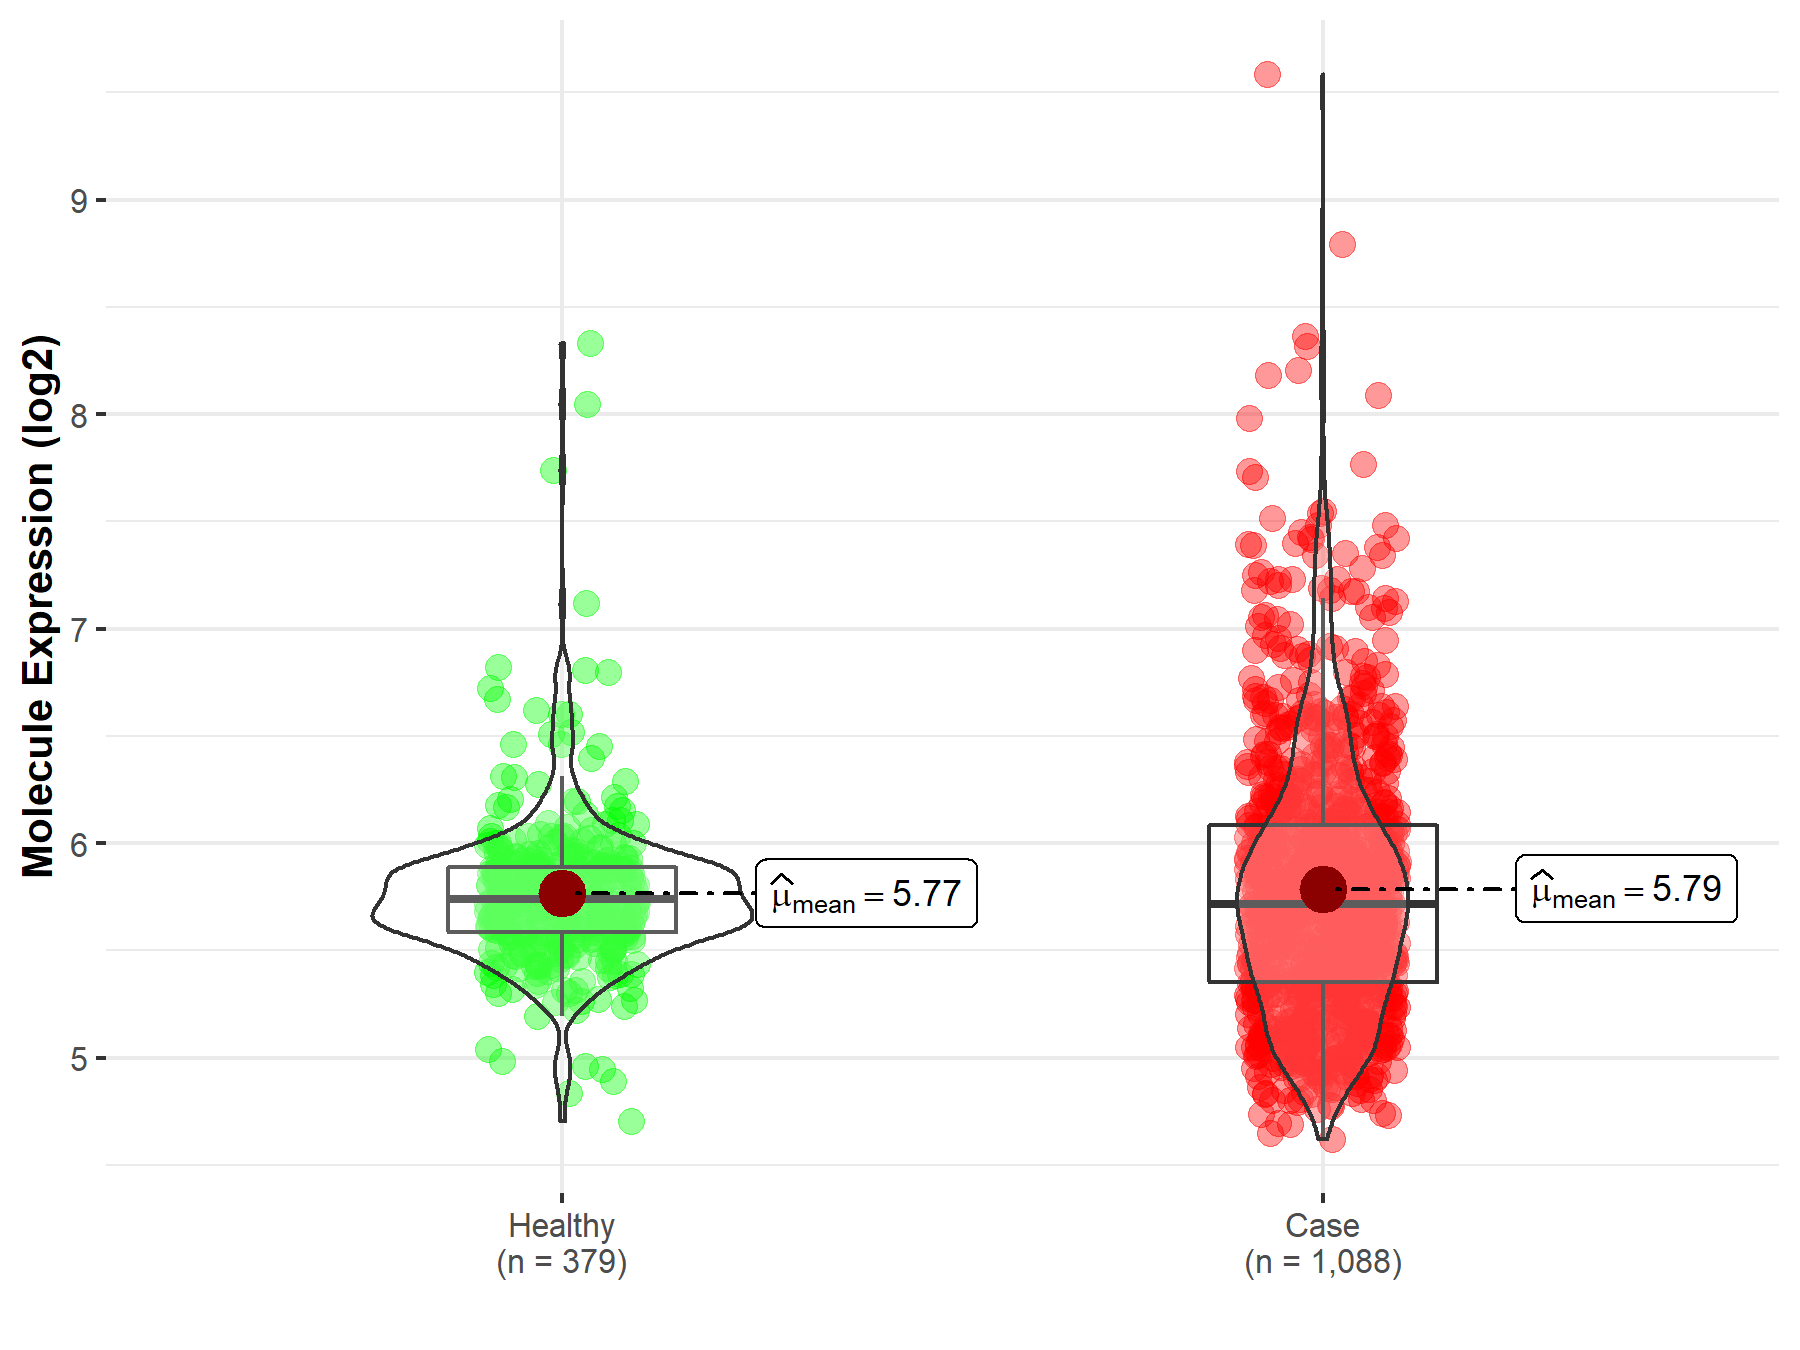
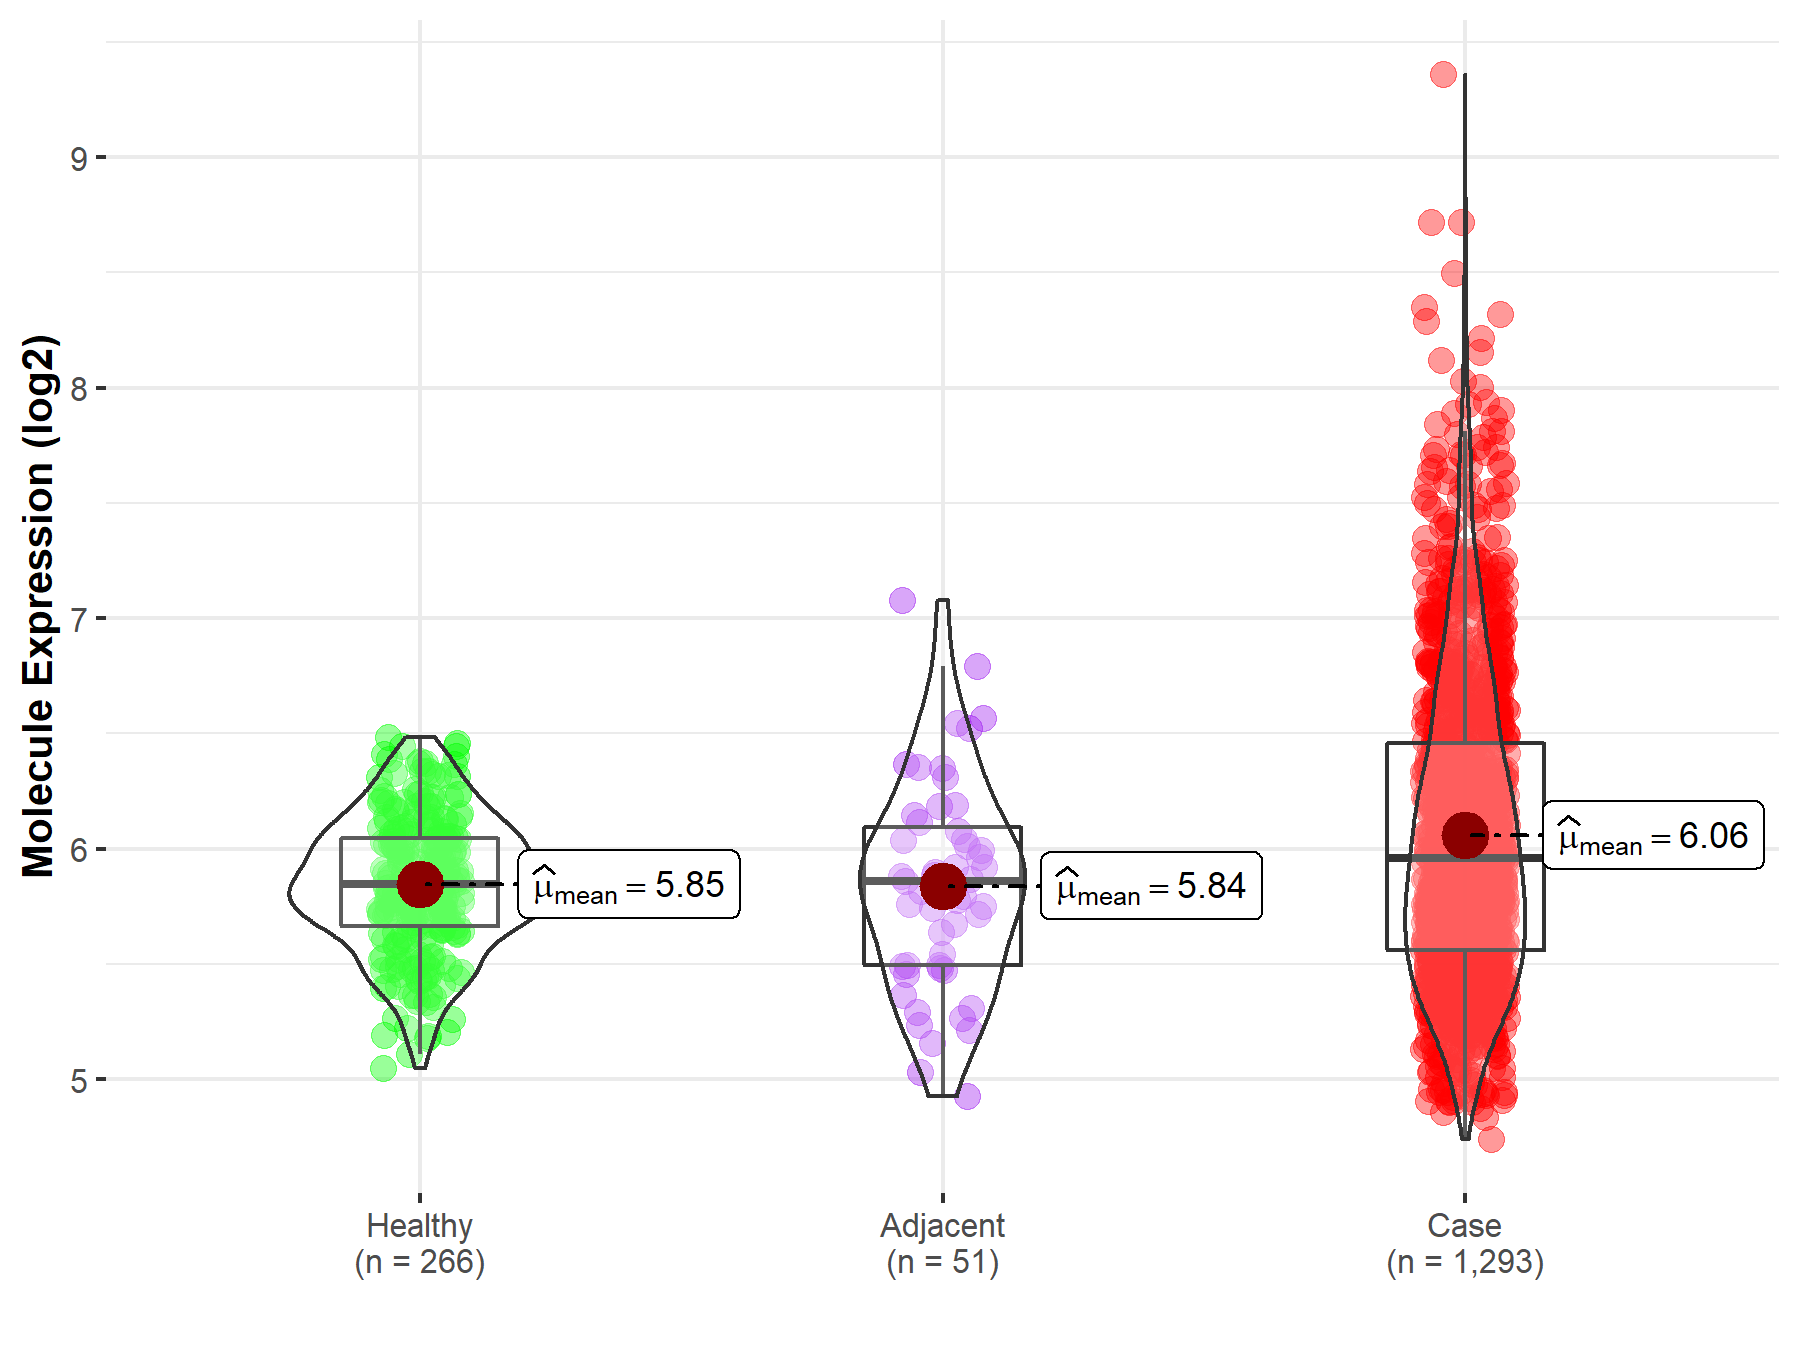
| The Studied Tissue | Breast tissue | |
| The Specified Disease | Breast cancer | |
| The Expression Level of Disease Section Compare with the Healthy Individual Tissue | p-value: 4.29E-16; Fold-change: 1.13E-01; Z-score: 3.89E-01 | |
| The Expression Level of Disease Section Compare with the Adjacent Tissue | p-value: 1.55E-03; Fold-change: 9.99E-02; Z-score: 2.19E-01 | |
|
Molecule expression in the normal tissue adjacent to the diseased tissue of patients
Molecule expression in the diseased tissue of patients
Molecule expression in the normal tissue of healthy individuals
|
||
| Disease-specific Molecule Abundances |
|
Click to View the Clearer Original Diagram |
References
If you find any error in data or bug in web service, please kindly report it to Dr. Sun and Dr. Yu.