Molecule Information
General Information of the Molecule (ID: Mol00668)
| Name |
Protransforming growth factor alpha (TGFA)
,Homo sapiens
|
||||
|---|---|---|---|---|---|
| Synonyms |
TGF-alpha; EGF-like TGF; ETGF; TGF type 1
Click to Show/Hide
|
||||
| Molecule Type |
Protein
|
||||
| Gene Name |
TGFA
|
||||
| Gene ID | |||||
| Location |
chr2:70447284-70554193[-]
|
||||
| Sequence |
MVPSAGQLALFALGIVLAACQALENSTSPLSADPPVAAAVVSHFNDCPDSHTQFCFHGTC
RFLVQEDKPACVCHSGYVGARCEHADLLAVVAASQKKQAITALVVVSIVALAVLIITCVL IHCCQVRKHCEWCRALICRHEKPSALLKGRTACCHSETVV Click to Show/Hide
|
||||
| 3D-structure |
|
||||
| Function |
TGF alpha is a mitogenic polypeptide that is able to bind to the EGF receptor/EGFR and to act synergistically with TGF beta to promote anchorage-independent cell proliferation in soft agar.
Click to Show/Hide
|
||||
| Uniprot ID | |||||
| Ensembl ID | |||||
| HGNC ID | |||||
| Click to Show/Hide the Complete Species Lineage | |||||
Type(s) of Resistant Mechanism of This Molecule
Drug Resistance Data Categorized by Drug
Clinical Trial Drug(s)
1 drug(s) in total
| Drug Sensitivity Data Categorized by Their Corresponding Mechanisms | ||||
|
|
||||
| Disease Class: Prostate cancer [ICD-11: 2C82.0] | [1] | |||
| Sensitive Disease | Prostate cancer [ICD-11: 2C82.0] | |||
| Sensitive Drug | Canertinib | |||
| Molecule Alteration | Expression | Up-regulation |
||
| Differential expression of the molecule in resistant disease | ||||
| Classification of Disease | Prostate cancer [ICD-11: 2C82] | |||
| The Specified Disease | Prostate cancer | |||
| The Studied Tissue | Blood | |||
| The Expression Level of Disease Section Compare with the Healthy Individual Tissue | p-value: 8.36E-10 Fold-change: 1.90E-01 Z-score: 6.41E+00 |
|||
| Experimental Note | Revealed Based on the Cell Line Data | |||
| Cell Pathway Regulation | Cell migration | Activation | hsa04670 | |
| Cell proliferation | Activation | hsa05200 | ||
| EGFR/RAS signaling pathway | Activation | hsa01521 | ||
| In Vitro Model | DU-145 cells | Prostate | Homo sapiens (Human) | CVCL_0105 |
| Experiment for Molecule Alteration |
Western blot analysis | |||
| Experiment for Drug Resistance |
Promega assay | |||
| Mechanism Description | The induction of bone metastasis and TkI resistance require miR-203 down-regulation, activation of the EGFR pathway via altered expression of EGFR ligands (EREG and TGFA) and anti-apoptotic proteins (API5, BIRC2, and TRIAP1). Importantly, a sufficient reconstitution of invasiveness and resistance to TkIs treatment was observed in cells transfected with anti-miR-203. In prostate cancer patients, miR-203 levels were inversely correlated with the expression of two EGFR ligands, EREG and TGFA, and an EGFR dependent gene signature. | |||
Investigative Drug(s)
1 drug(s) in total
| Drug Sensitivity Data Categorized by Their Corresponding Mechanisms | ||||
|
|
||||
| Disease Class: Prostate cancer [ICD-11: 2C82.0] | [1] | |||
| Sensitive Disease | Prostate cancer [ICD-11: 2C82.0] | |||
| Sensitive Drug | Tyrphostin AG-1478 | |||
| Molecule Alteration | Expression | Up-regulation |
||
| Differential expression of the molecule in resistant disease | ||||
| Classification of Disease | Prostate cancer [ICD-11: 2C82] | |||
| The Specified Disease | Prostate cancer | |||
| The Studied Tissue | Blood | |||
| The Expression Level of Disease Section Compare with the Healthy Individual Tissue | p-value: 8.36E-10 Fold-change: 1.90E-01 Z-score: 6.41E+00 |
|||
| Experimental Note | Revealed Based on the Cell Line Data | |||
| Cell Pathway Regulation | Cell migration | Activation | hsa04670 | |
| Cell proliferation | Activation | hsa05200 | ||
| EGFR/RAS signaling pathway | Activation | hsa01521 | ||
| In Vitro Model | DU-145 cells | Prostate | Homo sapiens (Human) | CVCL_0105 |
| Experiment for Molecule Alteration |
Western blot analysis | |||
| Experiment for Drug Resistance |
Promega assay | |||
| Mechanism Description | The induction of bone metastasis and TkI resistance require miR-203 down-regulation, activation of the EGFR pathway via altered expression of EGFR ligands (EREG and TGFA) and anti-apoptotic proteins (API5, BIRC2, and TRIAP1). Importantly, a sufficient reconstitution of invasiveness and resistance to TkIs treatment was observed in cells transfected with anti-miR-203. In prostate cancer patients, miR-203 levels were inversely correlated with the expression of two EGFR ligands, EREG and TGFA, and an EGFR dependent gene signature. | |||
Approved Drug(s)
1 drug(s) in total
| Drug Sensitivity Data Categorized by Their Corresponding Mechanisms | ||||
|
|
||||
| Disease Class: Anaplastic thyroid carcinoma [ICD-11: 2D10.3] | [2] | |||
| Sensitive Disease | Anaplastic thyroid carcinoma [ICD-11: 2D10.3] | |||
| Sensitive Drug | Cisplatin | |||
| Molecule Alteration | Expression | Down-regulation |
||
| Experimental Note | Revealed Based on the Cell Line Data | |||
| Cell Pathway Regulation | Cell apoptosis | Activation | hsa04210 | |
| Cell viability | Inhibition | hsa05200 | ||
| In Vitro Model | TPC-1 cells | Thyroid | Homo sapiens (Human) | CVCL_6298 |
| ARO cells | Thyroid | Homo sapiens (Human) | CVCL_0144 | |
| HTori3 cell | Thyroid | Homo sapiens (Human) | CVCL_4W02 | |
| In Vivo Model | Nude mouse xenograft model | Mus musculus | ||
| Experiment for Molecule Alteration |
Western blot analysis | |||
| Experiment for Drug Resistance |
MTT assay; Flow cytometry assay; TUNEL assay | |||
| Mechanism Description | miR-144 could inhibit autophagy of ATC cells by down-regulating TGF-alpha, enhancing the cisplatin-sensitivity of ATC cells. | |||
Disease- and Tissue-specific Abundances of This Molecule
ICD Disease Classification 02

| Differential expression of molecule in resistant diseases | ||
| The Studied Tissue | Prostate | |
| The Specified Disease | Prostate cancer | |
| The Expression Level of Disease Section Compare with the Healthy Individual Tissue | p-value: 9.33E-03; Fold-change: -5.43E-01; Z-score: -1.02E+00 | |
|
Molecule expression in the diseased tissue of patients
Molecule expression in the normal tissue of healthy individuals
|
||
| Disease-specific Molecule Abundances |

|
Click to View the Clearer Original Diagram |
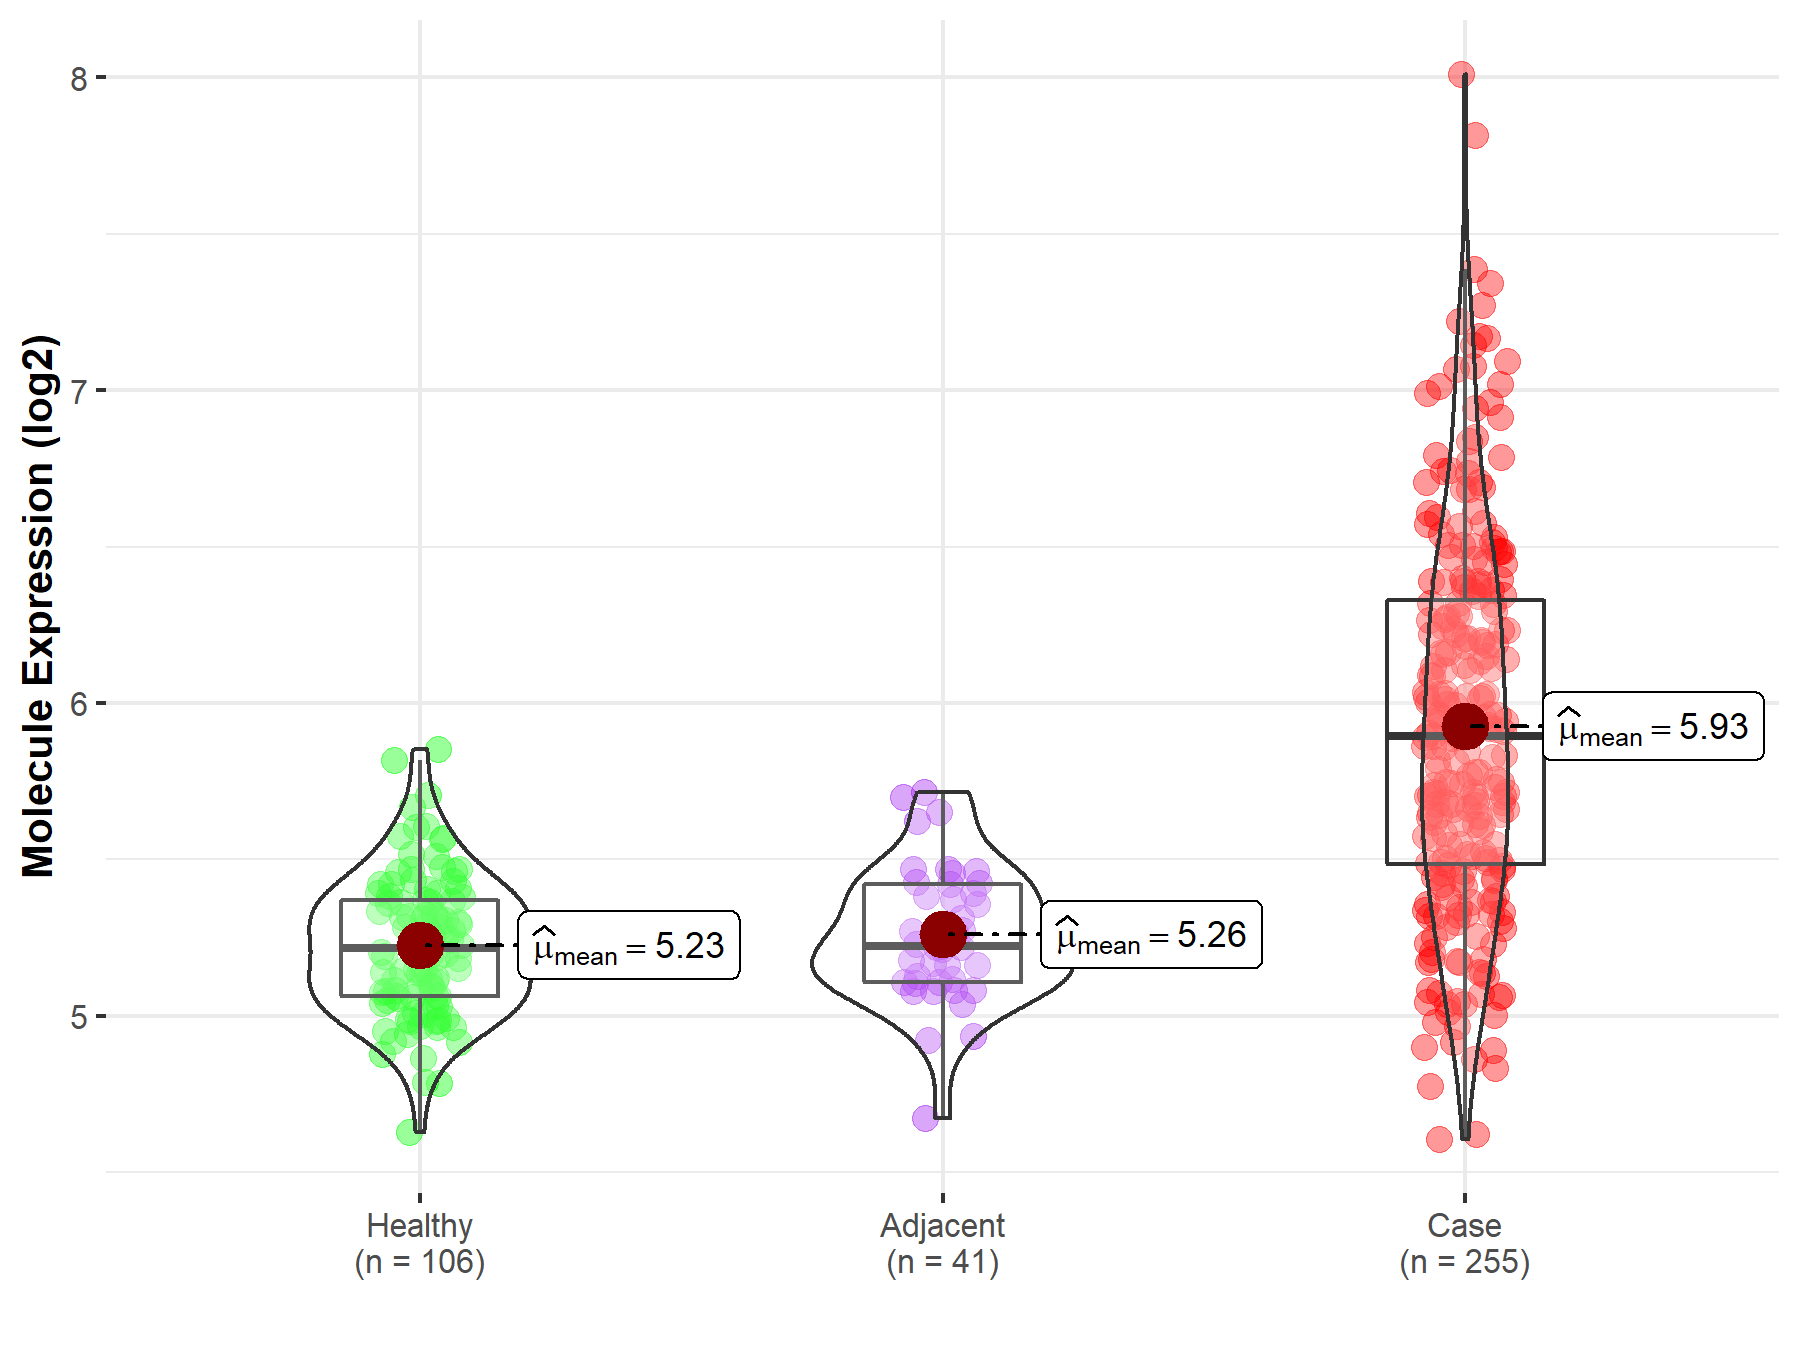
| Differential expression of molecule in resistant diseases | ||
| The Studied Tissue | Thyroid | |
| The Specified Disease | Thyroid cancer | |
| The Expression Level of Disease Section Compare with the Healthy Individual Tissue | p-value: 9.89E-44; Fold-change: 6.76E-01; Z-score: 3.03E+00 | |
| The Expression Level of Disease Section Compare with the Adjacent Tissue | p-value: 3.45E-27; Fold-change: 6.70E-01; Z-score: 3.09E+00 | |
|
Molecule expression in the normal tissue adjacent to the diseased tissue of patients
Molecule expression in the diseased tissue of patients
Molecule expression in the normal tissue of healthy individuals
|
||
| Disease-specific Molecule Abundances |

|
Click to View the Clearer Original Diagram |
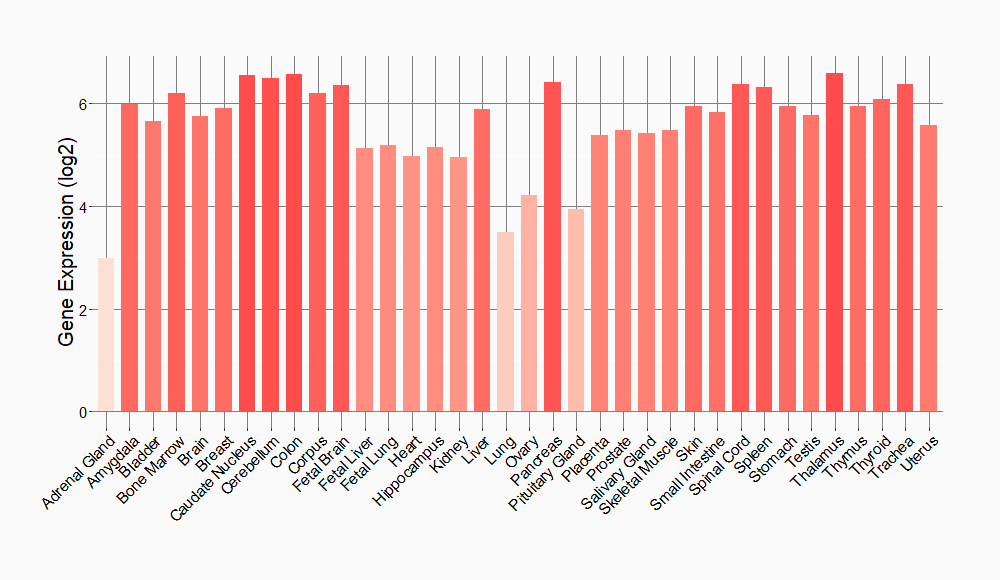
Tissue-specific Molecule Abundances in Healthy Individuals


|
||
References
If you find any error in data or bug in web service, please kindly report it to Dr. Sun and Dr. Yu.
