Molecule Information
General Information of the Molecule (ID: Mol00377)
| Name |
Forkhead box protein M1 (FOXM1)
,Homo sapiens
|
||||
|---|---|---|---|---|---|
| Synonyms |
Forkhead-related protein FKHL16; Hepatocyte nuclear factor 3 forkhead homolog 11; HFH-11; HNF-3/fork-head homolog 11; M-phase phosphoprotein 2; MPM-2 reactive phosphoprotein 2; Transcription factor Trident; Winged-helix factor from INS-1 cells; FKHL16; HFH11; MPP2; WIN
Click to Show/Hide
|
||||
| Molecule Type |
Protein
|
||||
| Gene Name |
FOXM1
|
||||
| Gene ID | |||||
| Location |
chr12:2857680-2877174[-]
|
||||
| Sequence |
MKTSPRRPLILKRRRLPLPVQNAPSETSEEEPKRSPAQQESNQAEASKEVAESNSCKFPA
GIKIINHPTMPNTQVVAIPNNANIHSIITALTAKGKESGSSGPNKFILISCGGAPTQPPG LRPQTQTSYDAKRTEVTLETLGPKPAARDVNLPRPPGALCEQKRETCADGEAAGCTINNS LSNIQWLRKMSSDGLGSRSIKQEMEEKENCHLEQRQVKVEEPSRPSASWQNSVSERPPYS YMAMIQFAINSTERKRMTLKDIYTWIEDHFPYFKHIAKPGWKNSIRHNLSLHDMFVRETS ANGKVSFWTIHPSANRYLTLDQVFKPLDPGSPQLPEHLESQQKRPNPELRRNMTIKTELP LGARRKMKPLLPRVSSYLVPIQFPVNQSLVLQPSVKVPLPLAASLMSSELARHSKRVRIA PKVLLAEEGIAPLSSAGPGKEEKLLFGEGFSPLLPVQTIKEEEIQPGEEMPHLARPIKVE SPPLEEWPSPAPSFKEESSHSWEDSSQSPTPRPKKSYSGLRSPTRCVSEMLVIQHRERRE RSRSRRKQHLLPPCVDEPELLFSEGPSTSRWAAELPFPADSSDPASQLSYSQEVGGPFKT PIKETLPISSTPSKSVLPRTPESWRLTPPAKVGGLDFSPVQTSQGASDPLPDPLGLMDLS TTPLQSAPPLESPQRLLSSEPLDLISVPFGNSSPSDIDVPKPGSPEPQVSGLAANRSLTE GLVLDTMNDSLSKILLDISFPGLDEDPLGPDNINWSQFIPELQ Click to Show/Hide
|
||||
| Function |
Transcription factor regulating the expression of cell cycle genes essential for DNA replication and mitosis. Plays a role in the control of cell proliferation. Also plays a role in DNA break repair, participating in the DNA damage checkpoint response. Promotes transcription of PHB2.
Click to Show/Hide
|
||||
| Uniprot ID | |||||
| Ensembl ID | |||||
| HGNC ID | |||||
| Click to Show/Hide the Complete Species Lineage | |||||
Type(s) of Resistant Mechanism of This Molecule
Drug Resistance Data Categorized by Drug
Approved Drug(s)
6 drug(s) in total
| Drug Sensitivity Data Categorized by Their Corresponding Mechanisms | ||||
|
|
||||
| Disease Class: Cervical cancer [ICD-11: 2C77.0] | [1] | |||
| Sensitive Disease | Cervical cancer [ICD-11: 2C77.0] | |||
| Sensitive Drug | Cisplatin | |||
| Molecule Alteration | Expression | Down-regulation |
||
| Experimental Note | Revealed Based on the Cell Line Data | |||
| Cell Pathway Regulation | Cell invasion | Inhibition | hsa05200 | |
| Cell migration | Inhibition | hsa04670 | ||
| Epithelial mesenchymal transition signaling pathway | Inhibition | hsa01521 | ||
| In Vitro Model | Hela cells | Cervix uteri | Homo sapiens (Human) | CVCL_0030 |
| Siha cells | Cervix uteri | Homo sapiens (Human) | CVCL_0032 | |
| Caski cells | Uterus | Homo sapiens (Human) | CVCL_1100 | |
| C33A cells | Uterus | Homo sapiens (Human) | CVCL_1094 | |
| Experiment for Molecule Alteration |
Immunohistochemistry; Western blot analysis; qRT-PCR | |||
| Experiment for Drug Resistance |
Wound healing assay; Transwell invasion assay; MTT assay | |||
| Mechanism Description | miR214 inhibits cell migration, invasion and promotes the drug sensitivity in human cervical cancer by targeting FOXM1. FOXM1 overexpression counteracts miR214 in cervical cancer, overexpression of FOXM1 reversed the inhibition in cell invasion caused by miR214 as well as the process of EMT, and neutralized the promotion of drug sensitivity to cisplatin that was induced by miR214. | |||
|
|
||||
| Disease Class: Gastric cancer [ICD-11: 2B72.1] | [2] | |||
| Sensitive Disease | Gastric cancer [ICD-11: 2B72.1] | |||
| Sensitive Drug | Cisplatin | |||
| Molecule Alteration | Expression | Down-regulation |
||
| Experimental Note | Revealed Based on the Cell Line Data | |||
| Cell Pathway Regulation | Cell viability | Inhibition | hsa05200 | |
| In Vitro Model | SGC7901 cells | Gastric | Homo sapiens (Human) | CVCL_0520 |
| In Vivo Model | Nude mouse xenograft model | Mus musculus | ||
| Experiment for Molecule Alteration |
Western blot analysis | |||
| Experiment for Drug Resistance |
MTT assay | |||
| Mechanism Description | miR-149 enhances SGC7901/DDP cell sensitivity to cisplatin by downregulating FoxM1 expression. | |||
| Drug Sensitivity Data Categorized by Their Corresponding Mechanisms | ||||
|
|
||||
| Disease Class: Rhabdoid tumor [ICD-11: 2A00.0Y] | [3] | |||
| Sensitive Disease | Rhabdoid tumor [ICD-11: 2A00.0Y] | |||
| Sensitive Drug | Doxorubicin | |||
| Molecule Alteration | Expression | Down-regulation |
||
| Experimental Note | Identified from the Human Clinical Data | |||
| In Vitro Model | Tm87-16 cells | Kidney | Homo sapiens (Human) | CVCL_8001 |
| TTC549 cells | Liver | Homo sapiens (Human) | CVCL_8005 | |
| STM91-01 cells | Lung | Homo sapiens (Human) | CVCL_8000 | |
| Experiment for Molecule Alteration |
qRT-PCR; Western blotting assay | |||
| Experiment for Drug Resistance |
CCK8 assay | |||
| Mechanism Description | FOXM1 siRNA and FOXM1 inhibitor (thiostrepton) successfully downregulated the mRNA and protein expression of FOXM1 in vitro and the downregulation of FOXM1 inhibited cell proliferation, drug resistance to doxorubicin, migration, invasion, and caused the cell cycle arrest and apoptosis of MRT cell lines. | |||
| Drug Sensitivity Data Categorized by Their Corresponding Mechanisms | ||||
|
|
||||
| Disease Class: Colorectal cancer [ICD-11: 2B91.1] | [4] | |||
| Sensitive Disease | Colorectal cancer [ICD-11: 2B91.1] | |||
| Sensitive Drug | Fluorouracil | |||
| Molecule Alteration | Expression | Down-regulation |
||
| Experimental Note | Revealed Based on the Cell Line Data | |||
| Cell Pathway Regulation | Cell viability | Inhibition | hsa05200 | |
| In Vitro Model | HT29 Cells | Colon | Homo sapiens (Human) | CVCL_A8EZ |
| SW480 cells | Colon | Homo sapiens (Human) | CVCL_0546 | |
| DLD1 cells | Colon | Homo sapiens (Human) | CVCL_0248 | |
| SW620 cells | Colon | Homo sapiens (Human) | CVCL_0547 | |
| Experiment for Molecule Alteration |
Western blot analysis | |||
| Experiment for Drug Resistance |
MTT assay | |||
| Mechanism Description | miR-761 suppressed colorectal cancer cell proliferation and invasion by downregulating FOXM1. | |||
| Disease Class: Colorectal cancer [ICD-11: 2B91.1] | [5] | |||
| Sensitive Disease | Colorectal cancer [ICD-11: 2B91.1] | |||
| Sensitive Drug | Fluorouracil | |||
| Molecule Alteration | Expression | Down-regulation |
||
| Experimental Note | Revealed Based on the Cell Line Data | |||
| Cell Pathway Regulation | AKT/mTOR signaling pathway | Regulation | N.A. | |
| Cell invasion | Inhibition | hsa05200 | ||
| Cell migration | Inhibition | hsa04670 | ||
| In Vitro Model | HCT-8 cells | Colon | Homo sapiens (Human) | CVCL_2478 |
| LOVO cells | Colon | Homo sapiens (Human) | CVCL_0399 | |
| Experiment for Molecule Alteration |
Western blot analysis | |||
| Experiment for Drug Resistance |
MTT assay | |||
| Mechanism Description | Reduced miR-149 is a critical factor in the mechanisms by which CRC cells resist the cytotoxicity of 5-FU. Also, re-expression of miR-149 could increase the 5-FU sensitivity of CRC cells via enhancing 5-FU-inducing apoptosis by targeting FOXM1. | |||
| Disease Class: Colon cancer [ICD-11: 2B90.1] | [6] | |||
| Sensitive Disease | Colon cancer [ICD-11: 2B90.1] | |||
| Sensitive Drug | Fluorouracil | |||
| Molecule Alteration | Expression | Down-regulation |
||
| Experimental Note | Identified from the Human Clinical Data | |||
| Cell Pathway Regulation | Cell apoptosis | Activation | hsa04210 | |
| Cell invasion | Inhibition | hsa05200 | ||
| Cell migration | Inhibition | hsa04670 | ||
| Cell proliferation | Inhibition | hsa05200 | ||
| Wnt/Beta-catenin signaling pathway | Inhibition | hsa04310 | ||
| In Vitro Model | HCT116 cells | Colon | Homo sapiens (Human) | CVCL_0291 |
| HT-29 cells | Colon | Homo sapiens (Human) | CVCL_0320 | |
| Experiment for Molecule Alteration |
Western blot analysis | |||
| Experiment for Drug Resistance |
MTT assay | |||
| Mechanism Description | miR-320 enhances the sensitivity of human colon cancer cells to chemoradiotherapy in vitro by targeting FOXM1. | |||
| Drug Resistance Data Categorized by Their Corresponding Mechanisms | ||||
|
|
||||
| Disease Class: Pancreatic ductal adenocarcinoma [ICD-11: 2C10.0] | [7] | |||
| Resistant Disease | Pancreatic ductal adenocarcinoma [ICD-11: 2C10.0] | |||
| Resistant Drug | Gemcitabine | |||
| Molecule Alteration | Expressiom | T1080S |
||
| Experimental Note | Revealed Based on the Cell Line Data | |||
| In Vitro Model | HPC cells | N.A. | Homo sapiens (Human) | N.A. |
| Experiment for Drug Resistance |
CCK8 assay | |||
| Mechanism Description | Overall, this study illustrates that Huaier augments the tumor-killing effect of gemcitabine through suppressing the stemness induced by gemcitabine in a FoxM1-dependent way. These results indicate that Huaier can be applied to overcome gemcitabine resistance. | |||
| Drug Sensitivity Data Categorized by Their Corresponding Mechanisms | ||||
|
|
||||
| Disease Class: Chronic myeloid leukemia [ICD-11: 2A20.0] | [8] | |||
| Sensitive Disease | Chronic myeloid leukemia [ICD-11: 2A20.0] | |||
| Sensitive Drug | Omacetaxine mepesuccinate | |||
| Molecule Alteration | Expression | Down-regulation |
||
| Experimental Note | Identified from the Human Clinical Data | |||
| Cell Pathway Regulation | miR370/FoxM1 signaling pathway | Regulation | N.A. | |
| In Vitro Model | K562 cells | Blood | Homo sapiens (Human) | CVCL_0004 |
| Experiment for Molecule Alteration |
Western blot analysis | |||
| Experiment for Drug Resistance |
Flow cytometry assay | |||
| Mechanism Description | miR-370 sensitized k562 cells to HHT by inducing apoptosis in part by downregulation of FoxM1 expression. | |||
| Drug Sensitivity Data Categorized by Their Corresponding Mechanisms | ||||
|
|
||||
| Disease Class: Colon cancer [ICD-11: 2B90.1] | [6] | |||
| Sensitive Disease | Colon cancer [ICD-11: 2B90.1] | |||
| Sensitive Drug | Oxaliplatin | |||
| Molecule Alteration | Expression | Down-regulation |
||
| Experimental Note | Identified from the Human Clinical Data | |||
| Cell Pathway Regulation | Cell invasion | Inhibition | hsa05200 | |
| Cell migration | Inhibition | hsa04670 | ||
| Cell proliferation | Inhibition | hsa05200 | ||
| Wnt/Beta-catenin signaling pathway | Inhibition | hsa04310 | ||
| In Vitro Model | HCT116 cells | Colon | Homo sapiens (Human) | CVCL_0291 |
| HT-29 cells | Colon | Homo sapiens (Human) | CVCL_0320 | |
| Experiment for Molecule Alteration |
Western blot analysis | |||
| Experiment for Drug Resistance |
MTT assay | |||
| Mechanism Description | miR-320 enhances the sensitivity of human colon cancer cells to chemoradiotherapy in vitro by targeting FOXM1. | |||
Clinical Trial Drug(s)
1 drug(s) in total
| Drug Resistance Data Categorized by Their Corresponding Mechanisms | ||||
|
|
||||
| Disease Class: Pancreatic ductal adenocarcinoma [ICD-11: 2C10.0] | [7] | |||
| Resistant Disease | Pancreatic ductal adenocarcinoma [ICD-11: 2C10.0] | |||
| Resistant Drug | Thiostrepton | |||
| Molecule Alteration | Expressiom | Up-regulation |
||
| Experimental Note | Discovered Using In-vivo Testing Model | |||
| In Vivo Model | nude mice injected Panc-1 cells | Mus musculus | ||
| Experiment for Drug Resistance |
Tumor evaluation assay | |||
| Mechanism Description | Overall, this study illustrates that Huaier augments the tumor-killing effect of gemcitabine through suppressing the stemness induced by gemcitabine in a FoxM1-dependent way. These results indicate that Huaier can be applied to overcome gemcitabine resistance. | |||
Investigative Drug(s)
2 drug(s) in total
| Drug Sensitivity Data Categorized by Their Corresponding Mechanisms | ||||
|
|
||||
| Disease Class: Pancreatic ductal adenocarcinoma [ICD-11: 2C10.0] | [7] | |||
| Sensitive Disease | Pancreatic ductal adenocarcinoma [ICD-11: 2C10.0] | |||
| Sensitive Drug | Gemcitabine/Huaier | |||
| Molecule Alteration | Expressiom | Up-regulation |
||
| Experimental Note | Discovered Using In-vivo Testing Model | |||
| In Vivo Model | nude mice injected Panc-1 cells | Mus musculus | ||
| Experiment for Drug Resistance |
Tumor evaluation assay | |||
| Mechanism Description | Overall, this study illustrates that Huaier augments the tumor-killing effect of gemcitabine through suppressing the stemness induced by gemcitabine in a FoxM1-dependent way. These results indicate that Huaier can be applied to overcome gemcitabine resistance. | |||
| Drug Sensitivity Data Categorized by Their Corresponding Mechanisms | ||||
|
|
||||
| Disease Class: Pancreatic ductal adenocarcinoma [ICD-11: 2C10.0] | [7] | |||
| Sensitive Disease | Pancreatic ductal adenocarcinoma [ICD-11: 2C10.0] | |||
| Sensitive Drug | Huaier | |||
| Molecule Alteration | Expressiom | S1148G |
||
| Experimental Note | Revealed Based on the Cell Line Data | |||
| In Vitro Model | HPC cells | N.A. | Homo sapiens (Human) | N.A. |
| Experiment for Drug Resistance |
CCK8 assay | |||
| Mechanism Description | Overall, this study illustrates that Huaier augments the tumor-killing effect of gemcitabine through suppressing the stemness induced by gemcitabine in a FoxM1-dependent way. These results indicate that Huaier can be applied to overcome gemcitabine resistance. | |||
| Disease Class: Pancreatic ductal adenocarcinoma [ICD-11: 2C10.0] | [7] | |||
| Sensitive Disease | Pancreatic ductal adenocarcinoma [ICD-11: 2C10.0] | |||
| Sensitive Drug | Huaier | |||
| Molecule Alteration | Expressiom | S1148R |
||
| Experimental Note | Revealed Based on the Cell Line Data | |||
| In Vitro Model | MiaPaCa-2 cells | Blood | Homo sapiens (Human) | CVCL_0428 |
| Experiment for Drug Resistance |
CCK8 assay | |||
| Mechanism Description | Overall, this study illustrates that Huaier augments the tumor-killing effect of gemcitabine through suppressing the stemness induced by gemcitabine in a FoxM1-dependent way. These results indicate that Huaier can be applied to overcome gemcitabine resistance. | |||
| Disease Class: Pancreatic ductal adenocarcinoma [ICD-11: 2C10.0] | [7] | |||
| Sensitive Disease | Pancreatic ductal adenocarcinoma [ICD-11: 2C10.0] | |||
| Sensitive Drug | Huaier | |||
| Molecule Alteration | Expressiom | S2702T |
||
| Experimental Note | Revealed Based on the Cell Line Data | |||
| In Vitro Model | Panc1 cells | Pancreas | Homo sapiens (Human) | CVCL_0480 |
| Experiment for Drug Resistance |
CCK8 assay | |||
| Mechanism Description | Overall, this study illustrates that Huaier augments the tumor-killing effect of gemcitabine through suppressing the stemness induced by gemcitabine in a FoxM1-dependent way. These results indicate that Huaier can be applied to overcome gemcitabine resistance. | |||
Disease- and Tissue-specific Abundances of This Molecule
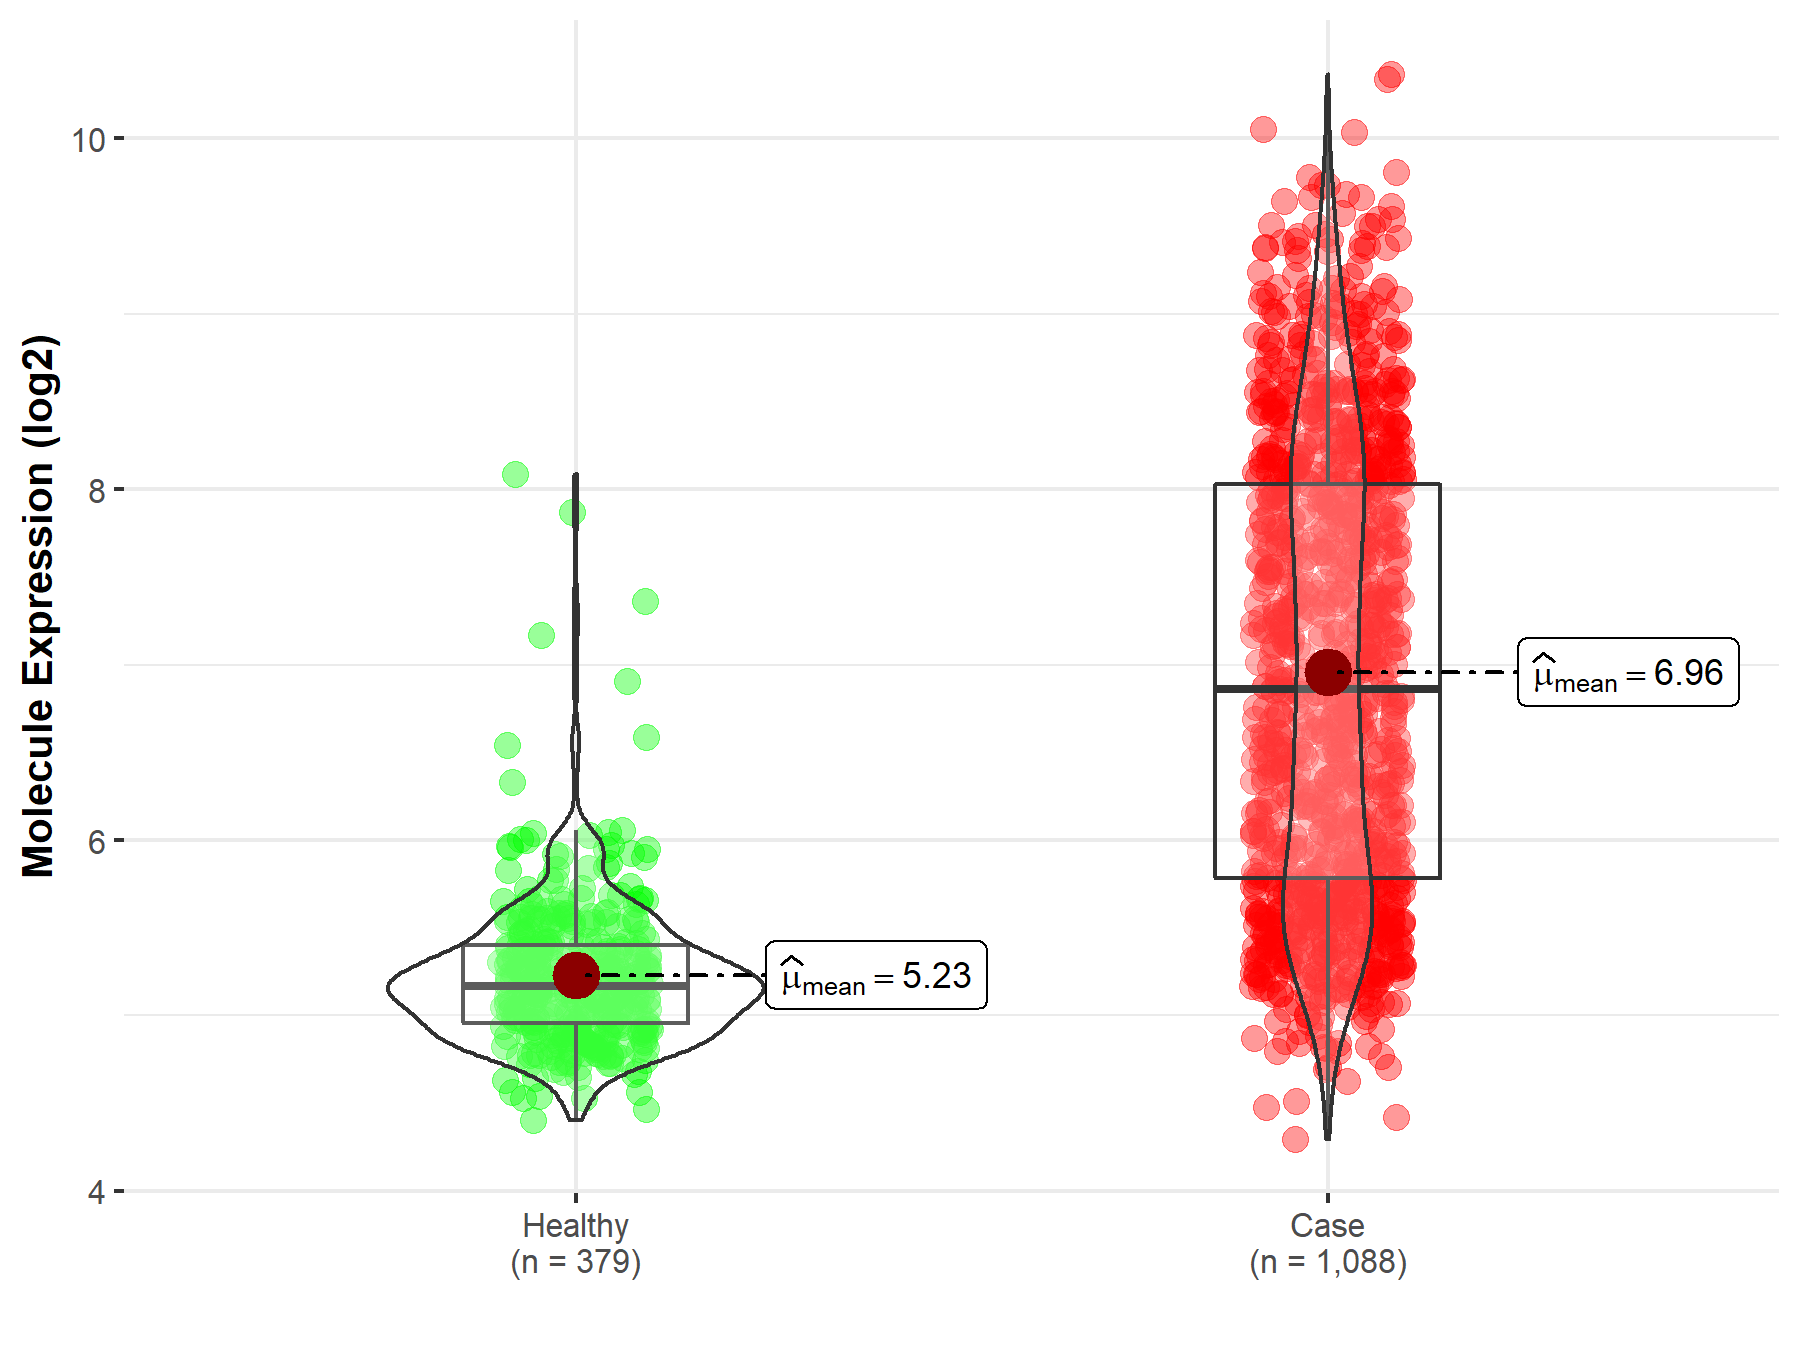
ICD Disease Classification 02

| Differential expression of molecule in resistant diseases | ||
| The Studied Tissue | Nervous tissue | |
| The Specified Disease | Brain cancer | |
| The Expression Level of Disease Section Compare with the Healthy Individual Tissue | p-value: 1.16E-225; Fold-change: 1.69E+00; Z-score: 3.92E+00 | |
|
Molecule expression in the diseased tissue of patients
Molecule expression in the normal tissue of healthy individuals
|
||
| Disease-specific Molecule Abundances |

|
Click to View the Clearer Original Diagram |
| The Studied Tissue | Brainstem tissue | |
| The Specified Disease | Glioma | |
| The Expression Level of Disease Section Compare with the Healthy Individual Tissue | p-value: 3.33E-03; Fold-change: 2.14E+00; Z-score: 6.76E+00 | |
|
Molecule expression in the diseased tissue of patients
Molecule expression in the normal tissue of healthy individuals
|
||
| Disease-specific Molecule Abundances |

|
Click to View the Clearer Original Diagram |
| The Studied Tissue | White matter | |
| The Specified Disease | Glioma | |
| The Expression Level of Disease Section Compare with the Healthy Individual Tissue | p-value: 2.76E-08; Fold-change: 9.91E-01; Z-score: 3.38E+00 | |
|
Molecule expression in the diseased tissue of patients
Molecule expression in the normal tissue of healthy individuals
|
||
| Disease-specific Molecule Abundances |

|
Click to View the Clearer Original Diagram |
| The Studied Tissue | Brainstem tissue | |
| The Specified Disease | Neuroectodermal tumor | |
| The Expression Level of Disease Section Compare with the Healthy Individual Tissue | p-value: 1.55E-08; Fold-change: 1.77E+00; Z-score: 3.78E+00 | |
|
Molecule expression in the diseased tissue of patients
Molecule expression in the normal tissue of healthy individuals
|
||
| Disease-specific Molecule Abundances |

|
Click to View the Clearer Original Diagram |
| Differential expression of molecule in resistant diseases | ||
| The Studied Tissue | Whole blood | |
| The Specified Disease | Myelofibrosis | |
| The Expression Level of Disease Section Compare with the Healthy Individual Tissue | p-value: 4.41E-01; Fold-change: 1.55E-01; Z-score: 1.55E+00 | |
|
Molecule expression in the diseased tissue of patients
Molecule expression in the normal tissue of healthy individuals
|
||
| Disease-specific Molecule Abundances |

|
Click to View the Clearer Original Diagram |
| The Studied Tissue | Whole blood | |
| The Specified Disease | Polycythemia vera | |
| The Expression Level of Disease Section Compare with the Healthy Individual Tissue | p-value: 6.62E-03; Fold-change: -4.83E-02; Z-score: -3.87E-01 | |
|
Molecule expression in the diseased tissue of patients
Molecule expression in the normal tissue of healthy individuals
|
||
| Disease-specific Molecule Abundances |

|
Click to View the Clearer Original Diagram |
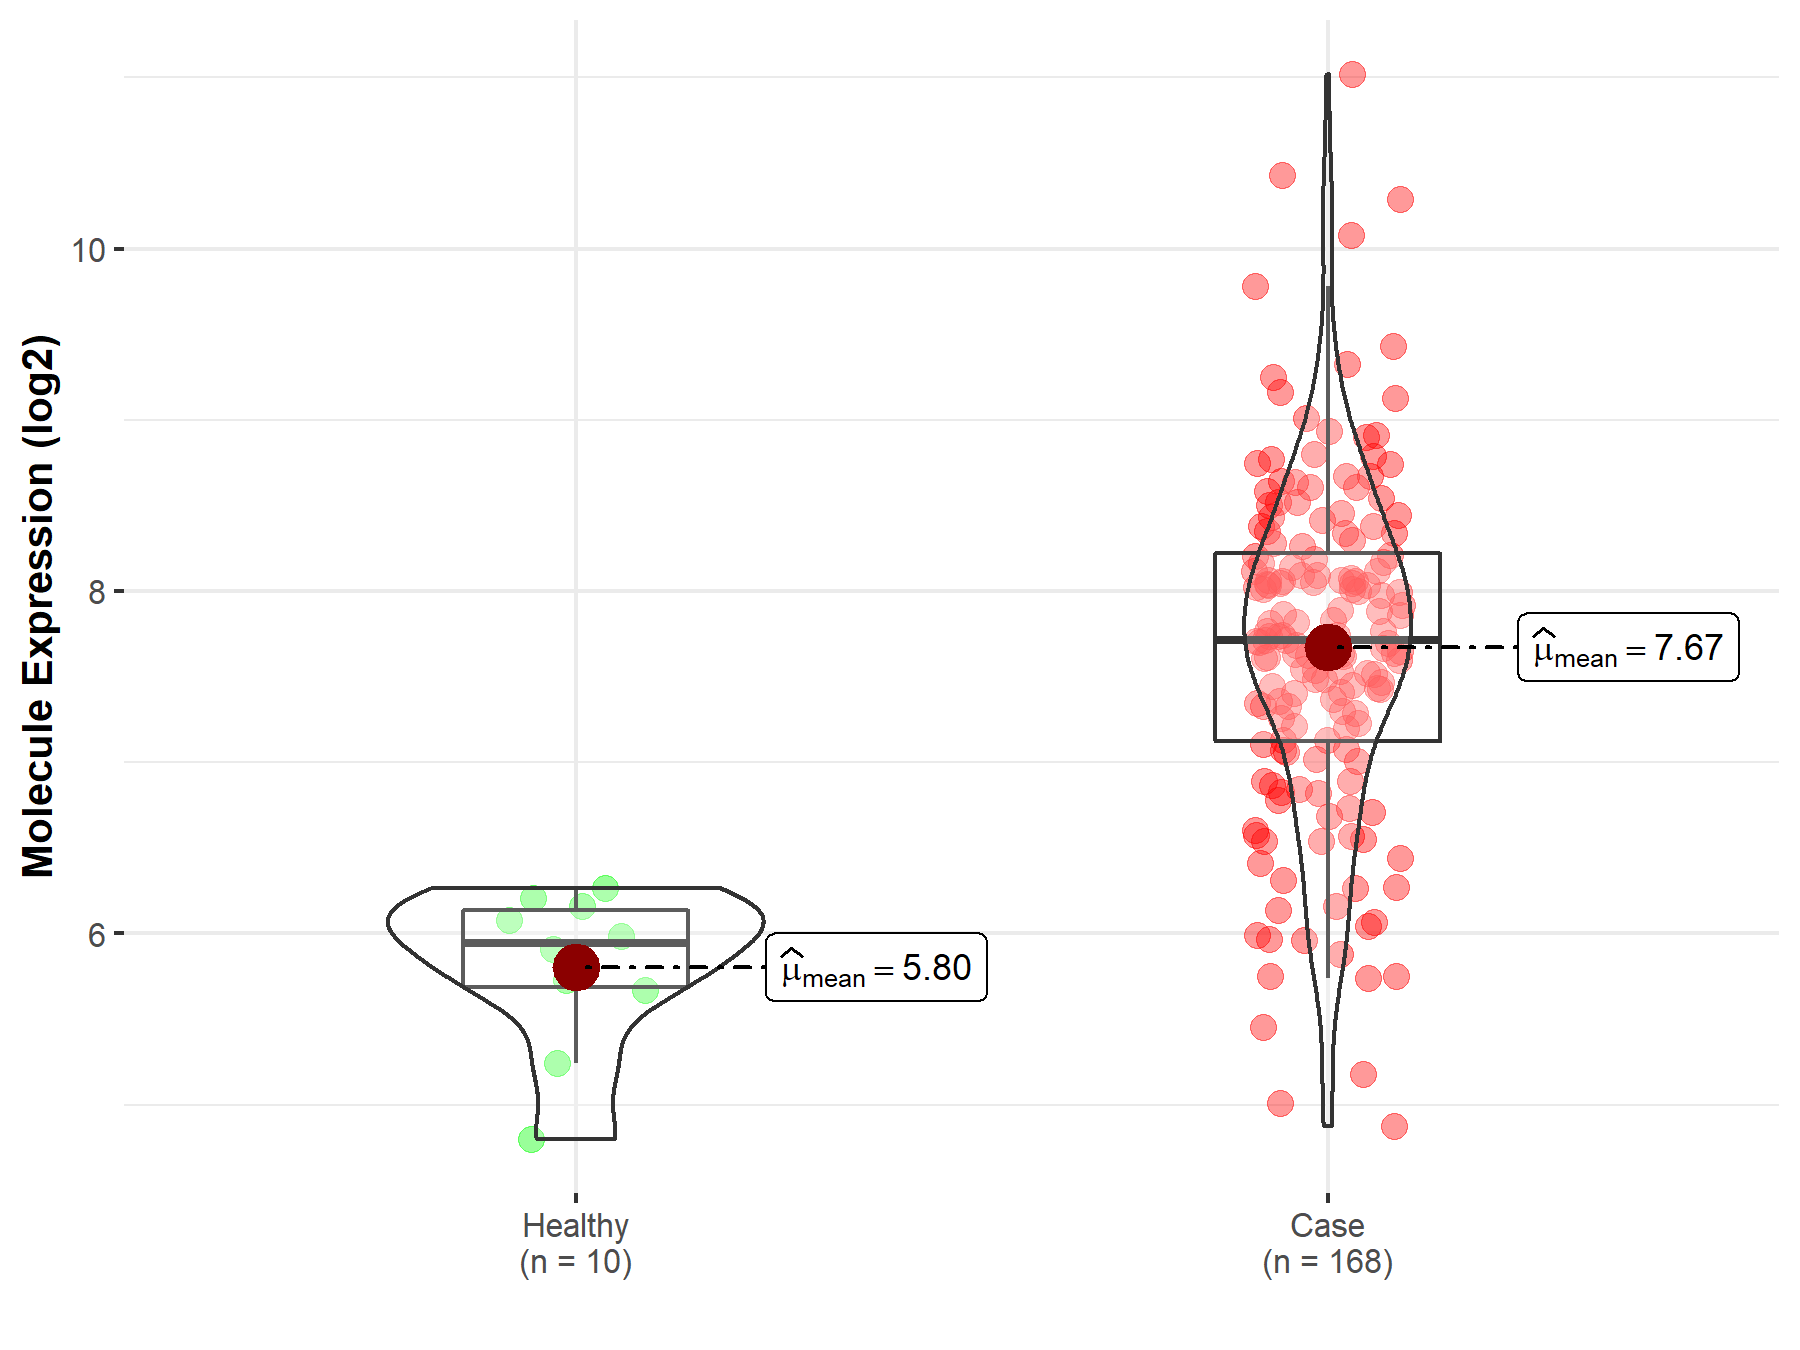
| Differential expression of molecule in resistant diseases | ||
| The Studied Tissue | Gastric tissue | |
| The Specified Disease | Gastric cancer | |
| The Expression Level of Disease Section Compare with the Healthy Individual Tissue | p-value: 3.87E-02; Fold-change: 2.50E+00; Z-score: 3.65E+00 | |
| The Expression Level of Disease Section Compare with the Adjacent Tissue | p-value: 1.71E-06; Fold-change: 1.51E+00; Z-score: 2.23E+00 | |
|
Molecule expression in the normal tissue adjacent to the diseased tissue of patients
Molecule expression in the diseased tissue of patients
Molecule expression in the normal tissue of healthy individuals
|
||
| Disease-specific Molecule Abundances |

|
Click to View the Clearer Original Diagram |
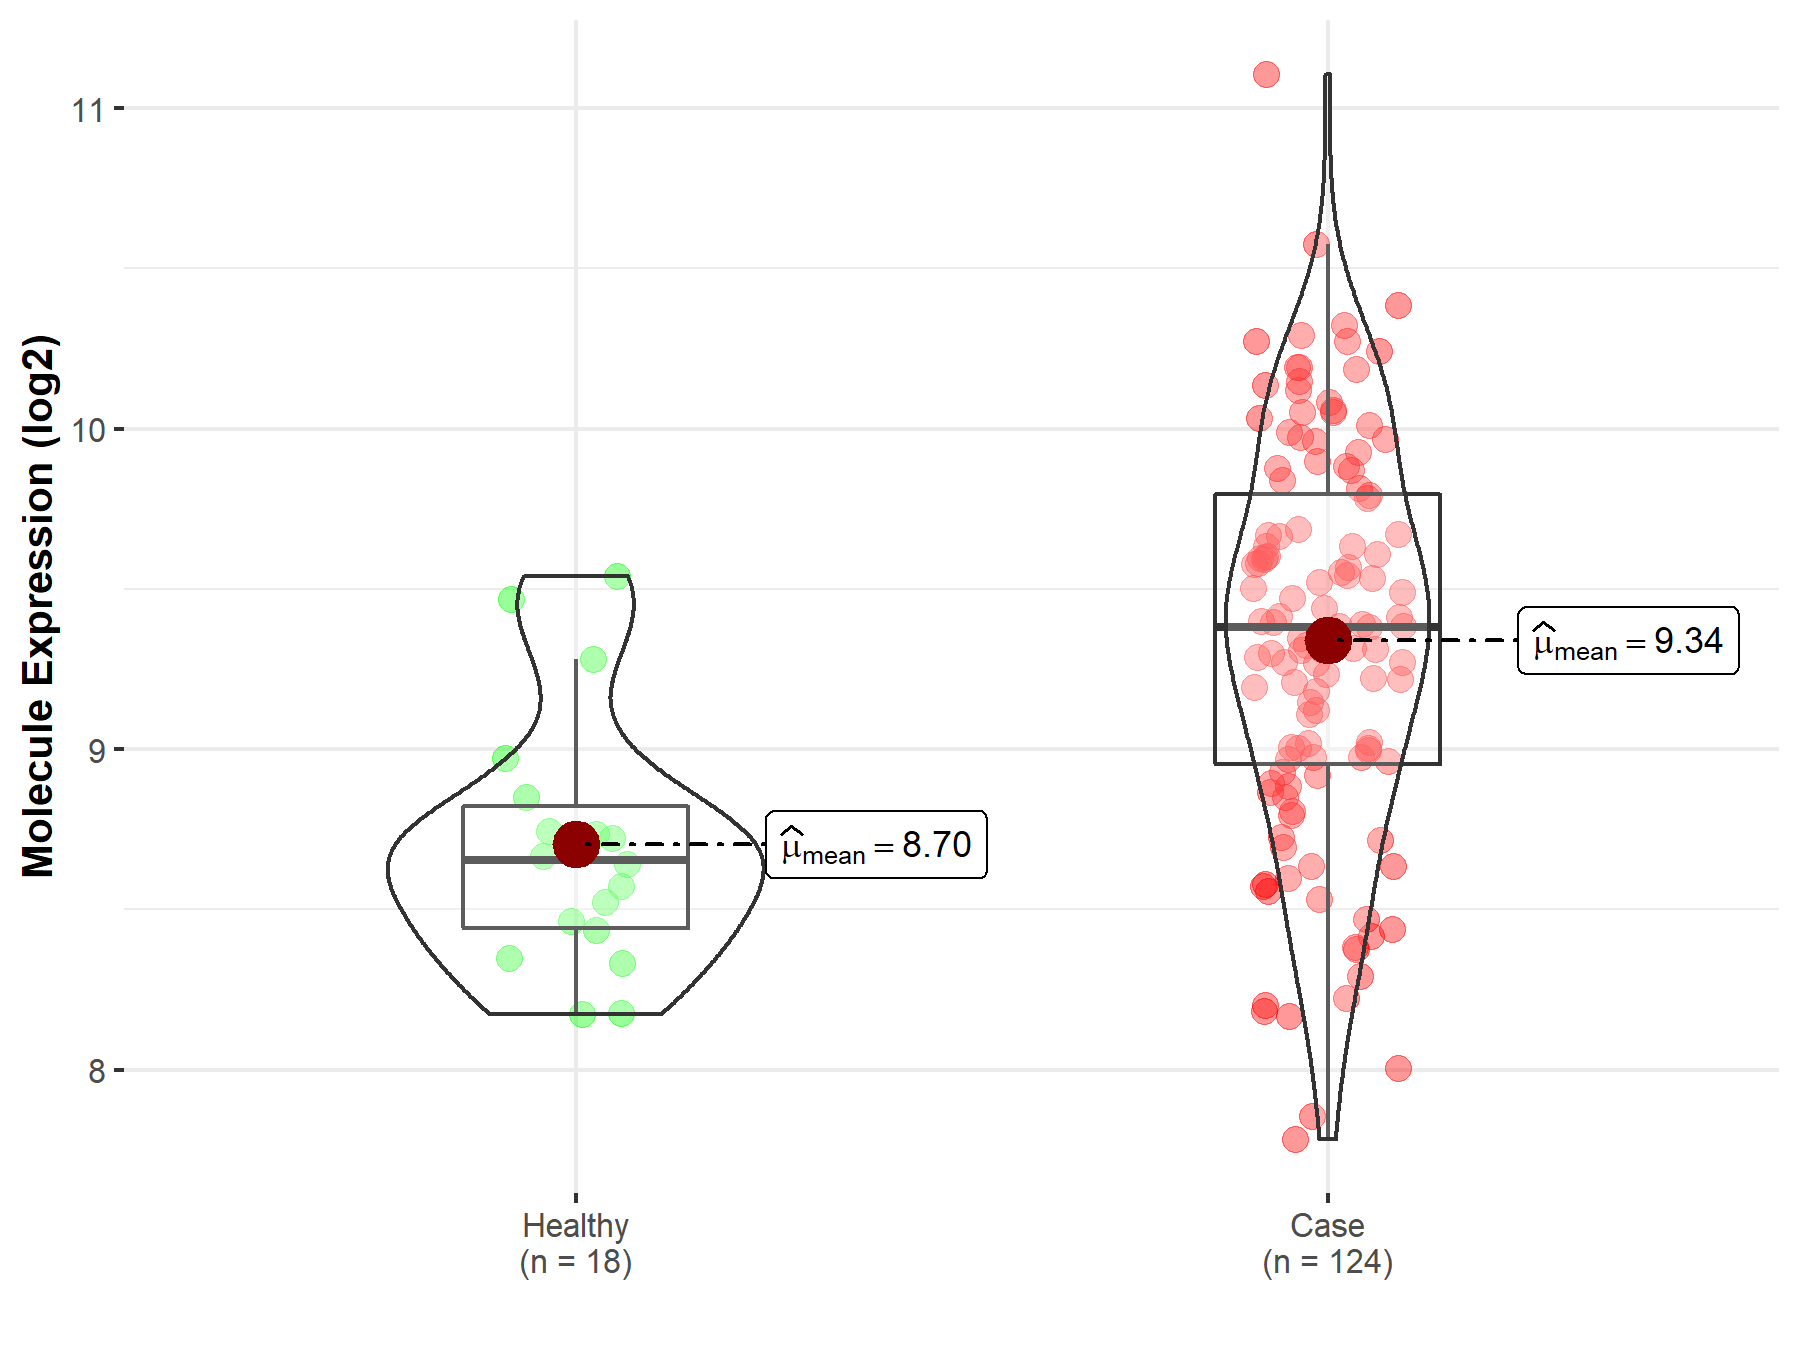
| Differential expression of molecule in resistant diseases | ||
| The Studied Tissue | Colon | |
| The Specified Disease | Colon cancer | |
| The Expression Level of Disease Section Compare with the Healthy Individual Tissue | p-value: 1.03E-55; Fold-change: 1.27E+00; Z-score: 1.98E+00 | |
| The Expression Level of Disease Section Compare with the Adjacent Tissue | p-value: 8.47E-36; Fold-change: 1.52E+00; Z-score: 1.77E+00 | |
|
Molecule expression in the normal tissue adjacent to the diseased tissue of patients
Molecule expression in the diseased tissue of patients
Molecule expression in the normal tissue of healthy individuals
|
||
| Disease-specific Molecule Abundances |

|
Click to View the Clearer Original Diagram |
| Differential expression of molecule in resistant diseases | ||
| The Studied Tissue | Cervix uteri | |
| The Specified Disease | Cervical cancer | |
| The Expression Level of Disease Section Compare with the Healthy Individual Tissue | p-value: 2.23E-06; Fold-change: 7.28E-01; Z-score: 1.82E+00 | |
|
Molecule expression in the diseased tissue of patients
Molecule expression in the normal tissue of healthy individuals
|
||
| Disease-specific Molecule Abundances |

|
Click to View the Clearer Original Diagram |
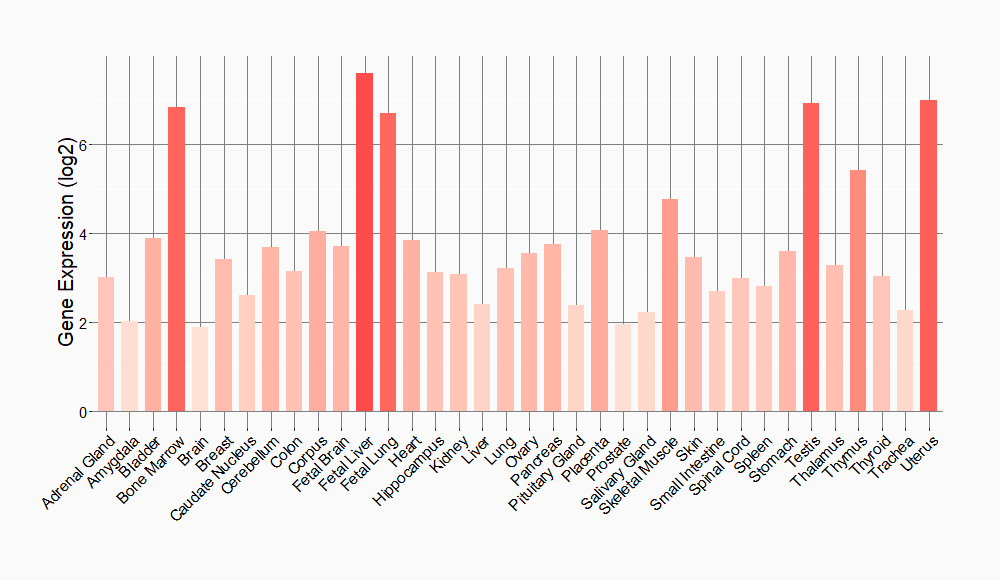
Tissue-specific Molecule Abundances in Healthy Individuals


|
||
References
If you find any error in data or bug in web service, please kindly report it to Dr. Sun and Dr. Yu.
