Molecule Information
General Information of the Molecule (ID: Mol00301)
| Name |
Cytochrome P450 family 3 subfamily A member1 (CYP3A4)
,Homo sapiens
|
||||
|---|---|---|---|---|---|
| Synonyms |
1;4-cineole 2-exo-monooxygenase; 1;8-cineole 2-exo-monooxygenase; Albendazole monooxygenase (sulfoxide-forming); Albendazole sulfoxidase; CYPIIIA3; CYPIIIA4; Cholesterol 25-hydroxylase; Cytochrome P450 3A3; Cytochrome P450 HLp; Cytochrome P450 NF-25; Cytochrome P450-PCN1; Nifedipine oxidase; Quinine 3-monooxygenase; CYP3A3
Click to Show/Hide
|
||||
| Molecule Type |
Protein
|
||||
| Gene Name |
CYP3A4
|
||||
| Gene ID | |||||
| Location |
chr7:99756960-99784248[-]
|
||||
| Sequence |
MALIPDLAMETWLLLAVSLVLLYLYGTHSHGLFKKLGIPGPTPLPFLGNILSYHKGFCMF
DMECHKKYGKVWGFYDGQQPVLAITDPDMIKTVLVKECYSVFTNRRPFGPVGFMKSAISI AEDEEWKRLRSLLSPTFTSGKLKEMVPIIAQYGDVLVRNLRREAETGKPVTLKDVFGAYS MDVITSTSFGVNIDSLNNPQDPFVENTKKLLRFDFLDPFFLSITVFPFLIPILEVLNICV FPREVTNFLRKSVKRMKESRLEDTQKHRVDFLQLMIDSQNSKETESHKALSDLELVAQSI IFIFAGYETTSSVLSFIMYELATHPDVQQKLQEEIDAVLPNKAPPTYDTVLQMEYLDMVV NETLRLFPIAMRLERVCKKDVEINGMFIPKGVVVMIPSYALHRDPKYWTEPEKFLPERFS KKNKDNIDPYIYTPFGSGPRNCIGMRFALMNMKLALIRVLQNFSFKPCKETQIPLKLSLG GLLQPEKPVVLKVESRDGTVSGA Click to Show/Hide
|
||||
| 3D-structure |
|
||||
| Function |
A cytochrome P450 monooxygenase involved in the metabolism of sterols, steroid hormones, retinoids and fatty acids. Mechanistically, uses molecular oxygen inserting one oxygen atom into a substrate, and reducing the second into a water molecule, with two electrons provided by NADPH via cytochrome P450 reductase (NADPH--hemoprotein reductase). Catalyzes the hydroxylation of carbon-hydrogen bonds. Exhibits high catalytic activity for the formation of hydroxyestrogens from estrone (E1) and 17beta-estradiol (E2), namely 2-hydroxy E1 and E2, as well as D-ring hydroxylated E1 and E2 at the C-16 position. Plays a role in the metabolism of androgens, particularly in oxidative deactivation of testosterone. Metabolizes testosterone to less biologically active 2beta- and 6beta-hydroxytestosterones. Contributes to the formation of hydroxycholesterols (oxysterols), particularly A-ring hydroxylated cholesterol at the C-4beta position, and side chain hydroxylated cholesterol at the C-25 position, likely contributing to cholesterol degradation and bile acid biosynthesis. Catalyzes bisallylic hydroxylation of polyunsaturated fatty acids (PUFA). Catalyzes the epoxidation of double bonds of PUFA with a preference for the last double bond. Metabolizes endocannabinoid arachidonoylethanolamide (anandamide) to 8,9-, 11,12-, and 14,15-epoxyeicosatrienoic acid ethanolamides (EpETrE-EAs), potentially modulating endocannabinoid system signaling. Plays a role in the metabolism of retinoids. Displays high catalytic activity for oxidation of all-trans-retinol to all-trans-retinal, a rate-limiting step for the biosynthesis of all-trans-retinoic acid (atRA). Further metabolizes atRA toward 4-hydroxyretinoate and may play a role in hepatic atRA clearance. Responsible for oxidative metabolism of xenobiotics. Acts as a 2-exo-monooxygenase for plant lipid 1,8-cineole (eucalyptol). Metabolizes the majority of the administered drugs. Catalyzes sulfoxidation of the anthelmintics albendazole and fenbendazole. Hydroxylates antimalarial drug quinine. Acts as a 1,4-cineole 2-exo-monooxygenase. Also involved in vitamin D catabolism and calcium homeostasis. Catalyzes the inactivation of the active hormone calcitriol (1-alpha,25-dihydroxyvitamin D(3)).
Click to Show/Hide
|
||||
| Uniprot ID | |||||
| Ensembl ID | |||||
| HGNC ID | |||||
| Click to Show/Hide the Complete Species Lineage | |||||
Type(s) of Resistant Mechanism of This Molecule
Drug Resistance Data Categorized by Drug
Approved Drug(s)
5 drug(s) in total
| Drug Sensitivity Data Categorized by Their Corresponding Mechanisms | ||||
|
|
||||
| Disease Class: Liver cancer [ICD-11: 2C12.6] | [1] | |||
| Sensitive Disease | Liver cancer [ICD-11: 2C12.6] | |||
| Sensitive Drug | Doxorubicin | |||
| Molecule Alteration | Expression | Down-regulation |
||
| Differential expression of the molecule in resistant disease | ||||
| Classification of Disease | Liver cancer [ICD-11: 2C12] | |||
| The Specified Disease | Liver cancer | |||
| The Studied Tissue | Liver tissue | |||
| The Expression Level of Disease Section Compare with the Healthy Individual Tissue | p-value: 5.13E-47 Fold-change: -1.49E+00 Z-score: -1.82E+01 |
|||
| Experimental Note | Revealed Based on the Cell Line Data | |||
| In Vitro Model | HepG2 cells | Liver | Homo sapiens (Human) | CVCL_0027 |
| Experiment for Molecule Alteration |
CYP450-Glo TM CYP 3A4 assay, RT-PCR | |||
| Experiment for Drug Resistance |
MTT assay | |||
| Mechanism Description | Synergistic interaction between the MDR mechanisms include ABCT proteins (P-gp, BCRP, and MDR1) and metabolic enzymes of phase I of metabolism mainly CYP3A4, phase II of metabolism mainly GST was observed. In this study, FUC alone and in combination with DOX inhibited the enzyme activities of CYP3A4 and GST and down regulated their genes. We interpret this effect as a consequence of a down-regulation of pregnane X receptor (PXR) gene. FUC overcame MDR by significantly suppressing PXR mediated pathways that regulated the expression of CYP3A and ABCB1 genes in HepG-2 cells. | |||
| Disease Class: Breast cancer [ICD-11: 2C60.3] | [1] | |||
| Sensitive Disease | Breast cancer [ICD-11: 2C60.3] | |||
| Sensitive Drug | Doxorubicin | |||
| Molecule Alteration | Expression | Down-regulation |
||
| Differential expression of the molecule in resistant disease | ||||
| Classification of Disease | Breast cancer [ICD-11: 2C60] | |||
| The Specified Disease | Breast cancer | |||
| The Studied Tissue | Breast tissue | |||
| The Expression Level of Disease Section Compare with the Healthy Individual Tissue | p-value: 1.87E-03 Fold-change: -1.87E-02 Z-score: -3.13E+00 |
|||
| Experimental Note | Revealed Based on the Cell Line Data | |||
| In Vitro Model | MCF-7 cells | Breast | Homo sapiens (Human) | CVCL_0031 |
| Experiment for Molecule Alteration |
CYP450-Glo TM CYP 3A4 assay, RT-PCR | |||
| Experiment for Drug Resistance |
MTT assay | |||
| Mechanism Description | Synergistic interaction between the MDR mechanisms include ABCT proteins (P-gp, BCRP, and MDR1) and metabolic enzymes of phase I of metabolism mainly CYP3A4, phase II of metabolism mainly GST was observed. In this study, FUC alone and in combination with DOX inhibited the enzyme activities of CYP3A4 and GST and down regulated their genes. We interpret this effect as a consequence of a down-regulation of pregnane X receptor (PXR) gene. FUC overcame MDR by significantly suppressing PXR mediated pathways that regulated the expression of CYP3A and ABCB1 genes in HepG-2 cells. | |||
| Disease Class: Ovarian cancer [ICD-11: 2C73.0] | [1] | |||
| Sensitive Disease | Ovarian cancer [ICD-11: 2C73.0] | |||
| Sensitive Drug | Doxorubicin | |||
| Molecule Alteration | Expression | Down-regulation |
||
| Differential expression of the molecule in resistant disease | ||||
| Classification of Disease | Ovarian cancer [ICD-11: 2C73] | |||
| The Specified Disease | Ovarian cancer | |||
| The Studied Tissue | Ovarian tissue | |||
| The Expression Level of Disease Section Compare with the Healthy Individual Tissue | p-value: 2.96E-01 Fold-change: -3.18E-02 Z-score: -1.12E+00 |
|||
| Experimental Note | Revealed Based on the Cell Line Data | |||
| In Vitro Model | SkOV3 cells | Ovary | Homo sapiens (Human) | CVCL_0532 |
| Experiment for Molecule Alteration |
CYP450-Glo TM CYP 3A4 assay, RT-PCR | |||
| Experiment for Drug Resistance |
MTT assay | |||
| Mechanism Description | Synergistic interaction between the MDR mechanisms include ABCT proteins (P-gp, BCRP, and MDR1) and metabolic enzymes of phase I of metabolism mainly CYP3A4, phase II of metabolism mainly GST was observed. In this study, FUC alone and in combination with DOX inhibited the enzyme activities of CYP3A4 and GST and down regulated their genes. We interpret this effect as a consequence of a down-regulation of pregnane X receptor (PXR) gene. FUC overcame MDR by significantly suppressing PXR mediated pathways that regulated the expression of CYP3A and ABCB1 genes in HepG-2 cells. | |||
| Disease Class: Liver cancer [ICD-11: 2C12.6] | [3] | |||
| Sensitive Disease | Liver cancer [ICD-11: 2C12.6] | |||
| Sensitive Drug | Doxorubicin | |||
| Molecule Alteration | Expression | Down-regulation |
||
| Differential expression of the molecule in resistant disease | ||||
| Classification of Disease | Liver cancer [ICD-11: 2C12] | |||
| The Specified Disease | Liver cancer | |||
| The Studied Tissue | Liver tissue | |||
| The Expression Level of Disease Section Compare with the Healthy Individual Tissue | p-value: 1.02E-14 Fold-change: -3.23E-01 Z-score: -1.01E+01 |
|||
| Experimental Note | Revealed Based on the Cell Line Data | |||
| In Vitro Model | HepG2 cells | Liver | Homo sapiens (Human) | CVCL_0027 |
| Experiment for Molecule Alteration |
CYP450-Glo CYP 3A4 assay | |||
| Experiment for Drug Resistance |
MTT assay | |||
| Mechanism Description | In this study, resveratrol was a significant inhibitor of CYP3A4 enzyme activity with IC50 value 9.32 ( M). Moreover, the CYP3A4 mRNA levels were reduced after treatment with resveratrol 0.03-fold of the control levels with high significance (p < 0.001). | |||
| Disease Class: Acute lymphocytic leukemia [ICD-11: 2B33.0] | [3] | |||
| Sensitive Disease | Acute lymphocytic leukemia [ICD-11: 2B33.0] | |||
| Sensitive Drug | Doxorubicin | |||
| Molecule Alteration | Expression | Down-regulation |
||
| Experimental Note | Revealed Based on the Cell Line Data | |||
| In Vitro Model | CCRF-CEM cells | Pleural effusion | Homo sapiens (Human) | CVCL_0207 |
| CEM/ADR5000 cells | Bone marrow | Homo sapiens (Human) | CVCL_D544 | |
| Experiment for Molecule Alteration |
CYP450-Glo CYP 3A4 assay | |||
| Experiment for Drug Resistance |
MTT assay | |||
| Mechanism Description | In this study, resveratrol was a significant inhibitor of CYP3A4 enzyme activity with IC50 value 9.32 ( M). Moreover, the CYP3A4 mRNA levels were reduced after treatment with resveratrol 0.03-fold of the control levels with high significance (p < 0.001). | |||
| Disease Class: Colorectal cancer [ICD-11: 2B91.1] | [3] | |||
| Sensitive Disease | Colorectal cancer [ICD-11: 2B91.1] | |||
| Sensitive Drug | Doxorubicin | |||
| Molecule Alteration | Expression | Down-regulation |
||
| Experimental Note | Revealed Based on the Cell Line Data | |||
| In Vitro Model | CaCo2 cells | Colon | Homo sapiens (Human) | CVCL_0025 |
| Experiment for Molecule Alteration |
CYP450-Glo CYP 3A4 assay | |||
| Experiment for Drug Resistance |
MTT assay | |||
| Mechanism Description | In this study, resveratrol was a significant inhibitor of CYP3A4 enzyme activity with IC50 value 9.32 ( M). Moreover, the CYP3A4 mRNA levels were reduced after treatment with resveratrol 0.03-fold of the control levels with high significance (p < 0.001). | |||
| Disease Class: Cervical carcinoma [ICD-11: 2C77.1] | [3] | |||
| Sensitive Disease | Cervical carcinoma [ICD-11: 2C77.1] | |||
| Sensitive Drug | Doxorubicin | |||
| Molecule Alteration | Expression | Down-regulation |
||
| Experimental Note | Revealed Based on the Cell Line Data | |||
| In Vitro Model | Hela cells | Cervix uteri | Homo sapiens (Human) | CVCL_0030 |
| Experiment for Molecule Alteration |
CYP450-Glo CYP 3A4 assay | |||
| Experiment for Drug Resistance |
MTT assay | |||
| Mechanism Description | In this study, resveratrol was a significant inhibitor of CYP3A4 enzyme activity with IC50 value 9.32 ( M). Moreover, the CYP3A4 mRNA levels were reduced after treatment with resveratrol 0.03-fold of the control levels with high significance (p < 0.001). | |||
| Drug Resistance Data Categorized by Their Corresponding Mechanisms | ||||
|
|
||||
| Disease Class: Colon carcinoma [ICD-11: 2B90.2] | [2] | |||
| Resistant Disease | Colon carcinoma [ICD-11: 2B90.2] | |||
| Resistant Drug | Cyclophosphamide | |||
| Molecule Alteration | Expression | Down-regulation |
||
| Differential expression of the molecule in resistant disease | ||||
| Classification of Disease | Colon cancer [ICD-11: 2B90] | |||
| The Specified Disease | Colon cancer | |||
| The Studied Tissue | Colon tissue | |||
| The Expression Level of Disease Section Compare with the Healthy Individual Tissue | p-value: 1.19E-03 Fold-change: -3.51E-02 Z-score: -3.30E+00 |
|||
| Experimental Note | Revealed Based on the Cell Line Data | |||
| In Vitro Model | LS-180 cells | Colon | Homo sapiens (Human) | CVCL_0397 |
| Experiment for Molecule Alteration |
Immunoblotting analysis | |||
| Experiment for Drug Resistance |
Sulforhodamine B assay | |||
| Mechanism Description | CYP3A4 is the most abundant hepatic and intestinal cytochrome P450 enzyme in humans, contributing to the metabolism of various drugs such as benzodiazepines, HIV antivirals, macrolide antibiotics, and statins. CYP3A4 3'UTR-luciferase activity was significantly decreased in human embryonic kidney 293 cells transfected with plasmid that expressed microRNA-27b (miR-27b) or mouse microRNA-298 (mmu-miR-298), overexpression of miR-27b or mmu-miR-298 in PANC1 cells led to a lower sensitivity to cyclophosphamide. | |||
| Disease Class: Pancreatic cancer [ICD-11: 2C10.3] | [2] | |||
| Resistant Disease | Pancreatic cancer [ICD-11: 2C10.3] | |||
| Resistant Drug | Cyclophosphamide | |||
| Molecule Alteration | Expression | Down-regulation |
||
| Experimental Note | Revealed Based on the Cell Line Data | |||
| In Vitro Model | Panc1 cells | Pancreas | Homo sapiens (Human) | CVCL_0480 |
| Experiment for Molecule Alteration |
Immunoblotting analysis | |||
| Experiment for Drug Resistance |
Sulforhodamine B assay | |||
| Mechanism Description | CYP3A4 is the most abundant hepatic and intestinal cytochrome P450 enzyme in humans, contributing to the metabolism of various drugs such as benzodiazepines, HIV antivirals, macrolide antibiotics, and statins. CYP3A4 3'UTR-luciferase activity was significantly decreased in human embryonic kidney 293 cells transfected with plasmid that expressed microRNA-27b (miR-27b) or mouse microRNA-298 (mmu-miR-298), overexpression of miR-27b or mmu-miR-298 in PANC1 cells led to a lower sensitivity to cyclophosphamide. | |||
| Drug Resistance Data Categorized by Their Corresponding Mechanisms | ||||
|
|
||||
| Disease Class: Hypo-attenuated leaflet thickening [ICD-11: BD10.2] | [4] | |||
| Resistant Disease | Hypo-attenuated leaflet thickening [ICD-11: BD10.2] | |||
| Resistant Drug | Clopidogrel | |||
| Molecule Alteration | SNP | rs2740574+rs55785340+rs4986910 |
||
| Experimental Note | Identified from the Human Clinical Data | |||
| Mechanism Description | We thoroughly genotyped 34 SNPs and 8 SNPs that have been reported for clopidogrel and aspirin resistance. A total of 148 patients were enrolled. There were 15 patients demonstrating signs of HALT. Patients with HALT had a higher rate of atrial fibrillation (AF) pre-TAVR (33.3 vs. 7.5%, P = 0.01). | |||
| Drug Sensitivity Data Categorized by Their Corresponding Mechanisms | ||||
|
|
||||
| Disease Class: Insomnia [ICD-11: 7A00.0] | [5] | |||
| Sensitive Disease | Insomnia [ICD-11: 7A00.0] | |||
| Sensitive Drug | Midazolam | |||
| Molecule Alteration | Expression | Down-regulation |
||
| Experimental Note | Identified from the Human Clinical Data | |||
| In Vitro Model | CaCo2 cells | Colon | Homo sapiens (Human) | CVCL_0025 |
| IPS cells | Colon | Homo sapiens (Human) | N.A. | |
| Experiment for Molecule Alteration |
qPCR | |||
| Experiment for Drug Resistance |
Transcellular transport study assay | |||
| Mechanism Description | The extraction ratio of metabolism of midazolam (a substrate of CYP3A4) to 1-OH midazolam in hiPSC-IECs was 0.534 +/- 0.009 (%), and decreased to 0.322 +/- 0.009 (%) and 0.0821 +/- 0.0064 (%) in the presence of 0.5 and 10 uM ketoconazole (an inhibitor of CYP3A4), respectively. The extraction ratio in Caco-2 cells was 0.0623 +/- 0.0038 (%) and also decreased to 0.0404 +/- 0.0023 (%) and 0.0414 +/- 0.0032 (%) in the presence of 0.5 and 10 uM ketoconazole, respectively. | |||
| Drug Resistance Data Categorized by Their Corresponding Mechanisms | ||||
|
|
||||
| Disease Class: Spastic cerebral palsy [ICD-11: 8D20.1] | [6] | |||
| Resistant Disease | Spastic cerebral palsy [ICD-11: 8D20.1] | |||
| Resistant Drug | Rocuronium | |||
| Molecule Alteration | Expression | Up-regulation |
||
| Experimental Note | Identified from the Human Clinical Data | |||
| Experiment for Molecule Alteration |
Staining and imaging assay | |||
| Mechanism Description | Resistance to neuromuscular blocking agents has been linked to the hepatoxicity of anticonvulsants and the upregulation of drug-metabolizing liver enzymes, especially CYP3A4, which is known to metabolize ROC, Although it was not possible to biopsy liver samples for the present study, elevated CYP3A4 generally correlates with increased circulating alanine transaminase (ALT) and total bilirubin. | |||
Disease- and Tissue-specific Abundances of This Molecule
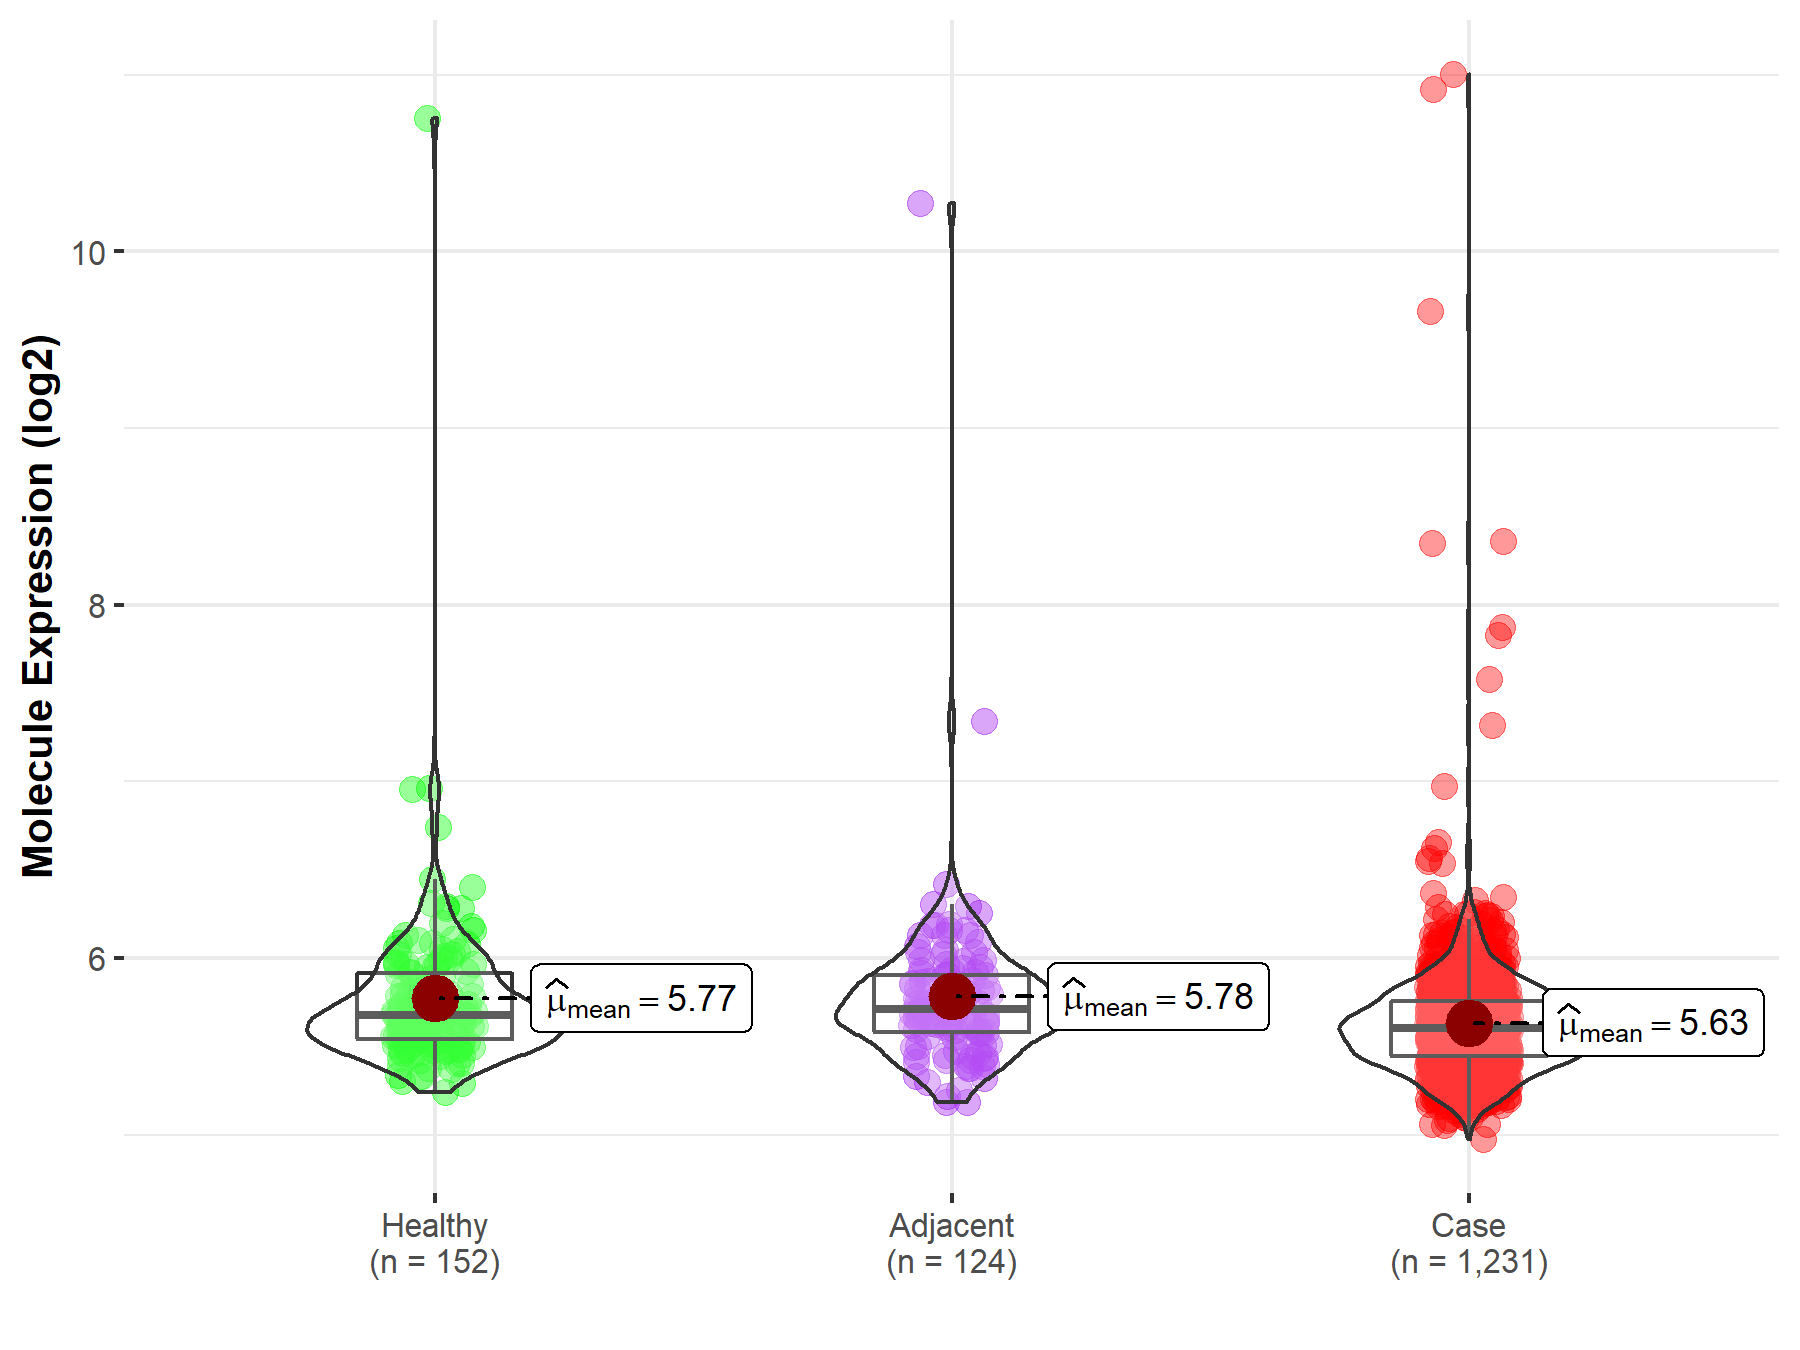
ICD Disease Classification 02

| Differential expression of molecule in resistant diseases | ||
| The Studied Tissue | Colon | |
| The Specified Disease | Colon cancer | |
| The Expression Level of Disease Section Compare with the Healthy Individual Tissue | p-value: 1.19E-03; Fold-change: -7.56E-02; Z-score: -1.51E-01 | |
| The Expression Level of Disease Section Compare with the Adjacent Tissue | p-value: 1.70E-03; Fold-change: -1.08E-01; Z-score: -2.16E-01 | |
|
Molecule expression in the normal tissue adjacent to the diseased tissue of patients
Molecule expression in the diseased tissue of patients
Molecule expression in the normal tissue of healthy individuals
|
||
| Disease-specific Molecule Abundances |

|
Click to View the Clearer Original Diagram |
| Differential expression of molecule in resistant diseases | ||
| The Studied Tissue | Pancreas | |
| The Specified Disease | Pancreatic cancer | |
| The Expression Level of Disease Section Compare with the Healthy Individual Tissue | p-value: 8.64E-01; Fold-change: -2.20E-01; Z-score: -5.34E-01 | |
| The Expression Level of Disease Section Compare with the Adjacent Tissue | p-value: 3.14E-01; Fold-change: -1.16E-02; Z-score: -8.86E-03 | |
|
Molecule expression in the normal tissue adjacent to the diseased tissue of patients
Molecule expression in the diseased tissue of patients
Molecule expression in the normal tissue of healthy individuals
|
||
| Disease-specific Molecule Abundances |

|
Click to View the Clearer Original Diagram |
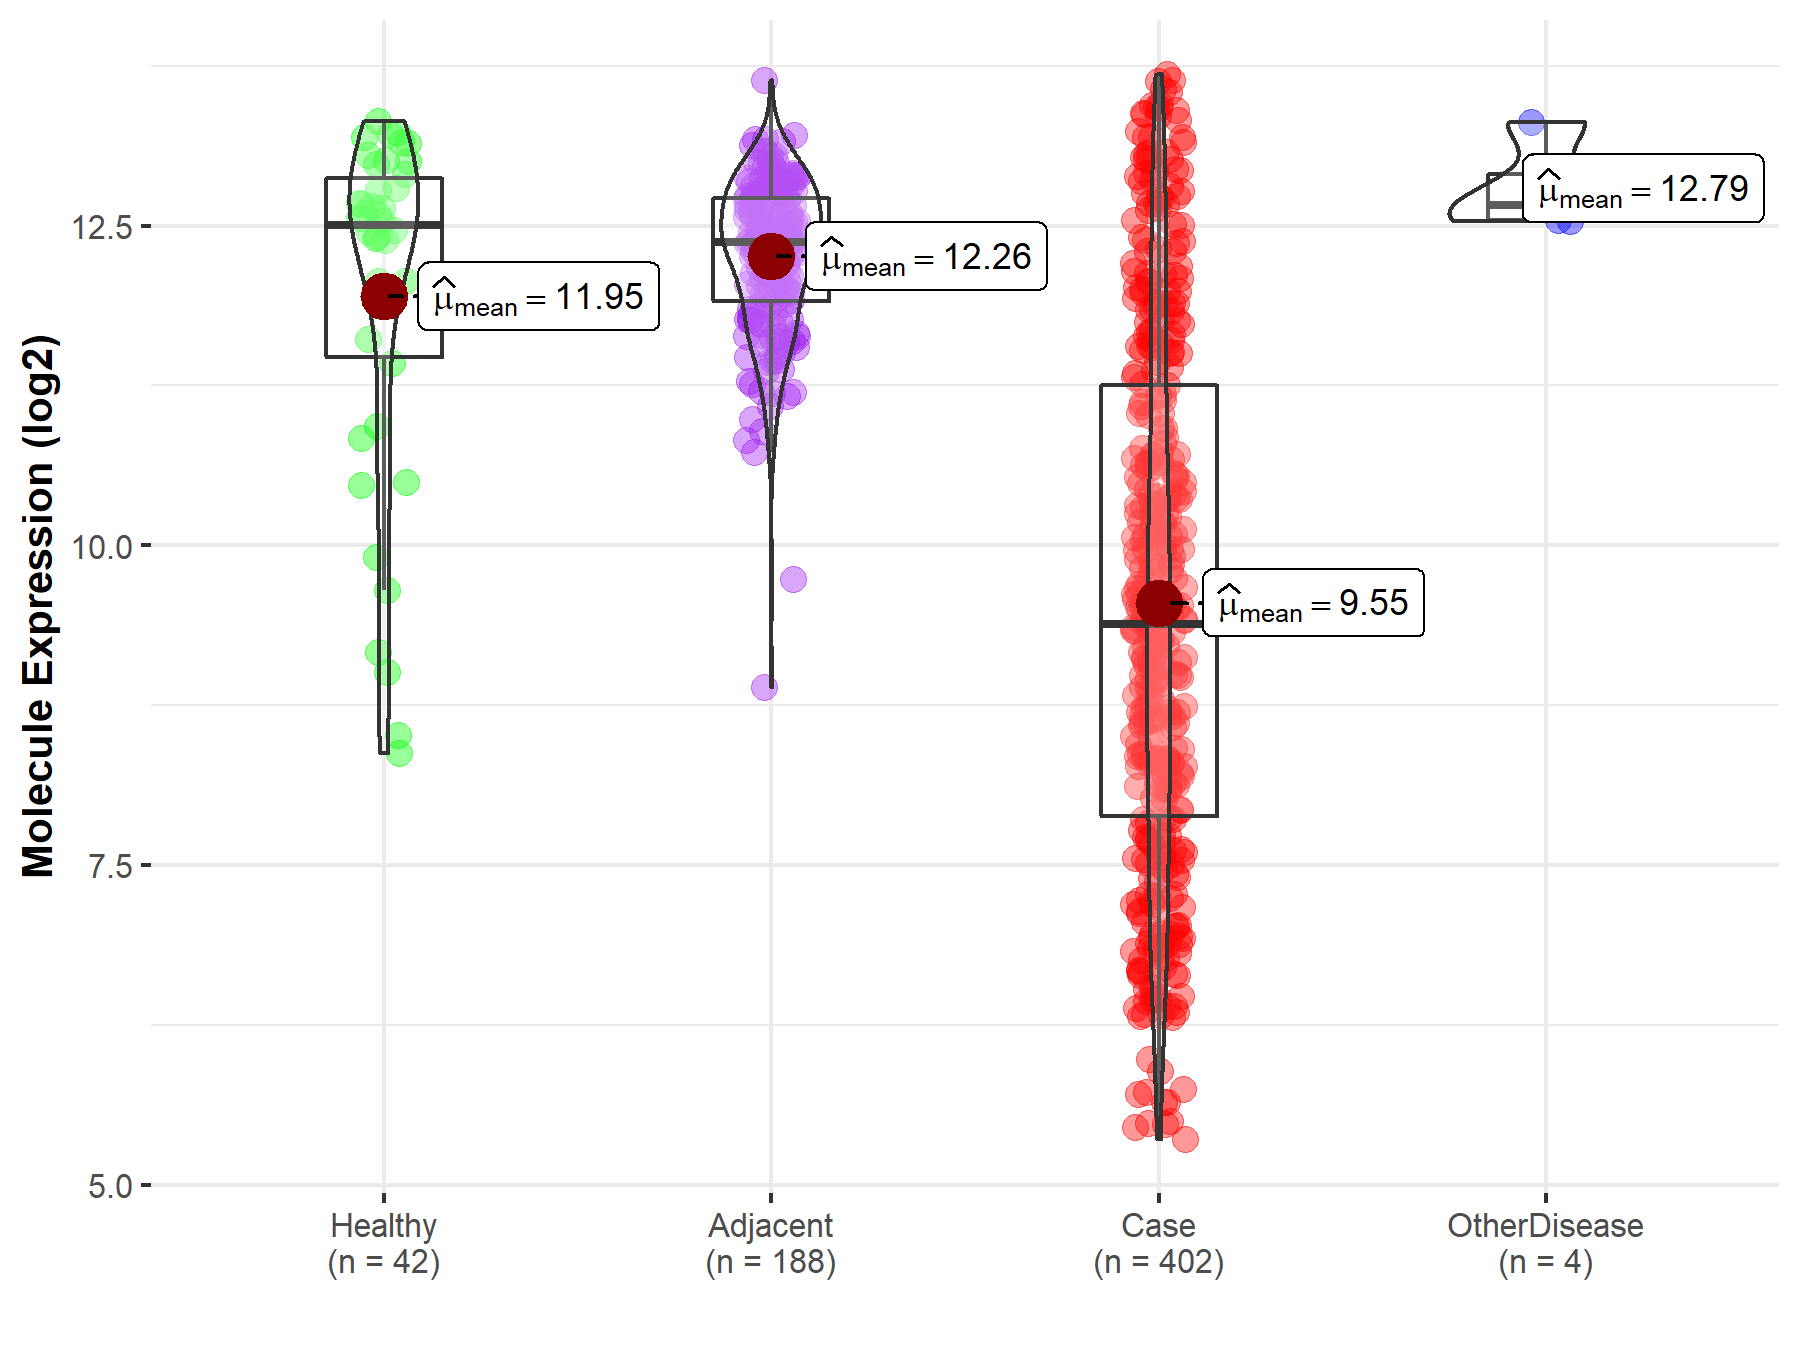
| Differential expression of molecule in resistant diseases | ||
| The Studied Tissue | Liver | |
| The Specified Disease | Liver cancer | |
| The Expression Level of Disease Section Compare with the Healthy Individual Tissue | p-value: 1.02E-14; Fold-change: -3.12E+00; Z-score: -2.25E+00 | |
| The Expression Level of Disease Section Compare with the Adjacent Tissue | p-value: 1.09E-84; Fold-change: -2.99E+00; Z-score: -4.75E+00 | |
| The Expression Level of Disease Section Compare with the Other Disease Section | p-value: 1.26E-05; Fold-change: -3.27E+00; Z-score: -8.99E+00 | |
|
Molecule expression in the normal tissue adjacent to the diseased tissue of patients
Molecule expression in the diseased tissue of patients
Molecule expression in the normal tissue of healthy individuals
Molecule expression in tissue other than the diseased tissue of patients
|
||
| Disease-specific Molecule Abundances |

|
Click to View the Clearer Original Diagram |
| Differential expression of molecule in resistant diseases | ||
| The Studied Tissue | Breast tissue | |
| The Specified Disease | Breast cancer | |
| The Expression Level of Disease Section Compare with the Healthy Individual Tissue | p-value: 1.87E-03; Fold-change: -6.67E-02; Z-score: -2.12E-01 | |
| The Expression Level of Disease Section Compare with the Adjacent Tissue | p-value: 5.49E-04; Fold-change: -1.25E-01; Z-score: -5.25E-01 | |
|
Molecule expression in the normal tissue adjacent to the diseased tissue of patients
Molecule expression in the diseased tissue of patients
Molecule expression in the normal tissue of healthy individuals
|
||
| Disease-specific Molecule Abundances |

|
Click to View the Clearer Original Diagram |
| Differential expression of molecule in resistant diseases | ||
| The Studied Tissue | Ovary | |
| The Specified Disease | Ovarian cancer | |
| The Expression Level of Disease Section Compare with the Healthy Individual Tissue | p-value: 2.96E-01; Fold-change: -3.35E-01; Z-score: -1.10E+00 | |
| The Expression Level of Disease Section Compare with the Adjacent Tissue | p-value: 7.51E-01; Fold-change: -7.20E-02; Z-score: -3.51E-01 | |
|
Molecule expression in the normal tissue adjacent to the diseased tissue of patients
Molecule expression in the diseased tissue of patients
Molecule expression in the normal tissue of healthy individuals
|
||
| Disease-specific Molecule Abundances |

|
Click to View the Clearer Original Diagram |
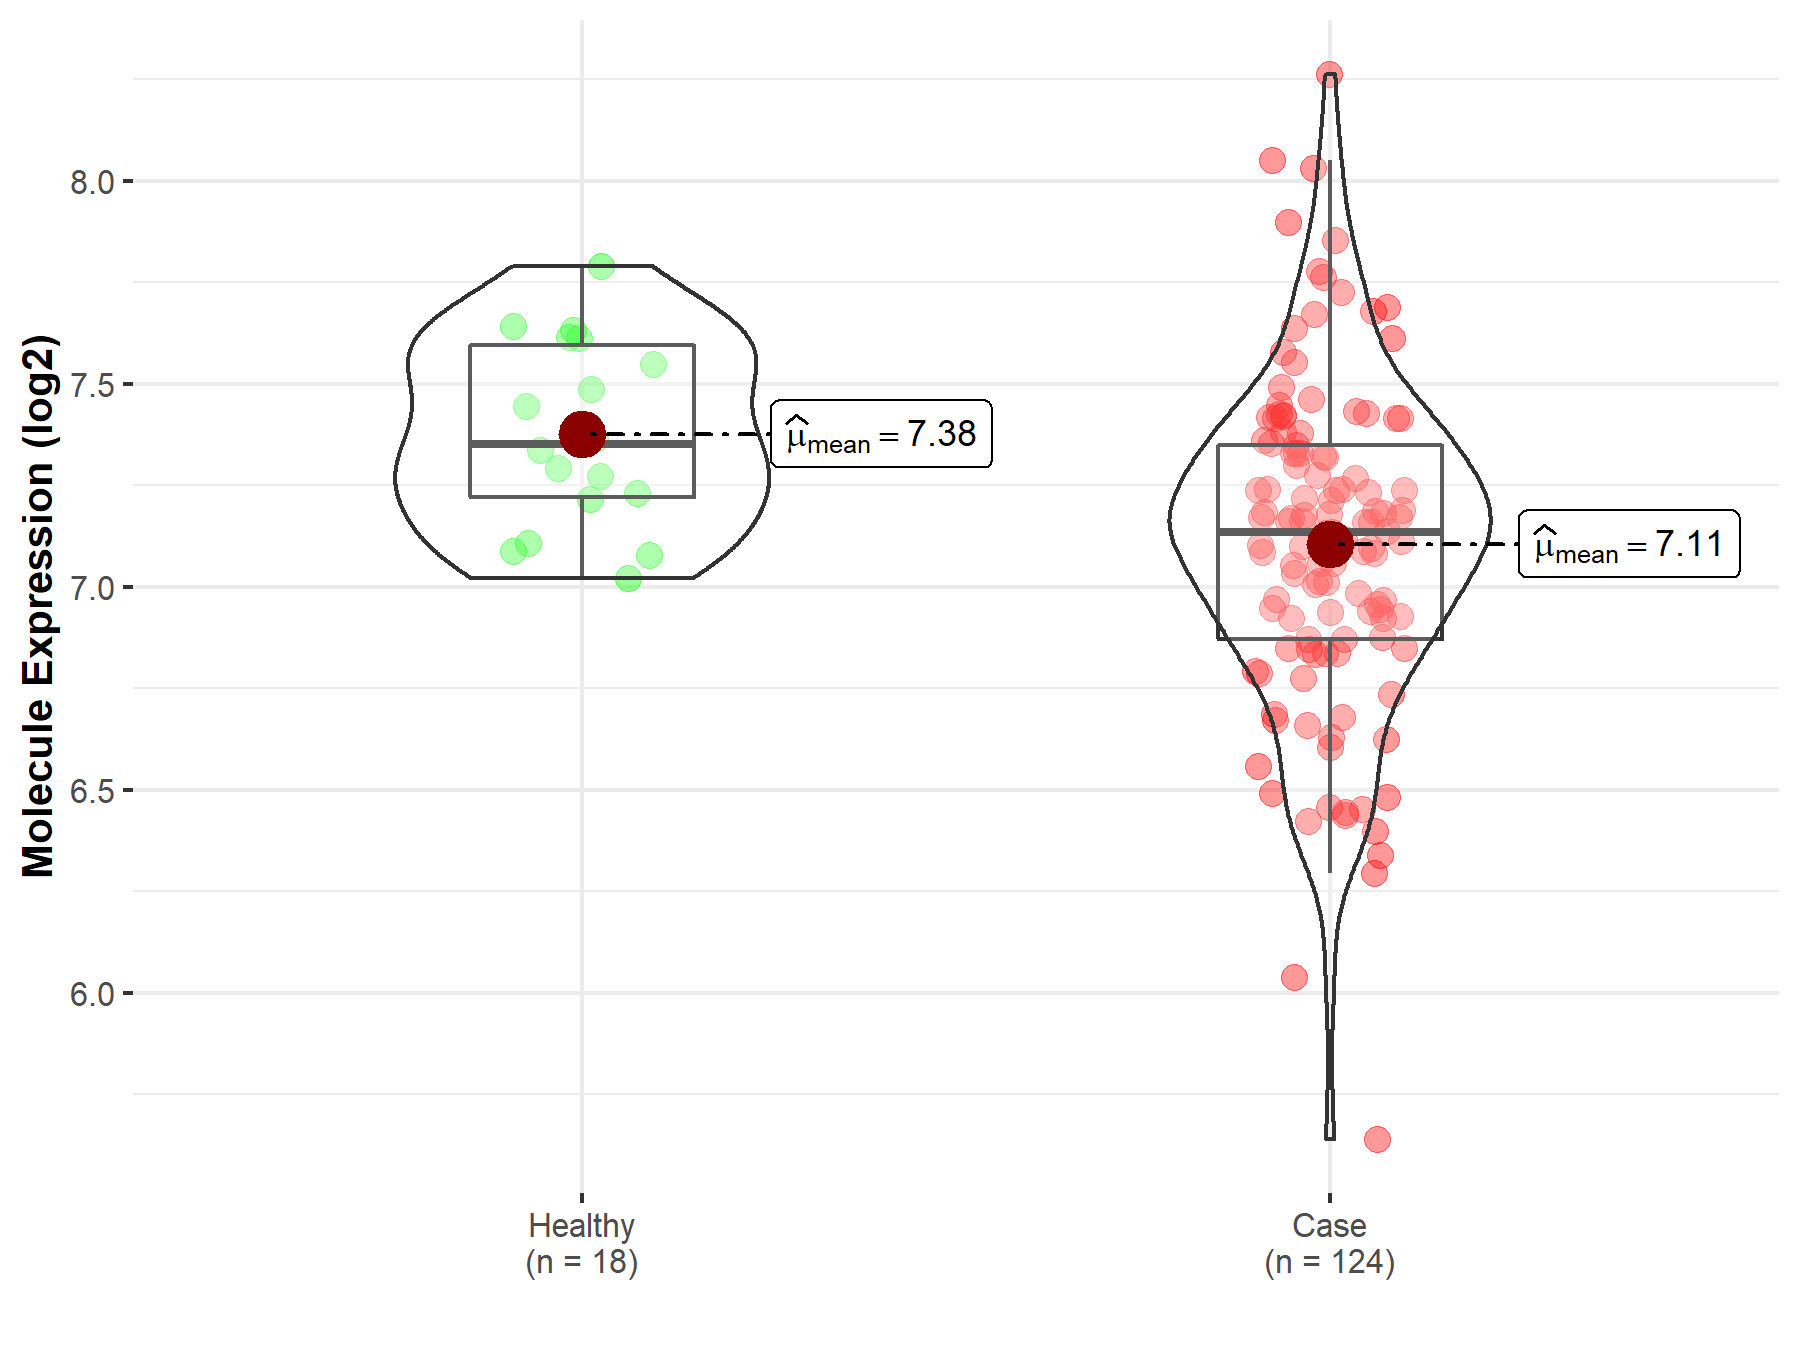
| Differential expression of molecule in resistant diseases | ||
| The Studied Tissue | Cervix uteri | |
| The Specified Disease | Cervical cancer | |
| The Expression Level of Disease Section Compare with the Healthy Individual Tissue | p-value: 2.13E-04; Fold-change: -2.15E-01; Z-score: -9.34E-01 | |
|
Molecule expression in the diseased tissue of patients
Molecule expression in the normal tissue of healthy individuals
|
||
| Disease-specific Molecule Abundances |

|
Click to View the Clearer Original Diagram |
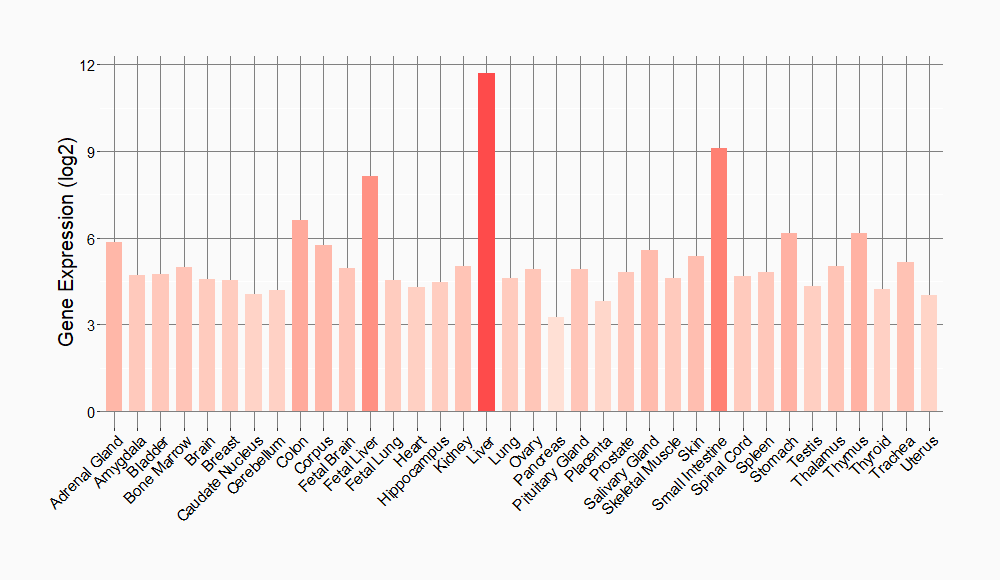
Tissue-specific Molecule Abundances in Healthy Individuals


|
||
References
If you find any error in data or bug in web service, please kindly report it to Dr. Sun and Dr. Yu.
