Molecule Information
General Information of the Molecule (ID: Mol00245)
| Name |
Bcl-2-associated agonist of cell death (BAD)
,Homo sapiens
|
||||
|---|---|---|---|---|---|
| Synonyms |
BAD; Bcl-2-binding component 6; Bcl-2-like protein 8; Bcl2-L-8; Bcl-xL/Bcl-2-associated death promoter; Bcl2 antagonist of cell death; BBC6; BCL2L8
Click to Show/Hide
|
||||
| Molecule Type |
Protein
|
||||
| Gene Name |
BAD
|
||||
| Gene ID | |||||
| Location |
chr11:64269830-64284704[-]
|
||||
| Sequence |
MFQIPEFEPSEQEDSSSAERGLGPSPAGDGPSGSGKHHRQAPGLLWDASHQQEQPTSSSH
HGGAGAVEIRSRHSSYPAGTEDDEGMGEEPSPFRGRSRSAPPNLWAAQRYGRELRRMSDE FVDSFKKGLPRPKSAGTATQMRQSSSWTRVFQSWWDRNLGRGSSAPSQ Click to Show/Hide
|
||||
| 3D-structure |
|
||||
| Function |
Promotes cell death. Successfully competes for the binding to Bcl-X(L), Bcl-2 and Bcl-W, thereby affecting the level of heterodimerization of these proteins with BAX. Can reverse the death repressor activity of Bcl-X(L), but not that of Bcl-2 (By similarity). Appears to act as a link between growth factor receptor signaling and the apoptotic pathways.
Click to Show/Hide
|
||||
| Uniprot ID | |||||
| Ensembl ID | |||||
| HGNC ID | |||||
| Click to Show/Hide the Complete Species Lineage | |||||
Type(s) of Resistant Mechanism of This Molecule
Drug Resistance Data Categorized by Drug
Approved Drug(s)
5 drug(s) in total
| Drug Sensitivity Data Categorized by Their Corresponding Mechanisms | ||||
|
|
||||
| Disease Class: Lung adenocarcinoma [ICD-11: 2C25.0] | [1] | |||
| Sensitive Disease | Lung adenocarcinoma [ICD-11: 2C25.0] | |||
| Sensitive Drug | Docetaxel | |||
| Molecule Alteration | Expression | Down-regulation |
||
| Differential expression of the molecule in resistant disease | ||||
| Classification of Disease | Lung cancer [ICD-11: 2C25] | |||
| The Specified Disease | Lung adenocarcinoma | |||
| The Studied Tissue | Lung tissue | |||
| The Expression Level of Disease Section Compare with the Healthy Individual Tissue | p-value: 3.32E-11 Fold-change: -3.62E-01 Z-score: -7.02E+00 |
|||
| Experimental Note | Identified from the Human Clinical Data | |||
| Cell Pathway Regulation | Caspase-3 signaling pathway | Activation | hsa04210 | |
| Sorafenib tolerance | Activation | hsa00983 | ||
| In Vitro Model | SPC-A1 cells | Lung | Homo sapiens (Human) | CVCL_6955 |
| H1299 cells | Lung | Homo sapiens (Human) | CVCL_0060 | |
| In Vivo Model | BALB/c nude mouse xenograft model | Mus musculus | ||
| Experiment for Molecule Alteration |
Western blot analysis | |||
| Experiment for Drug Resistance |
MTT assay | |||
| Mechanism Description | Ectopic Let-7c expression could increase the sensitivity of docetaxel-resistant LAD cells to chemotherapeutic agents or irradiation and reverse their EMT phenotype by targeting Bcl-xL. | |||
|
|
||||
| Disease Class: Lung adenocarcinoma [ICD-11: 2C25.0] | [4] | |||
| Sensitive Disease | Lung adenocarcinoma [ICD-11: 2C25.0] | |||
| Sensitive Drug | Docetaxel | |||
| Molecule Alteration | Expression | Up-regulation |
||
| Differential expression of the molecule in resistant disease | ||||
| Classification of Disease | Lung cancer [ICD-11: 2C25] | |||
| The Specified Disease | Lung cancer | |||
| The Studied Tissue | Lung tissue | |||
| The Expression Level of Disease Section Compare with the Healthy Individual Tissue | p-value: 8.54E-01 Fold-change: 1.74E-03 Z-score: 1.85E-01 |
|||
| Experimental Note | Identified from the Human Clinical Data | |||
| Cell Pathway Regulation | Cell apoptosis | Activation | hsa04210 | |
| Cell invasion | Inhibition | hsa05200 | ||
| Cell migration | Inhibition | hsa04670 | ||
| Cell proliferation | Inhibition | hsa05200 | ||
| In Vitro Model | SPC-A1 cells | Lung | Homo sapiens (Human) | CVCL_6955 |
| H1299 cells | Lung | Homo sapiens (Human) | CVCL_0060 | |
| In Vivo Model | Nude mouse xenograft model | Mus musculus | ||
| Experiment for Molecule Alteration |
Western blot analysis | |||
| Experiment for Drug Resistance |
MTT assay; Colony formation assay; Tunel assay | |||
| Mechanism Description | Long noncoding RNA CCAT1 acts as an oncogene and promotes chemoresistance in docetaxel-resistant lung adenocarcinoma cells.the sponging of let-7c by CCAT1 released Bcl-xl (a let-7c target), thereby promoting the acquisition of chemoresistance and epithelial-to-mesenchymal transition phenotypes in docetaxel-resistant LAD cells. | |||
| Drug Resistance Data Categorized by Their Corresponding Mechanisms | ||||
|
|
||||
| Disease Class: Breast cancer bone metastasis [ICD-11: 2E03.1] | [8] | |||
| Resistant Disease | Breast cancer bone metastasis [ICD-11: 2E03.1] | |||
| Resistant Drug | Docetaxel | |||
| Molecule Alteration | Expression | Up-regulation |
||
| Experimental Note | Revealed Based on the Cell Line Data | |||
| In Vitro Model | MCF-7 cells | Breast | Homo sapiens (Human) | CVCL_0031 |
| MDA-MB-231 cells | Breast | Homo sapiens (Human) | CVCL_0062 | |
| Experiment for Molecule Alteration |
RT-PCR | |||
| Experiment for Drug Resistance |
Flow cytometric | |||
| Mechanism Description | Interleukin-6 (IL-6), a pro-inflammatory cytokine produced in the tumor microenvironment by stromal cells, fibroblasts, and cancer cells. Binding of IL-6 to its receptor IL-6R on the cell membrane activates Janus Kinase 2 (JAK2) kinases. Activated JAK2 mediates phosphorylation, dimerization, and nuclear translocation of Signal Transducer and Activator of Transcription 3 (STAT3). STAT3 signaling mediates the expression of various genes, including p53, Bcl-2, MRP1, and ABCG2. Bcl-2 and p53 are associated with regulation of apoptosis while overexpression of drug transporters MRP1, ABCG2 has been shown to mediate efflux of drugs from cancer cells, thus decreasing intracellular drug concentration leading to drug-resistance. | |||
| Drug Sensitivity Data Categorized by Their Corresponding Mechanisms | ||||
|
|
||||
| Disease Class: Hepatocellular carcinoma [ICD-11: 2C12.2] | [2], [3] | |||
| Sensitive Disease | Hepatocellular carcinoma [ICD-11: 2C12.2] | |||
| Sensitive Drug | Fluorouracil | |||
| Molecule Alteration | Expression | Down-regulation |
||
| Differential expression of the molecule in resistant disease | ||||
| Classification of Disease | Liver cancer [ICD-11: 2C12] | |||
| The Specified Disease | Hepatocellular carcinoma | |||
| The Studied Tissue | Liver tissue | |||
| The Expression Level of Disease Section Compare with the Healthy Individual Tissue | p-value: 3.19E-09 Fold-change: -2.62E-01 Z-score: -6.15E+00 |
|||
| Experimental Note | Revealed Based on the Cell Line Data | |||
| Cell Pathway Regulation | Cell apoptosis | Activation | hsa04210 | |
| Cell proliferation | Inhibition | hsa05200 | ||
| Mitochondrial signaling pathway | Activation | hsa04217 | ||
| In Vitro Model | BEL-7402 cells | Liver | Homo sapiens (Human) | CVCL_5492 |
| HepG2 cells | Liver | Homo sapiens (Human) | CVCL_0027 | |
| In Vivo Model | Nude mouse xenograft model | Mus musculus | ||
| Experiment for Molecule Alteration |
Western blot analysis | |||
| Experiment for Drug Resistance |
CCK8 assay; MTT assay | |||
| Mechanism Description | Let-7b increased 5 FU sensitivity by repressing Bcl xl expression in HCC cells. And miR-133a and miR-326 share a common target gene, Bcl-xl. Expression levels of miR-133a and miR-326 are significantly upregulated subsequent to transfection. miR-133a and miR-326 downregulate the mRNA expression of Bcl-xl. miR-133a and miR-326 sensitize HepG2 cells to 5-FU and DDP. | |||
| Drug Sensitivity Data Categorized by Their Corresponding Mechanisms | ||||
|
|
||||
| Disease Class: Hepatocellular carcinoma [ICD-11: 2C12.2] | [3] | |||
| Sensitive Disease | Hepatocellular carcinoma [ICD-11: 2C12.2] | |||
| Sensitive Drug | Cisplatin | |||
| Molecule Alteration | Expression | Down-regulation |
||
| Differential expression of the molecule in resistant disease | ||||
| Classification of Disease | Liver cancer [ICD-11: 2C12] | |||
| The Specified Disease | Liver cancer | |||
| The Studied Tissue | Liver tissue | |||
| The Expression Level of Disease Section Compare with the Healthy Individual Tissue | p-value: 4.27E-01 Fold-change: -1.47E-02 Z-score: -8.01E-01 |
|||
| Experimental Note | Revealed Based on the Cell Line Data | |||
| Cell Pathway Regulation | Cell apoptosis | Activation | hsa04210 | |
| Cell proliferation | Inhibition | hsa05200 | ||
| Mitochondrial signaling pathway | Activation | hsa04217 | ||
| In Vitro Model | HepG2 cells | Liver | Homo sapiens (Human) | CVCL_0027 |
| In Vivo Model | Nude mouse xenograft model | Mus musculus | ||
| Experiment for Molecule Alteration |
Western blot analysis | |||
| Experiment for Drug Resistance |
MTT assay | |||
| Mechanism Description | miR-133a and miR-326 share a common target gene, Bcl-xl. Expression levels of miR-133a and miR-326 are significantly upregulated subsequent to transfection. miR-133a and miR-326 downregulate the mRNA expression of Bcl-xl. miR-133a and miR-326 sensitize HepG2 cells to 5-FU and DDP. | |||
| Drug Resistance Data Categorized by Their Corresponding Mechanisms | ||||
|
|
||||
| Disease Class: Prostate cancer [ICD-11: 2C82.0] | [5] | |||
| Resistant Disease | Prostate cancer [ICD-11: 2C82.0] | |||
| Resistant Drug | Cisplatin | |||
| Molecule Alteration | Expression | Down-regulation |
||
| Differential expression of the molecule in resistant disease | ||||
| Classification of Disease | Prostate cancer [ICD-11: 2C82] | |||
| The Specified Disease | Prostate cancer | |||
| The Studied Tissue | Prostate | |||
| The Expression Level of Disease Section Compare with the Healthy Individual Tissue | p-value: 3.50E-03 Fold-change: -9.12E-02 Z-score: -3.18E+00 |
|||
| Experimental Note | Revealed Based on the Cell Line Data | |||
| Cell Pathway Regulation | AKT/ERK signaling pathway | Activation | hsa04010 | |
| Cell apoptosis | Inhibition | hsa04210 | ||
| Cell invasion | Activation | hsa05200 | ||
| Cell migration | Activation | hsa04670 | ||
| Cell proliferation | Activation | hsa05200 | ||
| In Vitro Model | DU-145 cells | Prostate | Homo sapiens (Human) | CVCL_0105 |
| In Vivo Model | Nude mouse xenograft model | Mus musculus | ||
| Experiment for Molecule Alteration |
Western blot analysis | |||
| Experiment for Drug Resistance |
Flow cytometry assay | |||
| Mechanism Description | miR-17-92 cluster plays a crucial role in cell growth of the DU145 prostate cancer cells due to regulation of cellular apoptosis-related and proliferation-related proteins, and causes chemo-resistance to cisplatin via activating AkT signaling together with upregulating ERCC1 also contributed to development of cisplatin-resistance. | |||
| Disease Class: Prostatic intraepithelial neoplasia [ICD-11: 2C82.2] | [7] | |||
| Resistant Disease | Prostatic intraepithelial neoplasia [ICD-11: 2C82.2] | |||
| Resistant Drug | Cisplatin | |||
| Molecule Alteration | Expression | Up-regulation |
||
| Experimental Note | Identified from the Human Clinical Data | |||
| Cell Pathway Regulation | Cell apoptosis | Inhibition | hsa04210 | |
| In Vitro Model | LNCaP cells | Prostate | Homo sapiens (Human) | CVCL_0395 |
| PC-3 cells | Bone | Homo sapiens (Human) | CVCL_0035 | |
| Experiment for Molecule Alteration |
qRT-PCR; Western blotting assay | |||
| Experiment for Drug Resistance |
CCK8 assay | |||
| Mechanism Description | Forced expression of the PCPH protein or, in particular, of the mt-PCPH oncoprotein increased the levels of phosphorylated PKCalpha concurrently with those of Ser70-phosphorylated and total Bcl-2 protein, thus promoting cisplatin resistance. | |||
| Drug Resistance Data Categorized by Their Corresponding Mechanisms | ||||
|
|
||||
| Disease Class: Pituitary adenoma [ICD-11: 2F37.1] | [6] | |||
| Resistant Disease | Pituitary adenoma [ICD-11: 2F37.1] | |||
| Resistant Drug | Carboplatin | |||
| Molecule Alteration | Expression | Up-regulation |
||
| Experimental Note | Identified from the Human Clinical Data | |||
| In Vitro Model | Pituitary tumour stem-like cells | Pituitary | Homo sapiens (Human) | N.A. |
| In Vivo Model | NOD/SCID mice xenograft model | Mus musculus | ||
| Experiment for Molecule Alteration |
qRT-PCR | |||
| Experiment for Drug Resistance |
WST-1 proliferation assay | |||
| Mechanism Description | Stem cells are generally known to preferentially express antiapoptotic genes, such as BCL-2, cIAP1, NAIP, and XIAP.The expression levels of these antiapoptotic genes in PASC1 were one- to sixfolds higher than those in its daughter cells. | |||
| Drug Resistance Data Categorized by Their Corresponding Mechanisms | ||||
|
|
||||
| Disease Class: Pituitary adenoma [ICD-11: 2F37.1] | [6] | |||
| Resistant Disease | Pituitary adenoma [ICD-11: 2F37.1] | |||
| Resistant Drug | Etoposide | |||
| Molecule Alteration | Expression | Up-regulation |
||
| Experimental Note | Identified from the Human Clinical Data | |||
| In Vitro Model | Pituitary tumour stem-like cells | Pituitary | Homo sapiens (Human) | N.A. |
| In Vivo Model | NOD/SCID mice xenograft model | Mus musculus | ||
| Experiment for Molecule Alteration |
qRT-PCR | |||
| Experiment for Drug Resistance |
WST-1 proliferation assay | |||
| Mechanism Description | Stem cells are generally known to preferentially express antiapoptotic genes, such as BCL-2, cIAP1, NAIP, and XIAP.The expression levels of these antiapoptotic genes in PASC1 were one- to sixfolds higher than those in its daughter cells. | |||
Disease- and Tissue-specific Abundances of This Molecule
ICD Disease Classification 02

| Differential expression of molecule in resistant diseases | ||
| The Studied Tissue | Liver | |
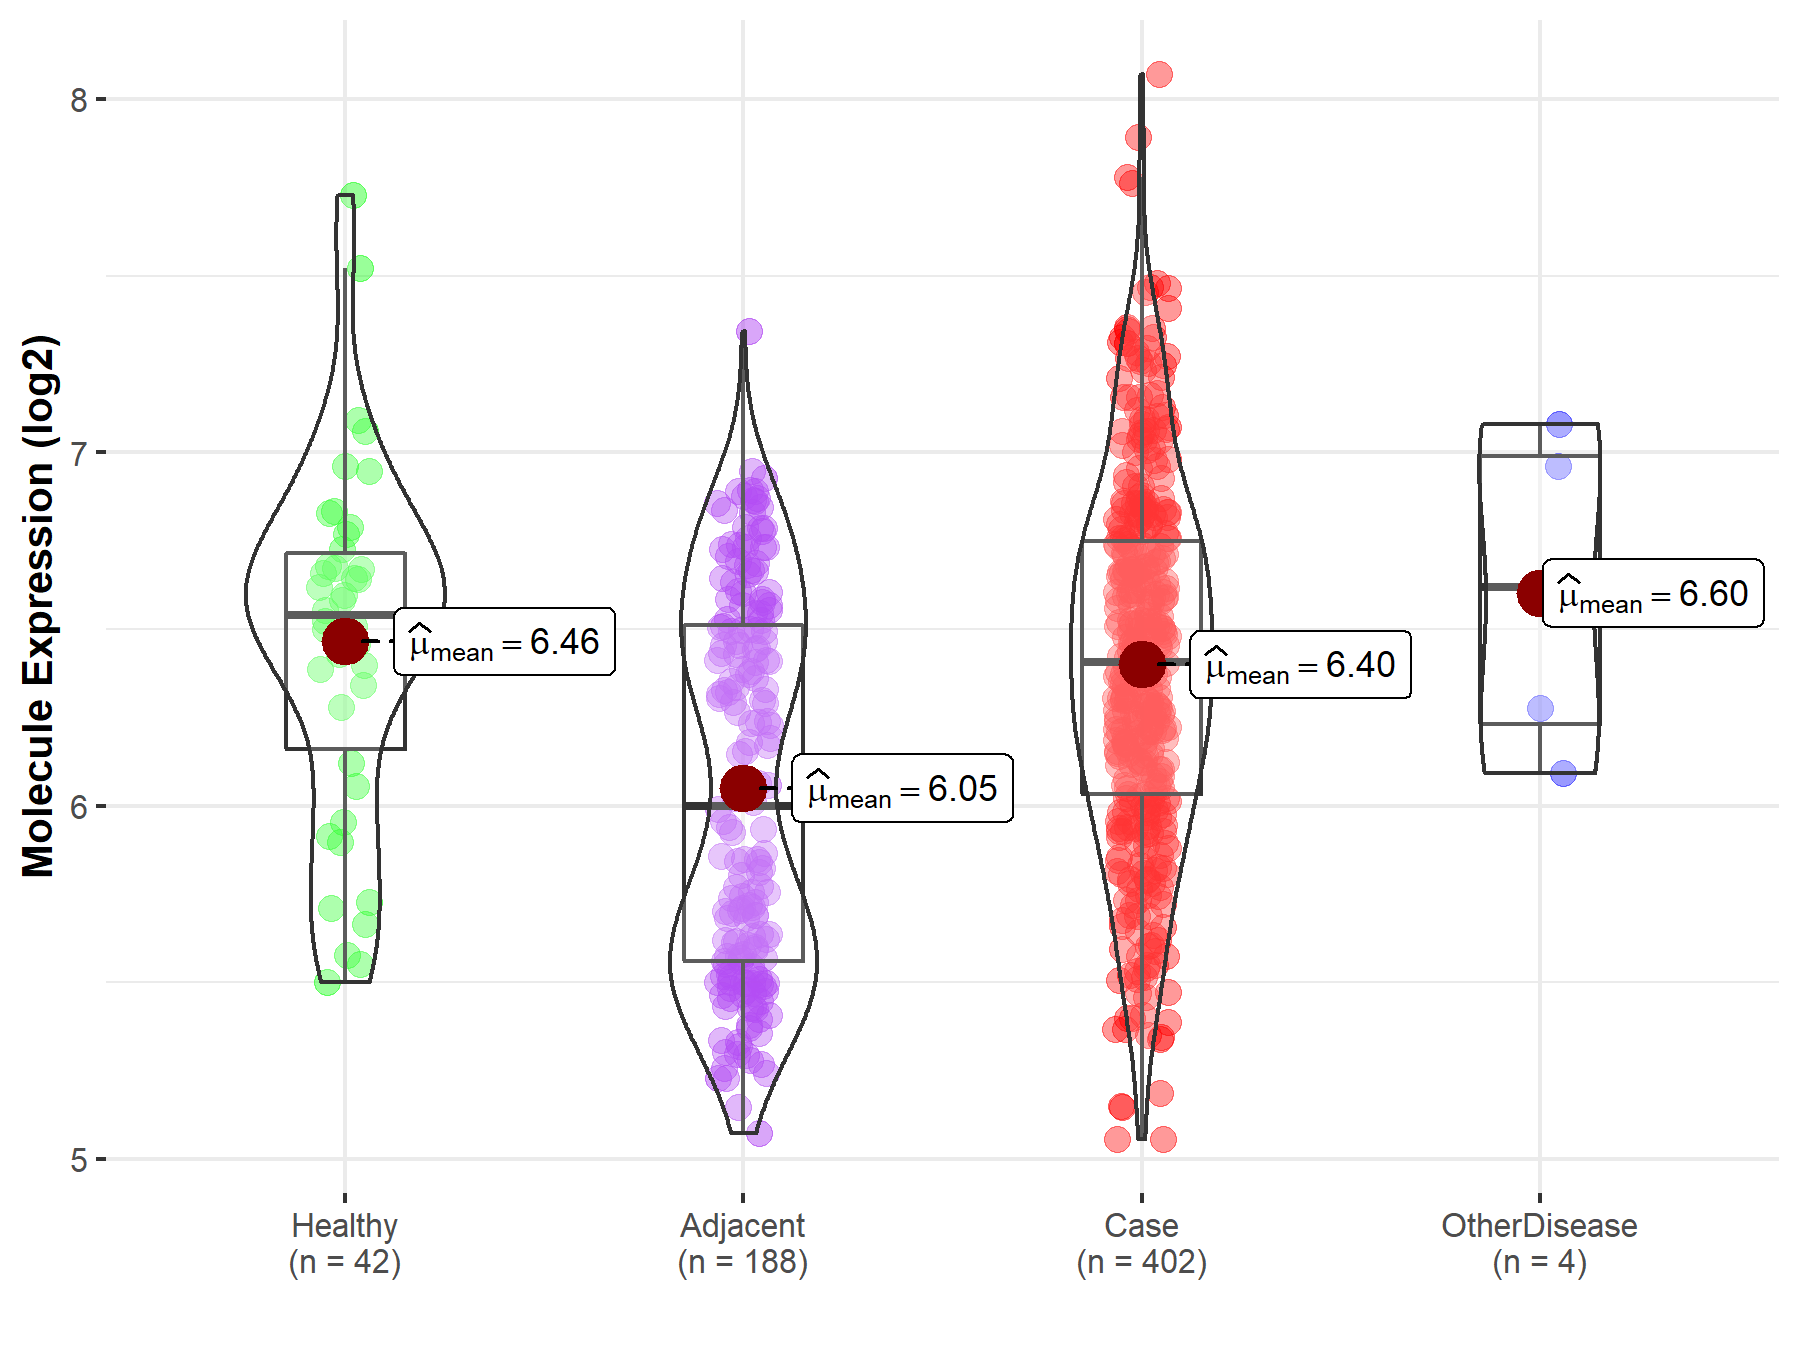
| The Specified Disease | Liver cancer | |
| The Expression Level of Disease Section Compare with the Healthy Individual Tissue | p-value: 4.27E-01; Fold-change: -1.33E-01; Z-score: -2.65E-01 | |
| The Expression Level of Disease Section Compare with the Adjacent Tissue | p-value: 6.49E-13; Fold-change: 4.05E-01; Z-score: 7.60E-01 | |
| The Expression Level of Disease Section Compare with the Other Disease Section | p-value: 4.71E-01; Fold-change: -2.13E-01; Z-score: -4.35E-01 | |
|
Molecule expression in the normal tissue adjacent to the diseased tissue of patients
Molecule expression in the diseased tissue of patients
Molecule expression in the normal tissue of healthy individuals
Molecule expression in tissue other than the diseased tissue of patients
|
||
| Disease-specific Molecule Abundances |

|
Click to View the Clearer Original Diagram |
| Differential expression of molecule in resistant diseases | ||
| The Studied Tissue | Lung | |
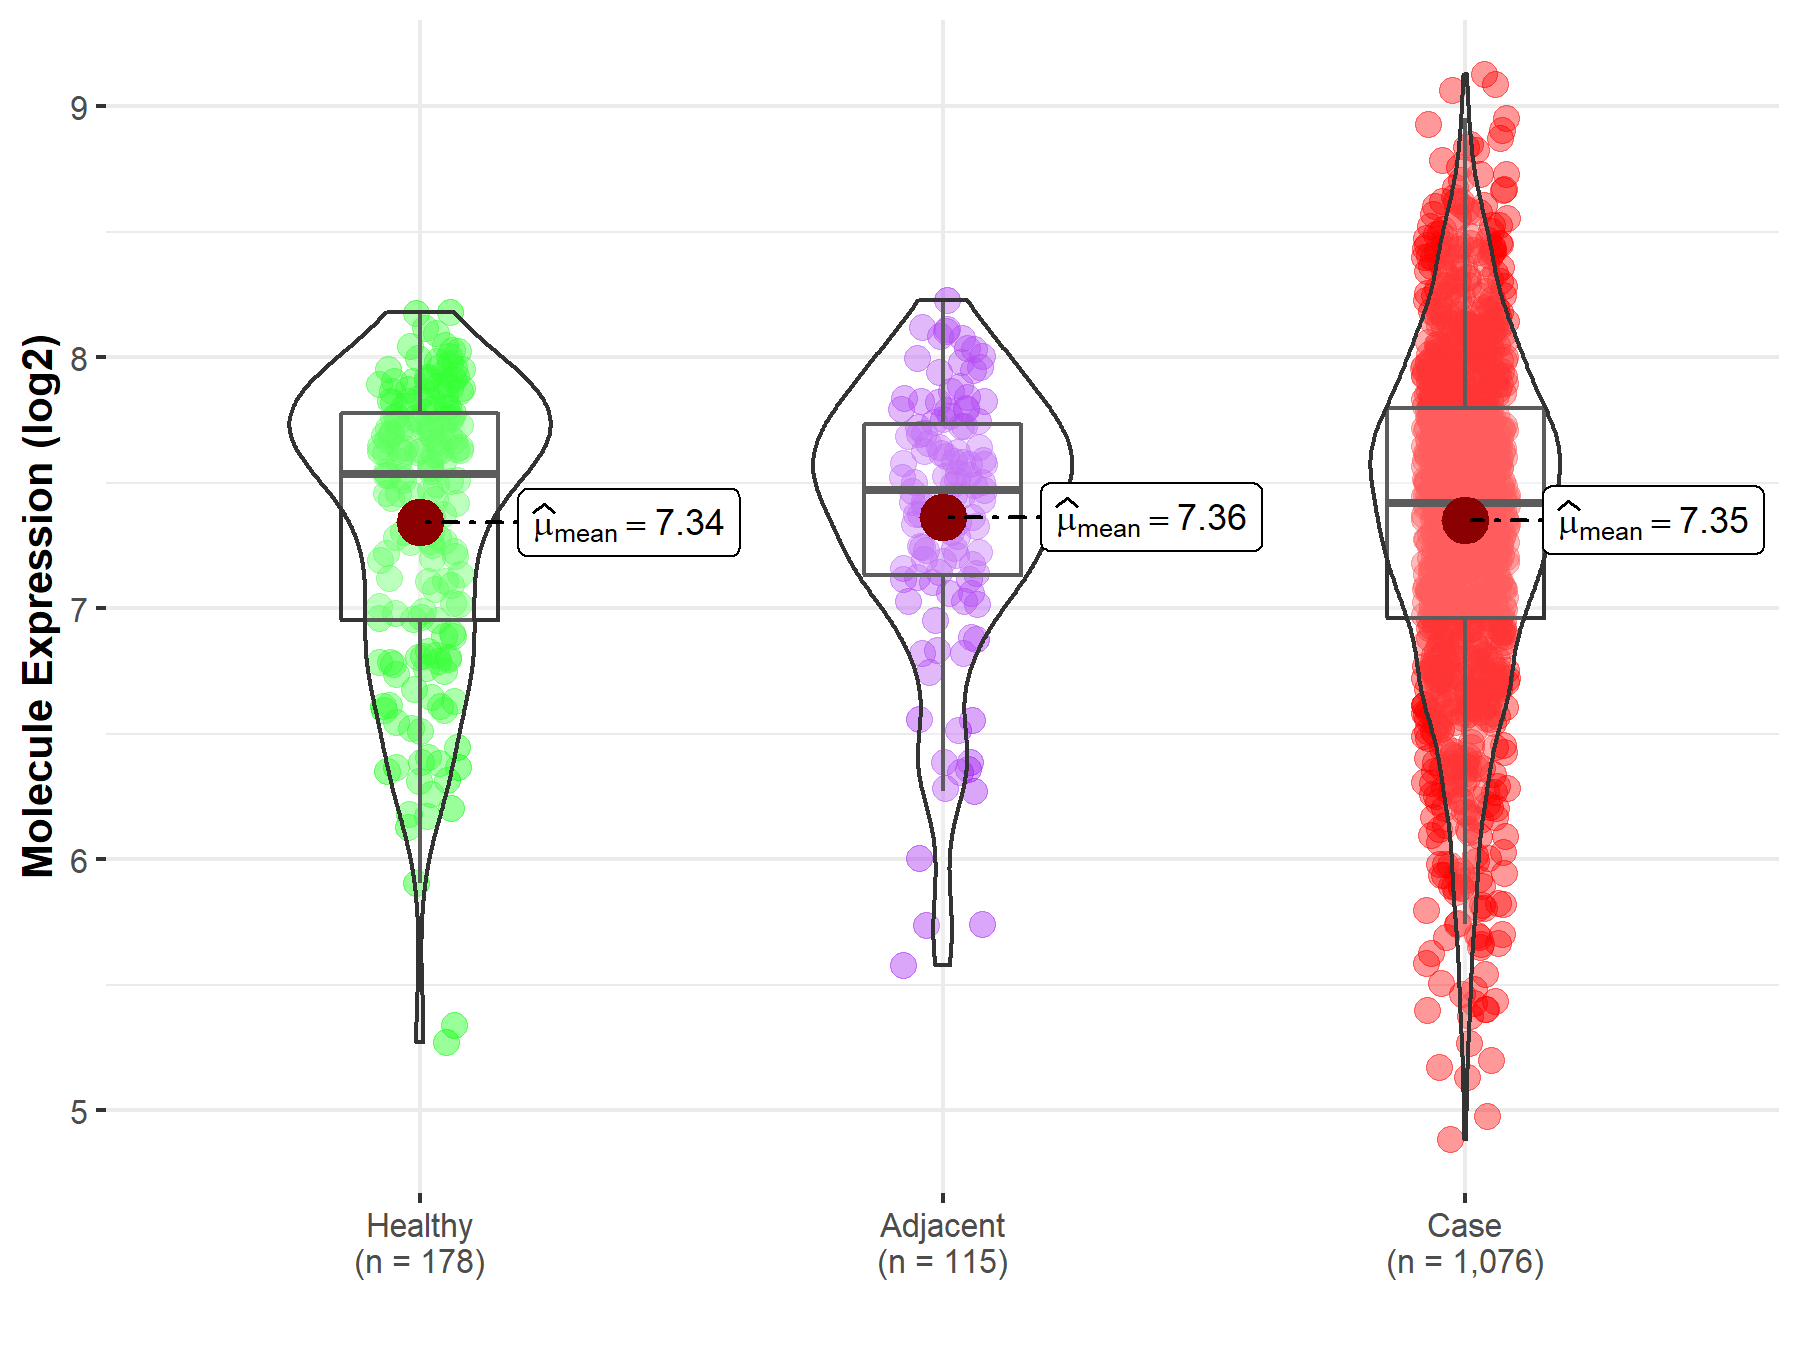
| The Specified Disease | Lung cancer | |
| The Expression Level of Disease Section Compare with the Healthy Individual Tissue | p-value: 8.54E-01; Fold-change: -1.17E-01; Z-score: -2.02E-01 | |
| The Expression Level of Disease Section Compare with the Adjacent Tissue | p-value: 8.20E-01; Fold-change: -5.20E-02; Z-score: -9.68E-02 | |
|
Molecule expression in the normal tissue adjacent to the diseased tissue of patients
Molecule expression in the diseased tissue of patients
Molecule expression in the normal tissue of healthy individuals
|
||
| Disease-specific Molecule Abundances |

|
Click to View the Clearer Original Diagram |
| Differential expression of molecule in resistant diseases | ||
| The Studied Tissue | Prostate | |
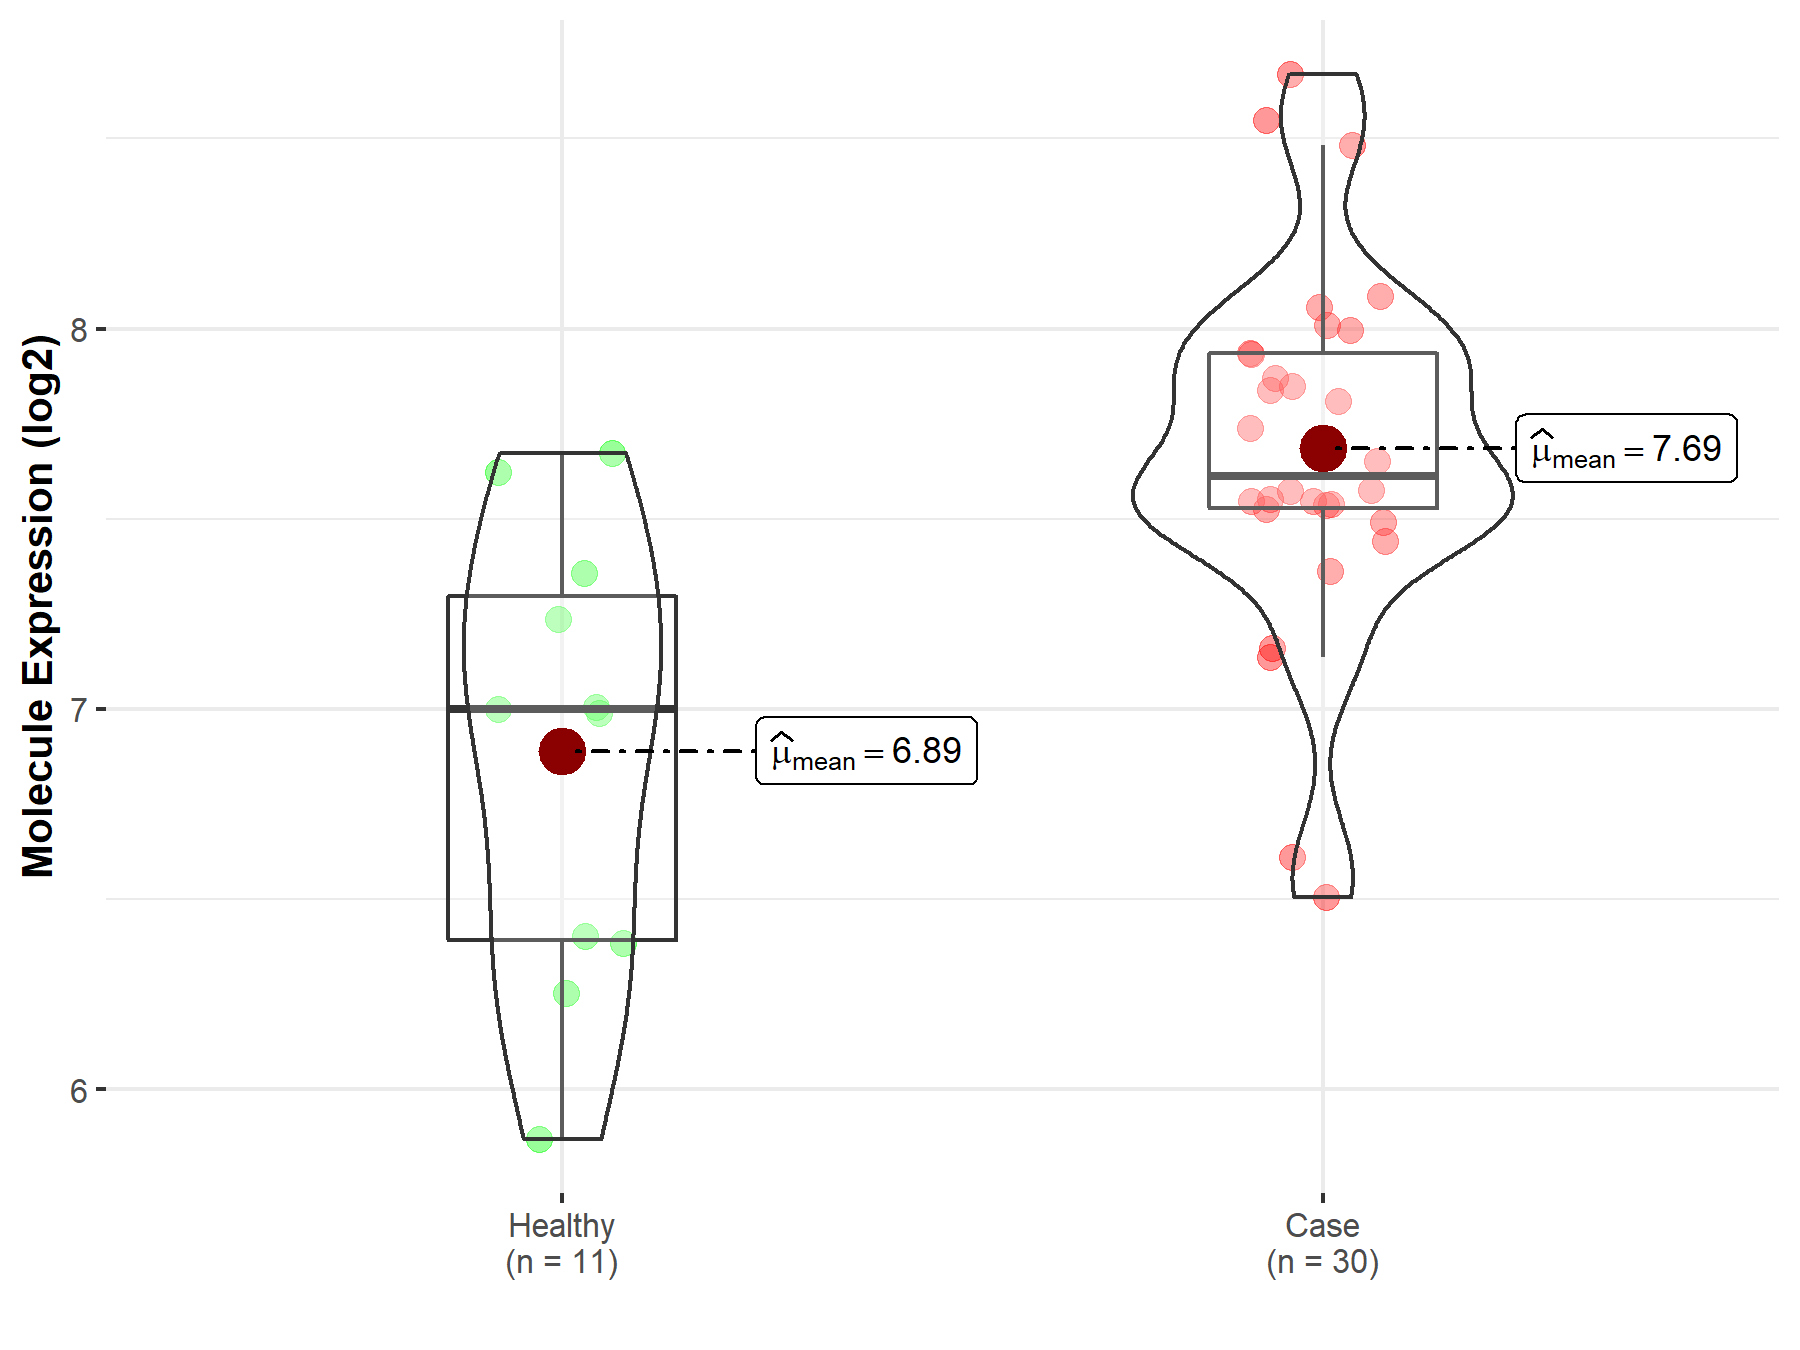
| The Specified Disease | Prostate cancer | |
| The Expression Level of Disease Section Compare with the Healthy Individual Tissue | p-value: 3.50E-03; Fold-change: -4.44E-01; Z-score: -7.28E-01 | |
|
Molecule expression in the diseased tissue of patients
Molecule expression in the normal tissue of healthy individuals
|
||
| Disease-specific Molecule Abundances |

|
Click to View the Clearer Original Diagram |
| Differential expression of molecule in resistant diseases | ||
| The Studied Tissue | Pituitary | |
| The Specified Disease | Pituitary cancer | |
| The Expression Level of Disease Section Compare with the Healthy Individual Tissue | p-value: 1.09E-03; Fold-change: 6.13E-01; Z-score: 1.04E+00 | |
|
Molecule expression in the diseased tissue of patients
Molecule expression in the normal tissue of healthy individuals
|
||
| Disease-specific Molecule Abundances |

|
Click to View the Clearer Original Diagram |
| The Studied Tissue | Pituitary | |
| The Specified Disease | Pituitary gonadotrope tumor | |
| The Expression Level of Disease Section Compare with the Healthy Individual Tissue | p-value: 4.64E-04; Fold-change: 8.24E-01; Z-score: 1.71E+00 | |
|
Molecule expression in the diseased tissue of patients
Molecule expression in the normal tissue of healthy individuals
|
||
| Disease-specific Molecule Abundances |

|
Click to View the Clearer Original Diagram |
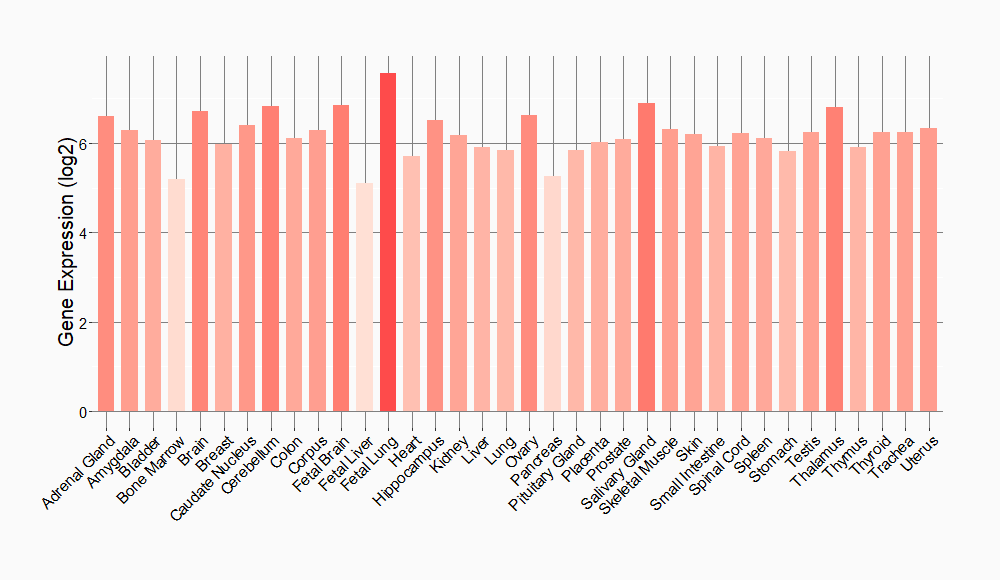
Tissue-specific Molecule Abundances in Healthy Individuals


|
||
References
If you find any error in data or bug in web service, please kindly report it to Dr. Sun and Dr. Yu.
