Molecule Information
General Information of the Molecule (ID: Mol02184)
| Name |
LMCD1 antisense RNA 1 (LMCD1-AS1)
,Homo sapiens
|
||||
|---|---|---|---|---|---|
| Synonyms |
LMCD1-AS1
Click to Show/Hide
|
||||
| Molecule Type |
LncRNA
|
||||
| Gene Name |
LMCD1-AS1
|
||||
| Gene ID | |||||
| Location |
chr3:7,951,263-8,611,924[-]
|
||||
| Ensembl ID | |||||
| HGNC ID | |||||
| Click to Show/Hide the Complete Species Lineage | |||||
Type(s) of Resistant Mechanism of This Molecule
 EADR: Epigenetic Alteration of DNA, RNA or Protein
Drug Resistance Data Categorized by Drug
Investigative Drug(s)
1 drug(s) in total
| Drug Resistance Data Categorized by Their Corresponding Mechanisms | ||||
|
Epigenetic Alteration of DNA, RNA or Protein (EADR)
|
||||
| Disease Class: Cholangiocarcinoma [ICD-11: 2C12.0] | [1] | |||
| Resistant Disease | Cholangiocarcinoma [ICD-11: 2C12.0] | |||
| Resistant Drug | Aspirin CD3 | |||
| Molecule Alteration | Down-regulation | Interaction |
||
| Experimental Note | Identified from the Human Clinical Data | |||
| In Vitro Model | Huh-7 cells | Liver | Homo sapiens (Human) | CVCL_0336 |
| HepG2 cells | Liver | Homo sapiens (Human) | CVCL_0027 | |
| In Vivo Model | Male BALB/c-nu/nu athymic nude mice model | Mus musculus | ||
| Experiment for Molecule Alteration |
qRT-PCR; Western bloting analysis; Luciferase assay; Immunofluorescence assay; ChIP assay; Immunohistochemistry analysis | |||
| Experiment for Drug Resistance |
MTT assay | |||
| Mechanism Description | Aspirin targets P4HA2 through inhibiting NF-kappa-B and LMCD1-AS1/let-7g to inhibit tumour growth and collagen deposition in hepatocellular carcinoma. | |||
Disease- and Tissue-specific Abundances of This Molecule
ICD Disease Classification 02

| Differential expression of molecule in resistant diseases | ||
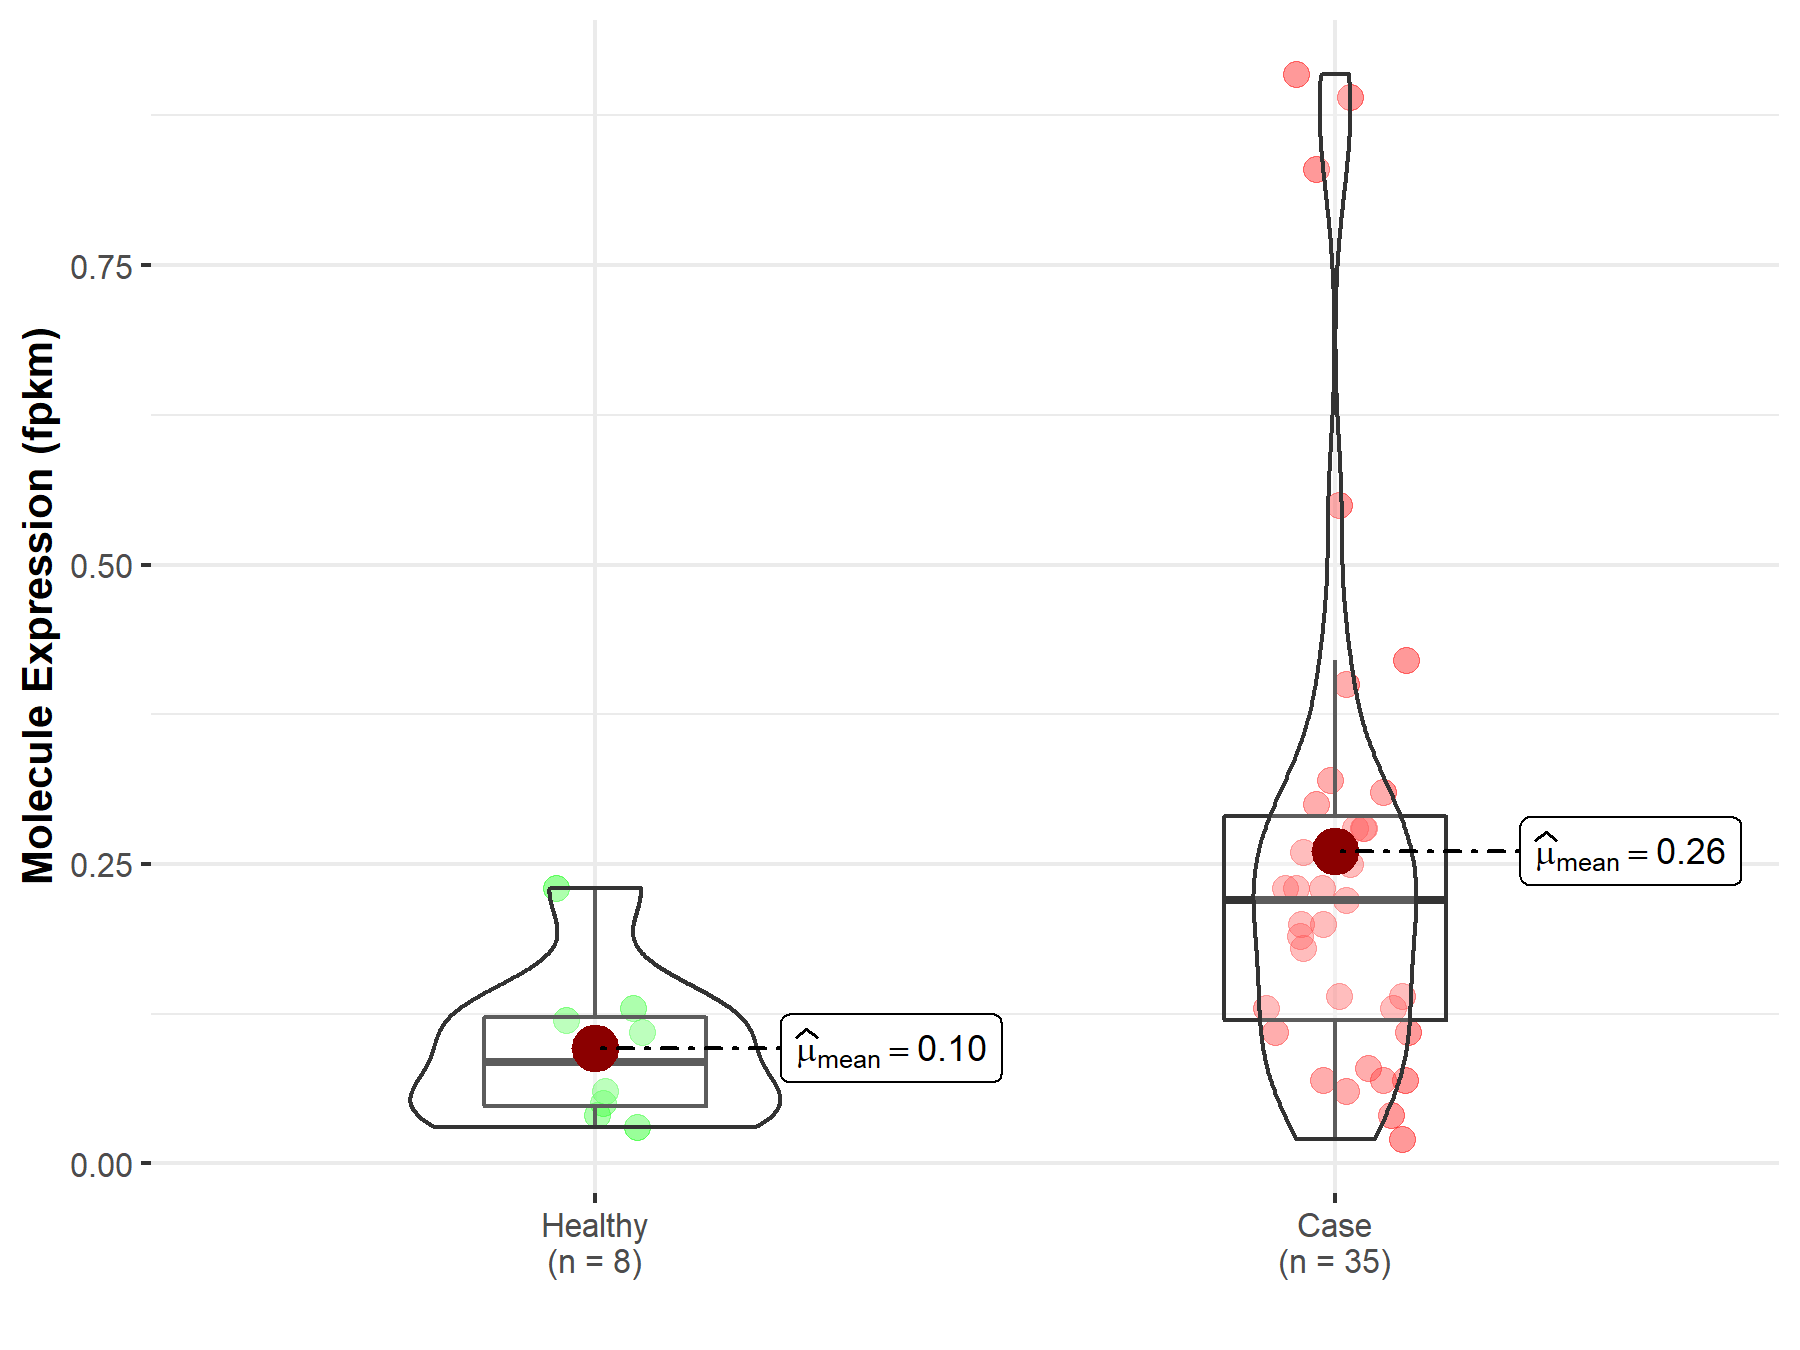
| The Studied Tissue | Bile duct | |
| The Specified Disease | Cholangiocarcinoma | |
| The Expression Level of Disease Section Compare with the Healthy Individual Tissue | p-value: 2.43E-02; Fold-change: -3.72E-01 | |
|
Molecule expression in the diseased tissue of patients
Molecule expression in the normal tissue of healthy individuals
|
||
| Disease-specific Molecule Abundances |
|
Click to View the Clearer Original Diagram |
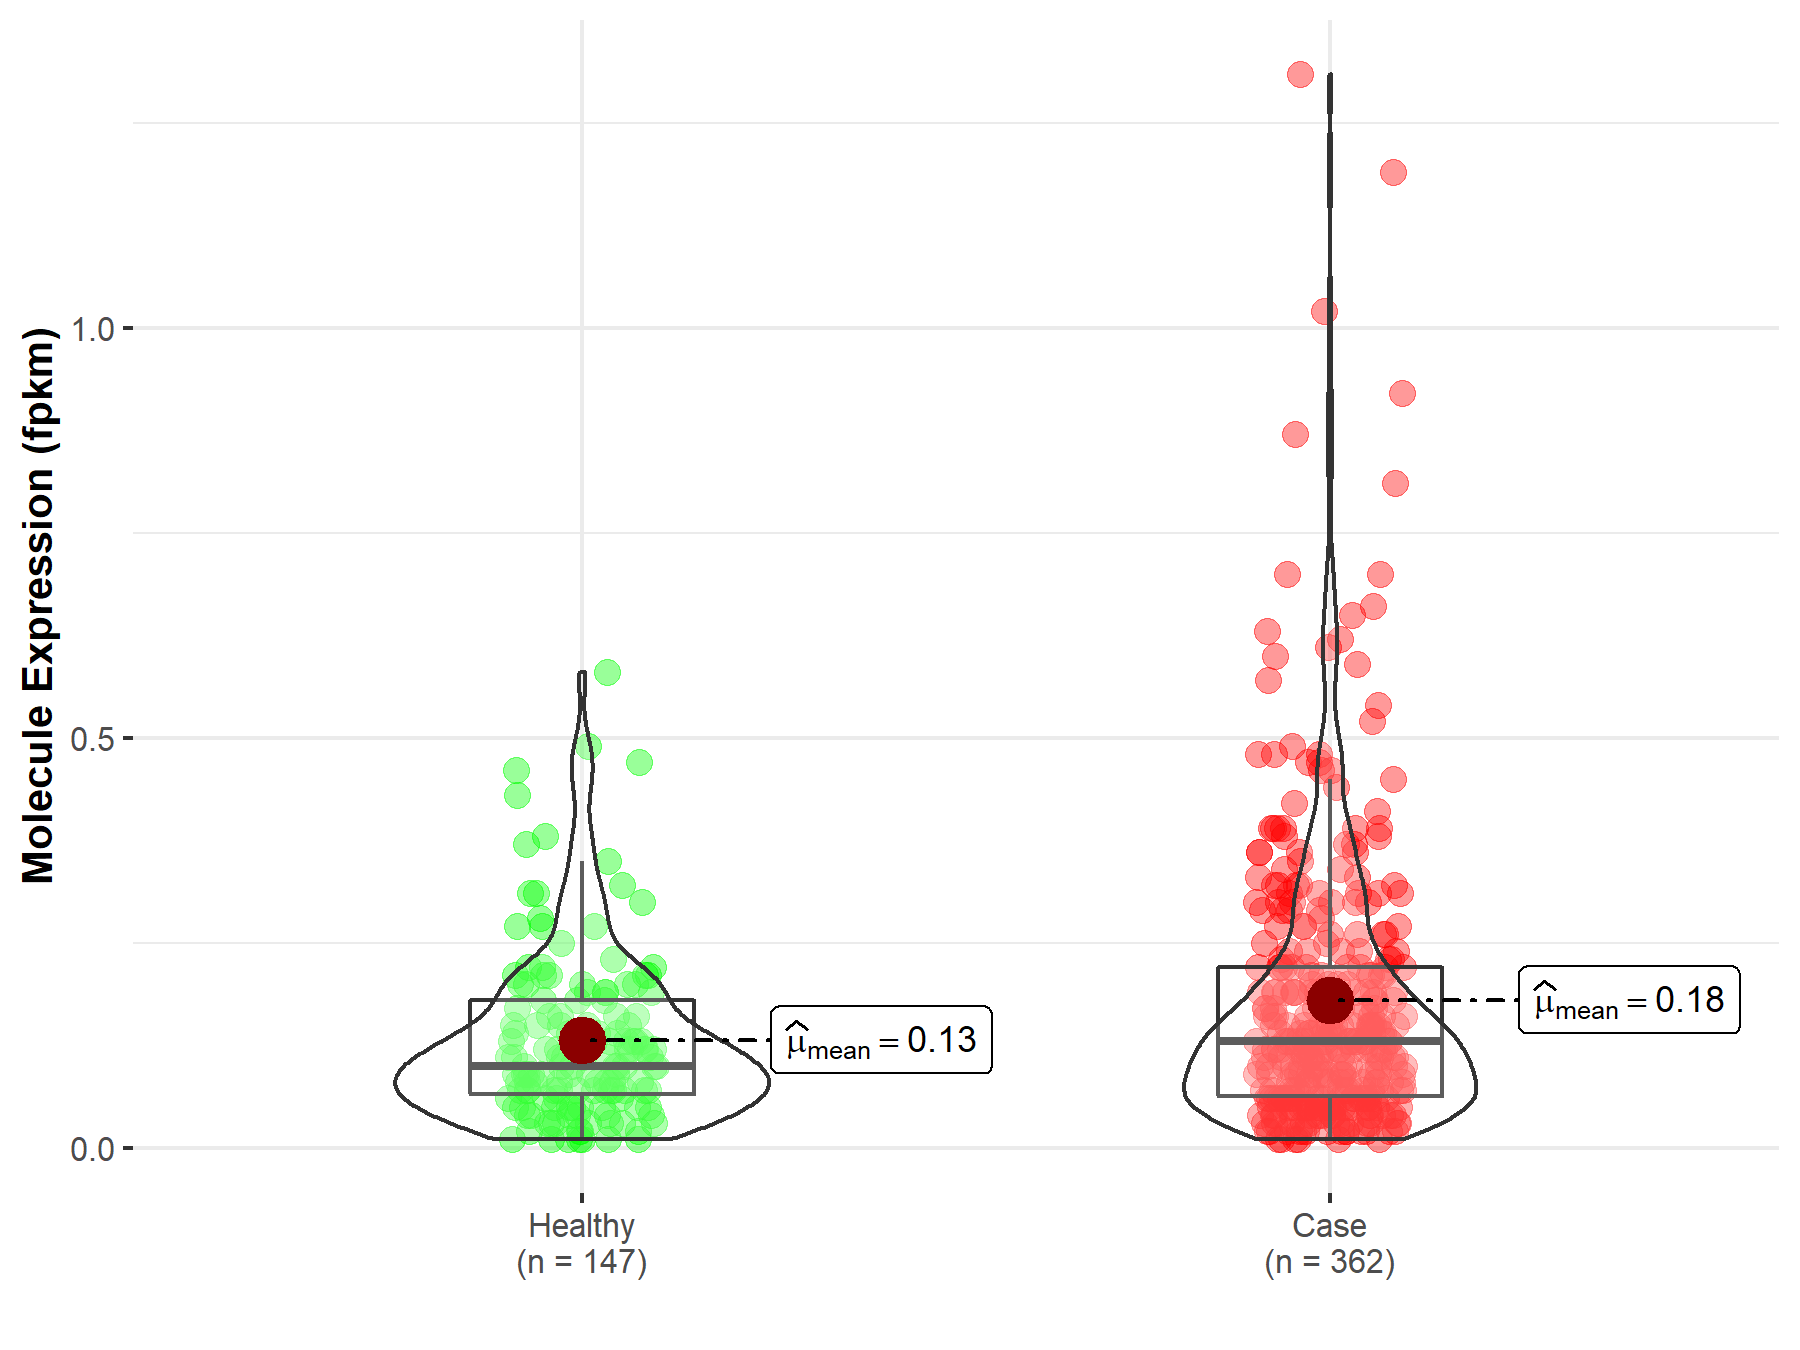
| The Studied Tissue | Liver | |
| The Specified Disease | Liver hepatocellular carcinoma | |
| The Expression Level of Disease Section Compare with the Healthy Individual Tissue | p-value: 2.78E-03; Fold-change: -1.11E-01 | |
|
Molecule expression in the diseased tissue of patients
Molecule expression in the normal tissue of healthy individuals
|
||
| Disease-specific Molecule Abundances |
|
Click to View the Clearer Original Diagram |
Tissue-specific Molecule Abundances in Healthy Individuals

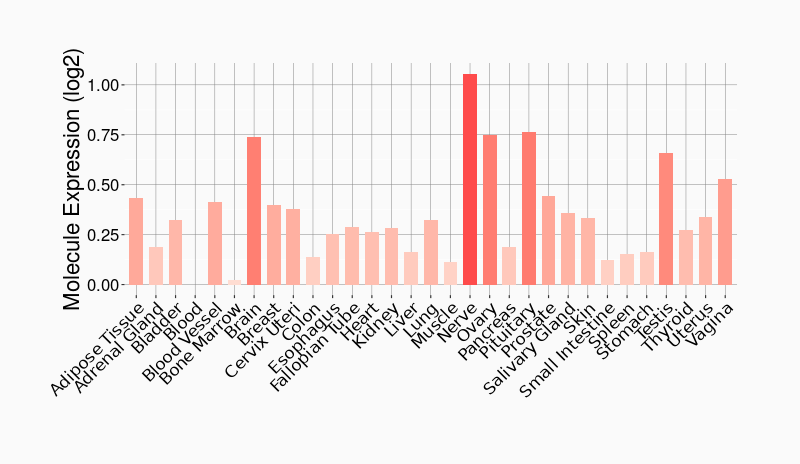
|
||
References
If you find any error in data or bug in web service, please kindly report it to Dr. Sun and Dr. Yu.