Molecule Information
General Information of the Molecule (ID: Mol01896)
| Name |
Prostaglandin-endoperoxide synthase 1 (PTGS1)
,Homo sapiens
|
||||
|---|---|---|---|---|---|
| Synonyms |
MT-CO1; COI; COXI; MTCO1
Click to Show/Hide
|
||||
| Molecule Type |
Protein
|
||||
| Gene Name |
PTGS1
|
||||
| Gene ID | |||||
| Sequence |
MFADRWLFSTNHKDIGTLYLLFGAWAGVLGTALSLLIRAELGQPGNLLGNDHIYNVIVTA
HAFVMIFFMVMPIMIGGFGNWLVPLMIGAPDMAFPRMNNMSFWLLPPSLLLLLASAMVEA GAGTGWTVYPPLAGNYSHPGASVDLTIFSLHLAGVSSILGAINFITTIINMKPPAMTQYQ TPLFVWSVLITAVLLLLSLPVLAAGITMLLTDRNLNTTFFDPAGGGDPILYQHLFWFFGH PEVYILILPGFGMISHIVTYYSGKKEPFGYMGMVWAMMSIGFLGFIVWAHHMFTVGMDVD TRAYFTSATMIIAIPTGVKVFSWLATLHGSNMKWSAAVLWALGFIFLFTVGGLTGIVLAN SSLDIVLHDTYYVVAHFHYVLSMGAVFAIMGGFIHWFPLFSGYTLDQTYAKIHFTIMFIG VNLTFFPQHFLGLSGMPRRYSDYPDAYTTWNILSSVGSFISLTAVMLMIFMIWEAFASKR KVLMVEEPSMNLEWLYGCPPPYHTFEEPVYMKS Click to Show/Hide
|
||||
| 3D-structure |
|
||||
| Function |
Component of the cytochrome c oxidase, the last enzyme in the mitochondrial electron transport chain which drives oxidative phosphorylation. The respiratory chain contains 3 multisubunit complexes succinate dehydrogenase (complex II, CII), ubiquinol-cytochrome c oxidoreductase (cytochrome b-c1 complex, complex III, CIII) and cytochrome c oxidase (complex IV, CIV), that cooperate to transfer electrons derived from NADH and succinate to molecular oxygen, creating an electrochemical gradient over the inner membrane that drives transmembrane transport and the ATP synthase. Cytochrome c oxidase is the component of the respiratory chain that catalyzes the reduction of oxygen to water. Electrons originating from reduced cytochrome c in the intermembrane space (IMS) are transferred via the dinuclear copper A center (CU(A)) of subunit 2 and heme A of subunit 1 to the active site in subunit 1, a binuclear center (BNC) formed by heme A3 and copper B (CU(B)). The BNC reduces molecular oxygen to 2 water molecules using 4 electrons from cytochrome c in the IMS and 4 protons from the mitochondrial matrix.
Click to Show/Hide
|
||||
| Uniprot ID | |||||
| HGNC ID | |||||
| Click to Show/Hide the Complete Species Lineage | |||||
Type(s) of Resistant Mechanism of This Molecule
 ADTT: Aberration of the Drug's Therapeutic Target
Drug Resistance Data Categorized by Drug
Approved Drug(s)
1 drug(s) in total
| Drug Resistance Data Categorized by Their Corresponding Mechanisms | ||||
|
Aberration of the Drug's Therapeutic Target (ADTT)
|
||||
| Disease Class: Acute myocardial infarction [ICD-11: BA41.1] | [1] | |||
| Resistant Disease | Acute myocardial infarction [ICD-11: BA41.1] | |||
| Resistant Drug | Aspirin | |||
| Molecule Alteration | Missense mutation | p.C50T+p.A842G+p.A1676G |
||
| Experimental Note | Identified from the Human Clinical Data | |||
| Mechanism Description | The following factors contribute to aspirin resistance: the COX-1 polymorphisms of C50T, -A842G, and A1676G; the COX-2 polymorphism of -765. | |||
| Disease Class: Hypo-attenuated leaflet thickening [ICD-11: BD10.2] | [2] | |||
| Resistant Disease | Hypo-attenuated leaflet thickening [ICD-11: BD10.2] | |||
| Resistant Drug | Aspirin | |||
| Molecule Alteration | SNP | rs10306114 |
||
| Experimental Note | Identified from the Human Clinical Data | |||
| Mechanism Description | We thoroughly genotyped 34 SNPs and 8 SNPs that have been reported for clopidogrel and aspirin resistance. A total of 148 patients were enrolled. There were 15 patients demonstrating signs of HALT. Patients with HALT had a higher rate of atrial fibrillation (AF) pre-TAVR (33.3 vs. 7.5%, P = 0.01). | |||
| Disease Class: Dysmenorrhea [ICD-11: GA34.3] | [3] | |||
| Resistant Disease | Dysmenorrhea [ICD-11: GA34.3] | |||
| Resistant Drug | Aspirin | |||
| Molecule Alteration | SNP | rs10306114 |
||
| Experimental Note | Identified from the Human Clinical Data | |||
| Mechanism Description | Genetic polymorphisms have been shown to disrupt COX-1 inhibition with aspirin. For example, Ulehlova et al demonstrated that COX-1 polymorphism rs10306114 was correlated with high platelet aggregation in aspirin-resistant individuals. | |||
Disease- and Tissue-specific Abundances of This Molecule
ICD Disease Classification 11

| Differential expression of molecule in resistant diseases | ||
| The Studied Tissue | Peripheral blood | |
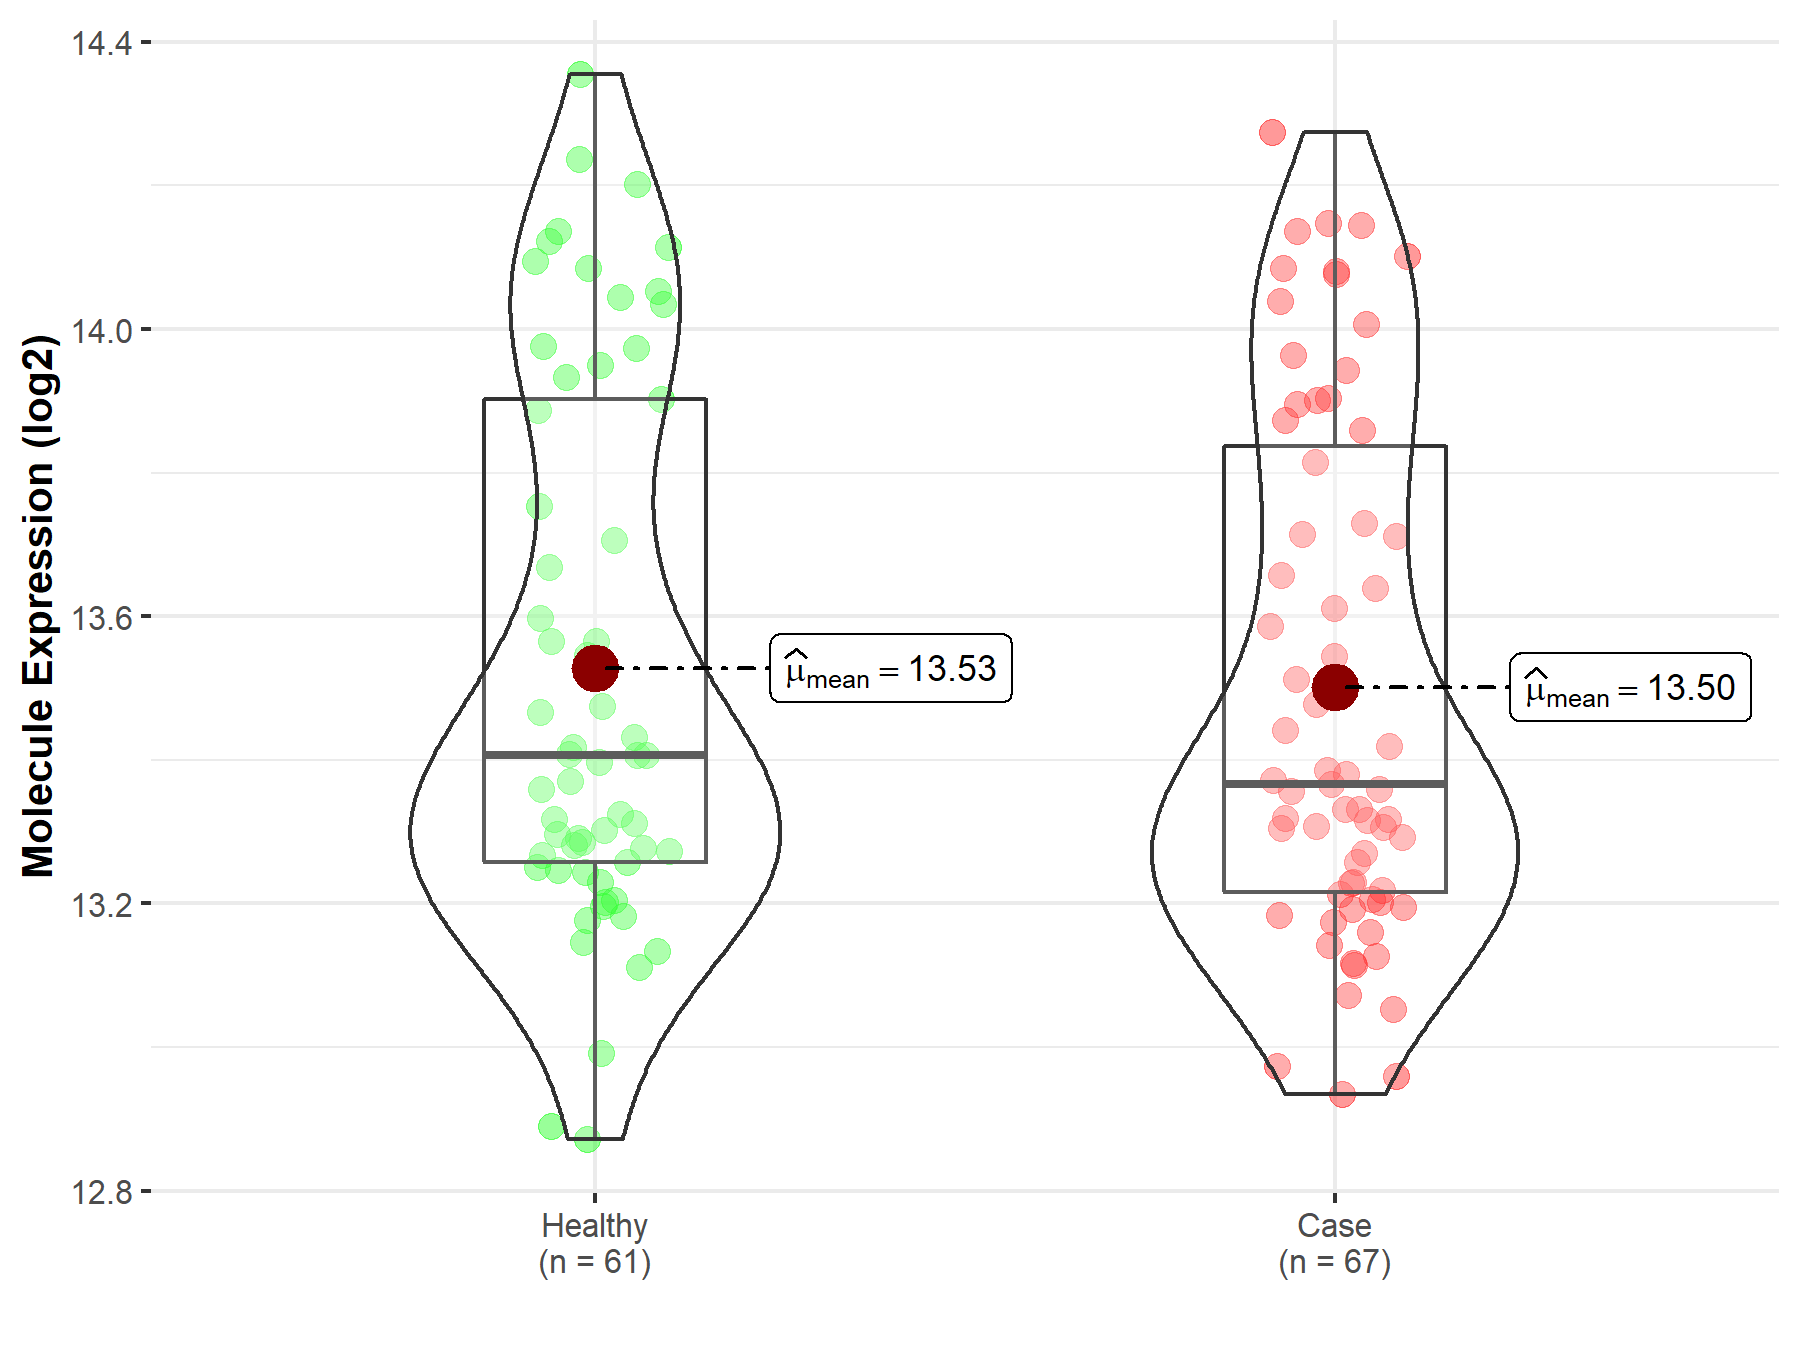
| The Specified Disease | Myocardial infarction | |
| The Expression Level of Disease Section Compare with the Healthy Individual Tissue | p-value: 6.82E-01; Fold-change: -3.91E-02; Z-score: -1.04E-01 | |
|
Molecule expression in the diseased tissue of patients
Molecule expression in the normal tissue of healthy individuals
|
||
| Disease-specific Molecule Abundances |
|
Click to View the Clearer Original Diagram |
References
If you find any error in data or bug in web service, please kindly report it to Dr. Sun and Dr. Yu.