Molecule Information
General Information of the Molecule (ID: Mol01322)
| Name |
KCNQ1 opposite strand/antisense transcript 1 (KCNQ1OT1)
,Homo sapiens
|
||||
|---|---|---|---|---|---|
| Synonyms |
KCNQ1OT1
Click to Show/Hide
|
||||
| Molecule Type |
LncRNA
|
||||
| Gene Name |
FOXF1-AS1, lincFOXF1, onco-lncRNA-21
|
||||
| Gene ID | |||||
| Location |
chr11:2608328-2699994[-]
|
||||
| Ensembl ID | |||||
| HGNC ID | |||||
| Click to Show/Hide the Complete Species Lineage | |||||
Type(s) of Resistant Mechanism of This Molecule
 EADR: Epigenetic Alteration of DNA, RNA or Protein
Drug Resistance Data Categorized by Drug
Approved Drug(s)
3 drug(s) in total
| Drug Resistance Data Categorized by Their Corresponding Mechanisms | ||||
|
Epigenetic Alteration of DNA, RNA or Protein (EADR)
|
||||
| Disease Class: Hepatocellular carcinoma [ICD-11: 2C12.2] | [1] | |||
| Resistant Disease | Hepatocellular carcinoma [ICD-11: 2C12.2] | |||
| Resistant Drug | Oxaliplatin | |||
| Molecule Alteration | Expression | Up-regulation |
||
| Differential expression of the molecule in resistant disease | ||||
| Classification of Disease | Liver cancer [ICD-11: 2C12] | |||
| The Specified Disease | Cholangiocarcinoma | |||
| The Studied Tissue | Bile duct | |||
| The Expression Level of Disease Section Compare with the Healthy Individual Tissue | p-value: 1.01E-06 Fold-change: 2.31E+00 Z-score: 5.87E+00 |
|||
| Experimental Note | Identified from the Human Clinical Data | |||
| Cell Pathway Regulation | Cell invasion | Activation | hsa05200 | |
| Cell migration | Activation | hsa04670 | ||
| Cell proliferation | Activation | hsa05200 | ||
| Cell viability | Activation | hsa05200 | ||
| miR7-5p/ABCC1 signaling pathway | Regulation | N.A. | ||
| In Vitro Model | Huh-7 cells | Liver | Homo sapiens (Human) | CVCL_0336 |
| HepG2 cells | Liver | Homo sapiens (Human) | CVCL_0027 | |
| SMMC7721 cells | Uterus | Homo sapiens (Human) | CVCL_0534 | |
| Skhep1 cells | Liver | Homo sapiens (Human) | CVCL_0525 | |
| Experiment for Molecule Alteration |
qRT-PCR | |||
| Experiment for Drug Resistance |
CCK8 assay | |||
| Mechanism Description | Overexpression of kCNQ1OT1 enhances OXA resistance through downregulating miR-7-5p and upregulating ABCC1 in HCC cells. | |||
| Drug Resistance Data Categorized by Their Corresponding Mechanisms | ||||
|
Epigenetic Alteration of DNA, RNA or Protein (EADR)
|
||||
| Disease Class: Tongue cancer [ICD-11: 2B62.0] | [2] | |||
| Resistant Disease | Tongue cancer [ICD-11: 2B62.0] | |||
| Resistant Drug | Cisplatin | |||
| Molecule Alteration | Expression | Up-regulation |
||
| Experimental Note | Revealed Based on the Cell Line Data | |||
| Cell Pathway Regulation | Cell apoptosis | Activation | hsa04210 | |
| Cell proliferation | Activation | hsa05200 | ||
| Ezrin/FAKT/Src signaling pathway | Activation | hsa05205 | ||
| In Vitro Model | CAL27 cells | Oral | Homo sapiens (Human) | CVCL_1107 |
| SCC9 cells | Tongue | Homo sapiens (Human) | CVCL_1685 | |
| In Vivo Model | Nude mouse xenograft model | Mus musculus | ||
| Experiment for Molecule Alteration |
Microarray; RT-PCR | |||
| Experiment for Drug Resistance |
MTS assay; EdU assay; Flow cytometric analysis | |||
| Mechanism Description | KCNQ1OT1 promotes TSCC cell proliferation and chemo-resistance via the regulation of miR-211-5p mediated Ezrin/Fak/Src signaling. | |||
| Drug Resistance Data Categorized by Their Corresponding Mechanisms | ||||
|
Epigenetic Alteration of DNA, RNA or Protein (EADR)
|
||||
| Disease Class: Glioma [ICD-11: 2A00.02] | [3] | |||
| Resistant Disease | Glioma [ICD-11: 2A00.02] | |||
| Resistant Drug | Temozolomide | |||
| Molecule Alteration | Expression | Up-regulation |
||
| Experimental Note | Revealed Based on the Cell Line Data | |||
| In Vitro Model | U251 cells | Brain | Homo sapiens (Human) | CVCL_0021 |
| U87 cells | Brain | Homo sapiens (Human) | CVCL_0022 | |
| In Vivo Model | Nude mouse xenograft model | Mus musculus | ||
| Experiment for Molecule Alteration |
RT-PCR; Dual?Luciferase Assay; Western Blot; qRT?PCR; Immunohistochemical; Immunofluorescence | |||
| Experiment for Drug Resistance |
Clonogenicity Assay; Apoptosis Analysis; MTT Assay | |||
| Mechanism Description | The present study demonstrated that the lncRNA KCNQ1OT1 increased in TMZ-resistant glioma cells compared to the TMZ-sensitive cells. The introduction of KCNQ1OT1 promoted cell viability, clonogenicity, and rhodamine 123 efflux while hampering TMZ-induced apoptosis. Moreover, KCNQ1OT1 directly sponged miR-761, which decreased in TMZ-resistant sublines. The overexpression of miR-761 attenuated cell viability and clonogenicity, while triggering apoptosis and rhodamine 123 accumulation post-TMZ exposure, leading to a response to TMZ. The interaction between miR-761 and 3'-untranslated region of PIM1 attenuated PIM1-mediated signaling cascades. Furthermore, the knockdown of KCNQ1OT1 augmented the TMZ-induced tumor regression in TMZ-resistant U251 mouse models. Briefly, the present study evaluated that KCNQ1OT1 conferred TMZ resistance by releasing PIM1 expression from miR-761, resulting in the upregulation of PIM-mediated MDR1, c-Myc, and Survivin. The present findings demonstrated that the interplay of KCNQ1OT1: miR-761: PIM1 regulated chemoresistance in gliomas and provided a promising therapeutic target for TMZ-resistant glioma patients. | |||
Disease- and Tissue-specific Abundances of This Molecule
ICD Disease Classification 02

| Differential expression of molecule in resistant diseases | ||
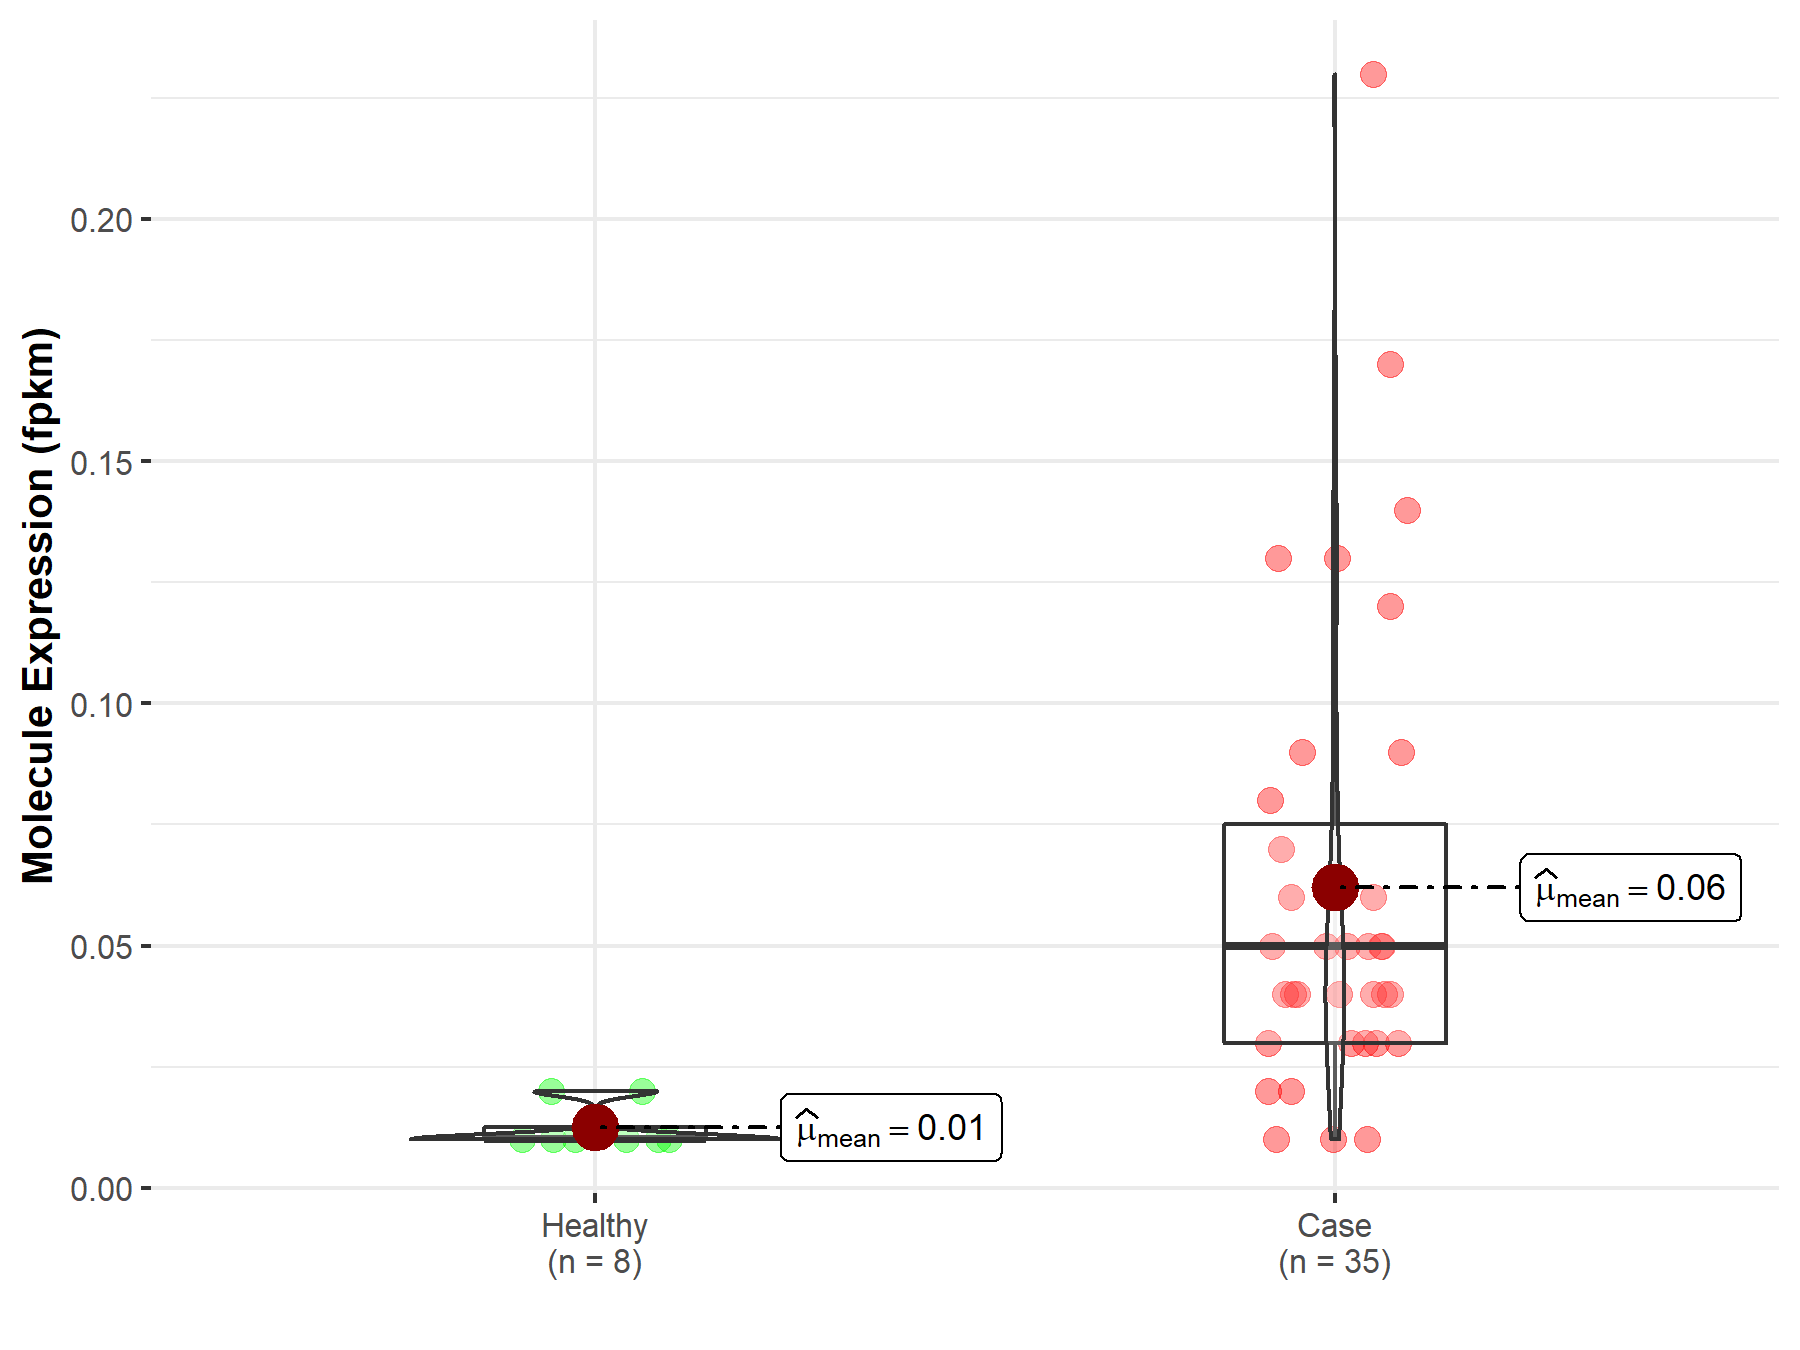
| The Studied Tissue | Bile duct | |
| The Specified Disease | Cholangiocarcinoma | |
| The Expression Level of Disease Section Compare with the Healthy Individual Tissue | p-value: 2.53E-03; Fold-change: -6.92E-01 | |
|
Molecule expression in the diseased tissue of patients
Molecule expression in the normal tissue of healthy individuals
|
||
| Disease-specific Molecule Abundances |
|
Click to View the Clearer Original Diagram |
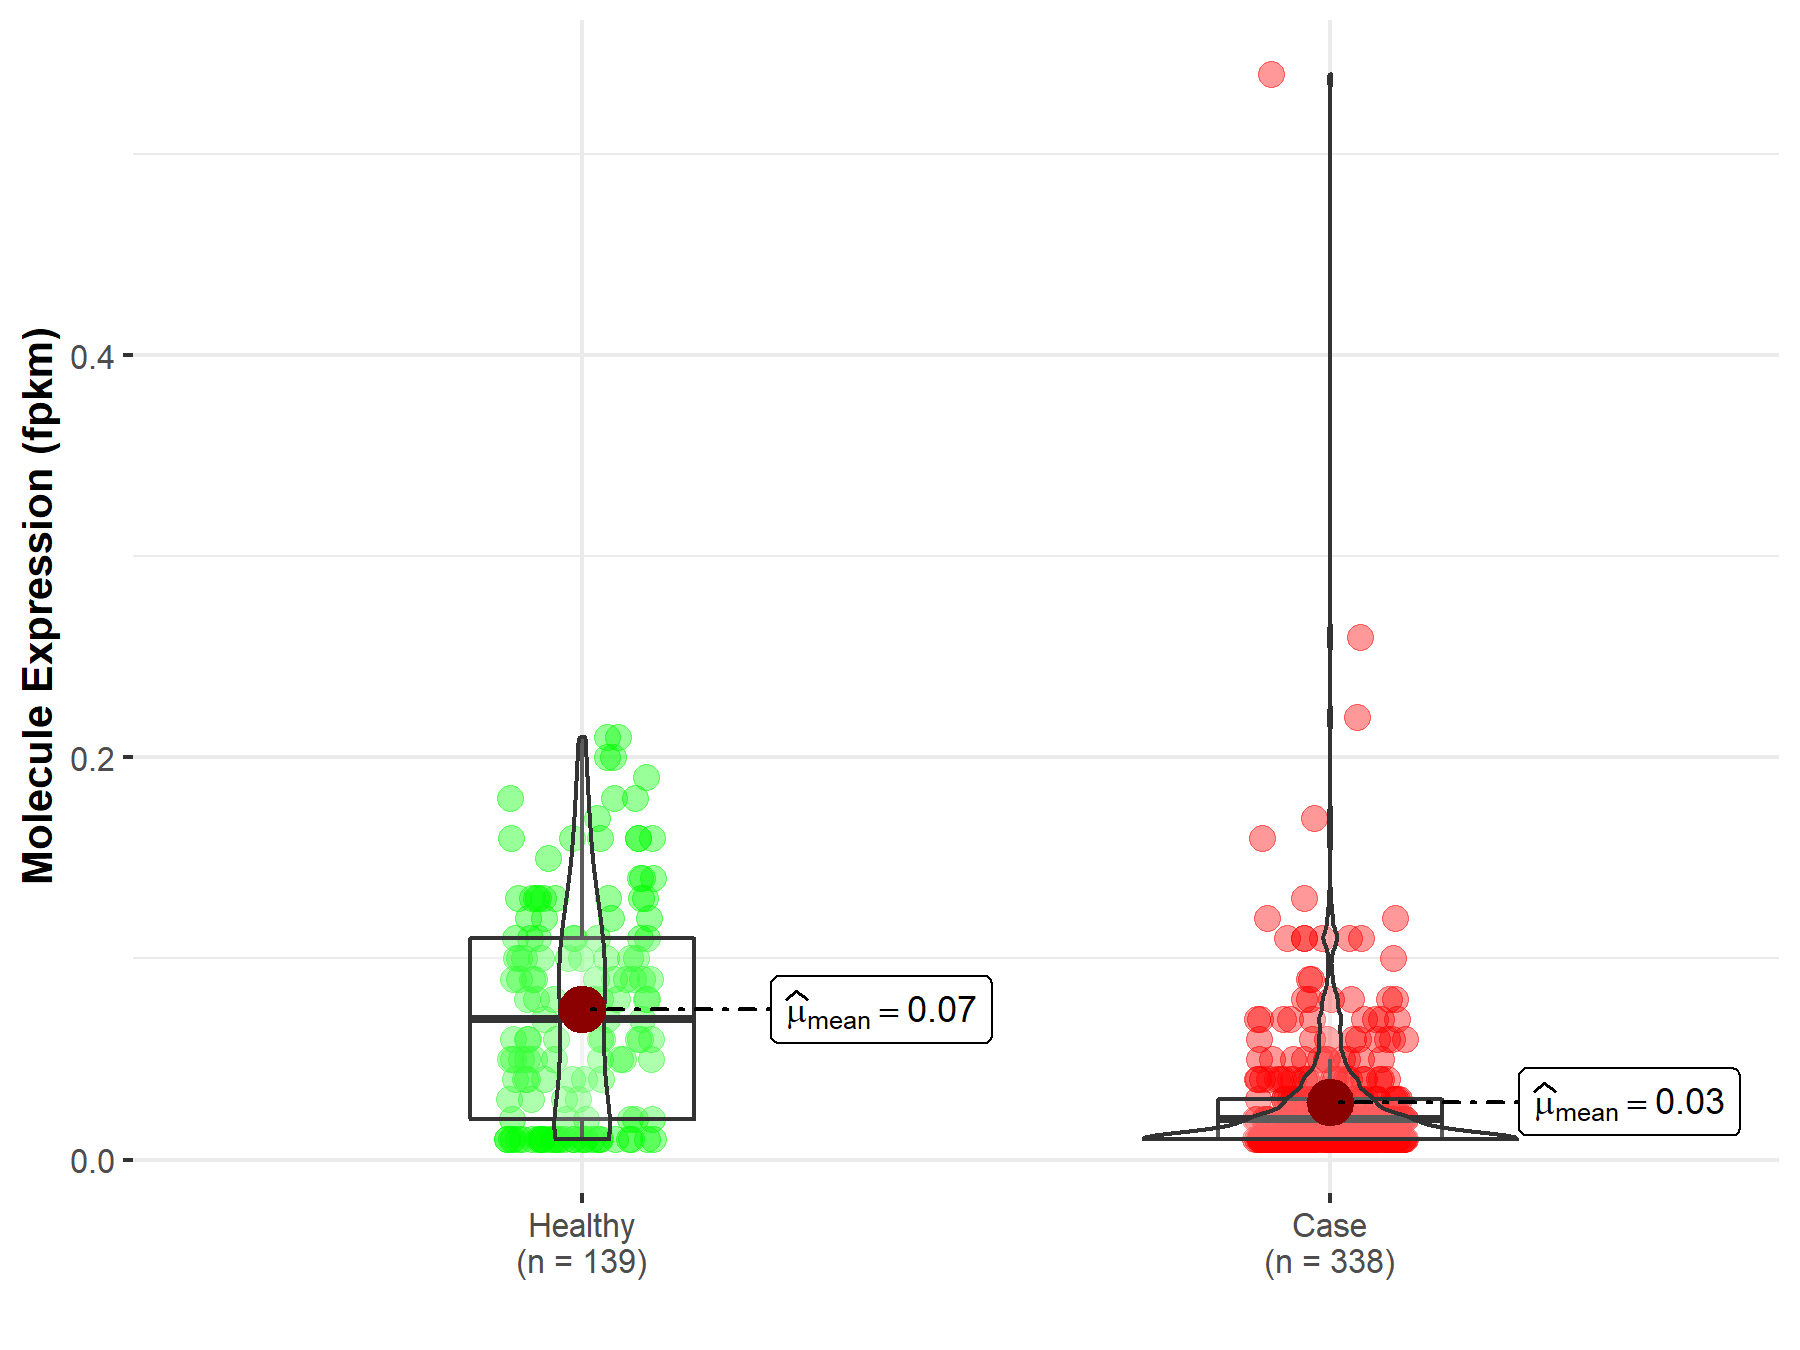
| The Studied Tissue | Liver | |
| The Specified Disease | Liver hepatocellular carcinoma | |
| The Expression Level of Disease Section Compare with the Healthy Individual Tissue | p-value: 6.11E-24; Fold-change: 4.15E-01 | |
|
Molecule expression in the diseased tissue of patients
Molecule expression in the normal tissue of healthy individuals
|
||
| Disease-specific Molecule Abundances |
|
Click to View the Clearer Original Diagram |
Tissue-specific Molecule Abundances in Healthy Individuals

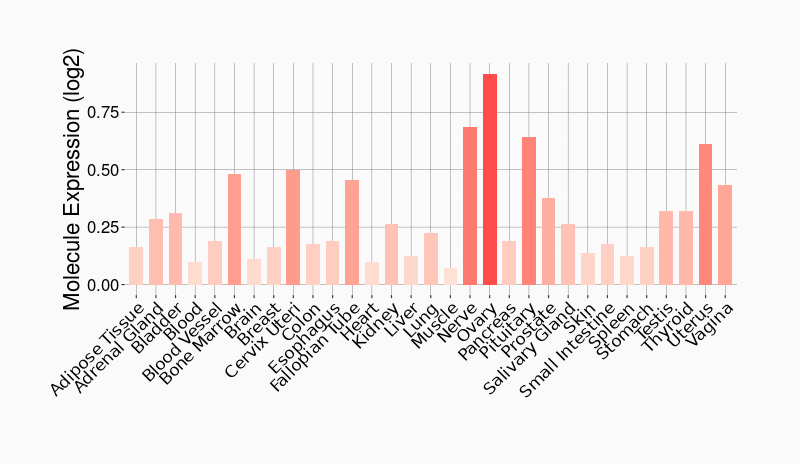
|
||
References
If you find any error in data or bug in web service, please kindly report it to Dr. Sun and Dr. Yu.