Molecule Information
General Information of the Molecule (ID: Mol01298)
| Name |
Prostate cancer associated transcript 1 (PCAT1)
,Homo sapiens
|
||||
|---|---|---|---|---|---|
| Synonyms |
PCAT1
Click to Show/Hide
|
||||
| Molecule Type |
LncRNA
|
||||
| Gene Name |
FLJ20618, LINC00080, NCRNA00080
|
||||
| Gene ID | |||||
| Location |
chr8:126556323-127419050[+]
|
||||
| Ensembl ID | |||||
| HGNC ID | |||||
| Click to Show/Hide the Complete Species Lineage | |||||
Type(s) of Resistant Mechanism of This Molecule
 EADR: Epigenetic Alteration of DNA, RNA or Protein
Drug Resistance Data Categorized by Drug
Approved Drug(s)
2 drug(s) in total
| Drug Sensitivity Data Categorized by Their Corresponding Mechanisms | ||||
|
Epigenetic Alteration of DNA, RNA or Protein (EADR)
|
||||
| Disease Class: Prostate cancer [ICD-11: 2C82.0] | [1] | |||
| Sensitive Disease | Prostate cancer [ICD-11: 2C82.0] | |||
| Sensitive Drug | Olaparib | |||
| Molecule Alteration | Expression | Up-regulation |
||
| Differential expression of the molecule in resistant disease | ||||
| Classification of Disease | Prostate cancer [ICD-11: 2C82] | |||
| The Specified Disease | Prostate adenocarcinoma | |||
| The Studied Tissue | Prostate | |||
| The Expression Level of Disease Section Compare with the Healthy Individual Tissue | p-value: 3.05E-25 Fold-change: 3.43E+00 Z-score: 1.10E+01 |
|||
| Experimental Note | Identified from the Human Clinical Data | |||
| In Vitro Model | DU-145 cells | Prostate | Homo sapiens (Human) | CVCL_0105 |
| LNCaP cells | Prostate | Homo sapiens (Human) | CVCL_0395 | |
| PC3 cells | Prostate | Homo sapiens (Human) | CVCL_0035 | |
| RWPE cells | Prostate | Homo sapiens (Human) | CVCL_1736 | |
| In Vivo Model | SCID nude mouse xenograft model | Mus musculus | ||
| Experiment for Molecule Alteration |
qPCR | |||
| Experiment for Drug Resistance |
WST assay | |||
| Mechanism Description | PCAT-1 expressing cells exhibit a BRCA-like phenotype, resulting in cell sensitization to PARP1 inhibitors. In human prostate cancer tissues, high PCAT-1 expression predicts for low BRCA2 expression, supporting our observations in model systems. | |||
| Drug Sensitivity Data Categorized by Their Corresponding Mechanisms | ||||
|
Epigenetic Alteration of DNA, RNA or Protein (EADR)
|
||||
| Disease Class: Esophageal cancer [ICD-11: 2B70.1] | [2] | |||
| Sensitive Disease | Esophageal cancer [ICD-11: 2B70.1] | |||
| Sensitive Drug | Cisplatin | |||
| Molecule Alteration | Expression | Up-regulation |
||
| Differential expression of the molecule in resistant disease | ||||
| Classification of Disease | Esophageal cancer [ICD-11: 2B70] | |||
| The Specified Disease | Esophageal carcinoma | |||
| The Studied Tissue | Esophagus | |||
| The Expression Level of Disease Section Compare with the Healthy Individual Tissue | p-value: 2.94E-15 Fold-change: 2.36E+00 Z-score: 8.64E+00 |
|||
| Experimental Note | Identified from the Human Clinical Data | |||
| Cell Pathway Regulation | Cell invasion | Activation | hsa05200 | |
| Cell proliferation | Activation | hsa05200 | ||
| In Vitro Model | ECA-109 cells | Esophagus | Homo sapiens (Human) | CVCL_6898 |
| KYSE30 cells | Esophagus | Homo sapiens (Human) | CVCL_1351 | |
| kYSE450 cells | Esophagus | Homo sapiens (Human) | CVCL_1353 | |
| In Vivo Model | Nude mouse xenograft model | Mus musculus | ||
| Experiment for Molecule Alteration |
RT-PCR | |||
| Experiment for Drug Resistance |
MTT assay | |||
| Mechanism Description | Overexpression of PCAT-1 increased the proliferation rate and growth of OC cells. Inhibition of PCAT-1 decreased proliferation and growth of OC cells, and increased cisplatin chemosensitivity. PCAT-1 promotes development of OC and represses the chemoresistance of OC to cisplatin. | |||
Clinical Trial Drug(s)
1 drug(s) in total
| Drug Sensitivity Data Categorized by Their Corresponding Mechanisms | ||||
|
Epigenetic Alteration of DNA, RNA or Protein (EADR)
|
||||
| Disease Class: Prostate cancer [ICD-11: 2C82.0] | [1] | |||
| Sensitive Disease | Prostate cancer [ICD-11: 2C82.0] | |||
| Sensitive Drug | Veliparib dihydrochloride | |||
| Molecule Alteration | Expression | Up-regulation |
||
| Experimental Note | Identified from the Human Clinical Data | |||
| In Vitro Model | DU-145 cells | Prostate | Homo sapiens (Human) | CVCL_0105 |
| LNCaP cells | Prostate | Homo sapiens (Human) | CVCL_0395 | |
| PC3 cells | Prostate | Homo sapiens (Human) | CVCL_0035 | |
| RWPE cells | Prostate | Homo sapiens (Human) | CVCL_1736 | |
| In Vivo Model | SCID nude mouse xenograft model | Mus musculus | ||
| Experiment for Molecule Alteration |
qPCR | |||
| Experiment for Drug Resistance |
WST assay | |||
| Mechanism Description | PCAT-1 expressing cells exhibit a BRCA-like phenotype, resulting in cell sensitization to PARP1 inhibitors. In human prostate cancer tissues, high PCAT-1 expression predicts for low BRCA2 expression, supporting our observations in model systems. | |||
Disease- and Tissue-specific Abundances of This Molecule
ICD Disease Classification 02

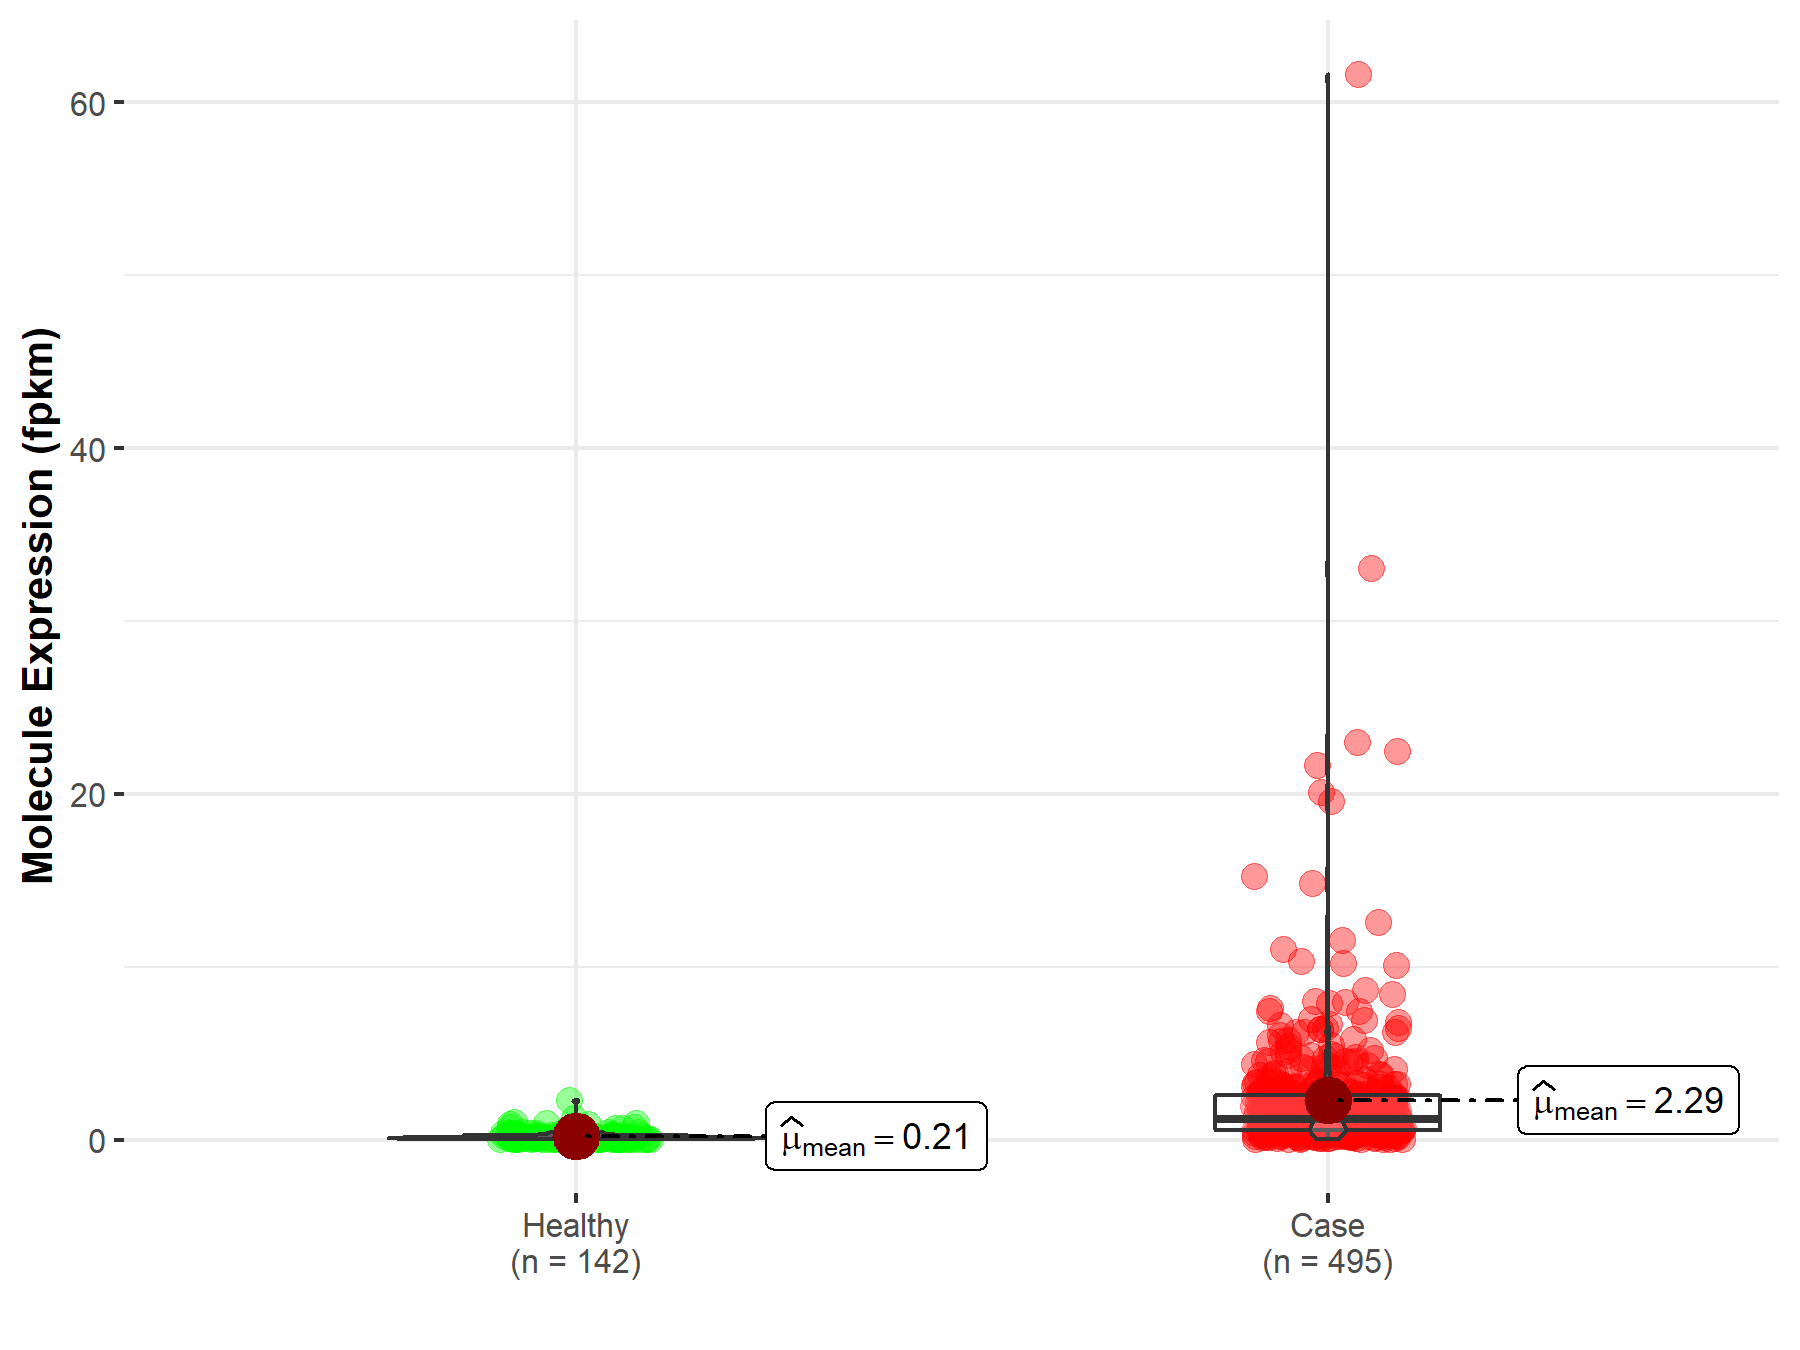
| Differential expression of molecule in resistant diseases | ||
| The Studied Tissue | Esophagus | |
| The Specified Disease | Esophageal carcinoma | |
| The Expression Level of Disease Section Compare with the Healthy Individual Tissue | p-value: 1.21E-61; Fold-change: -6.23E-01 | |
|
Molecule expression in the diseased tissue of patients
Molecule expression in the normal tissue of healthy individuals
|
||
| Disease-specific Molecule Abundances |
|
Click to View the Clearer Original Diagram |
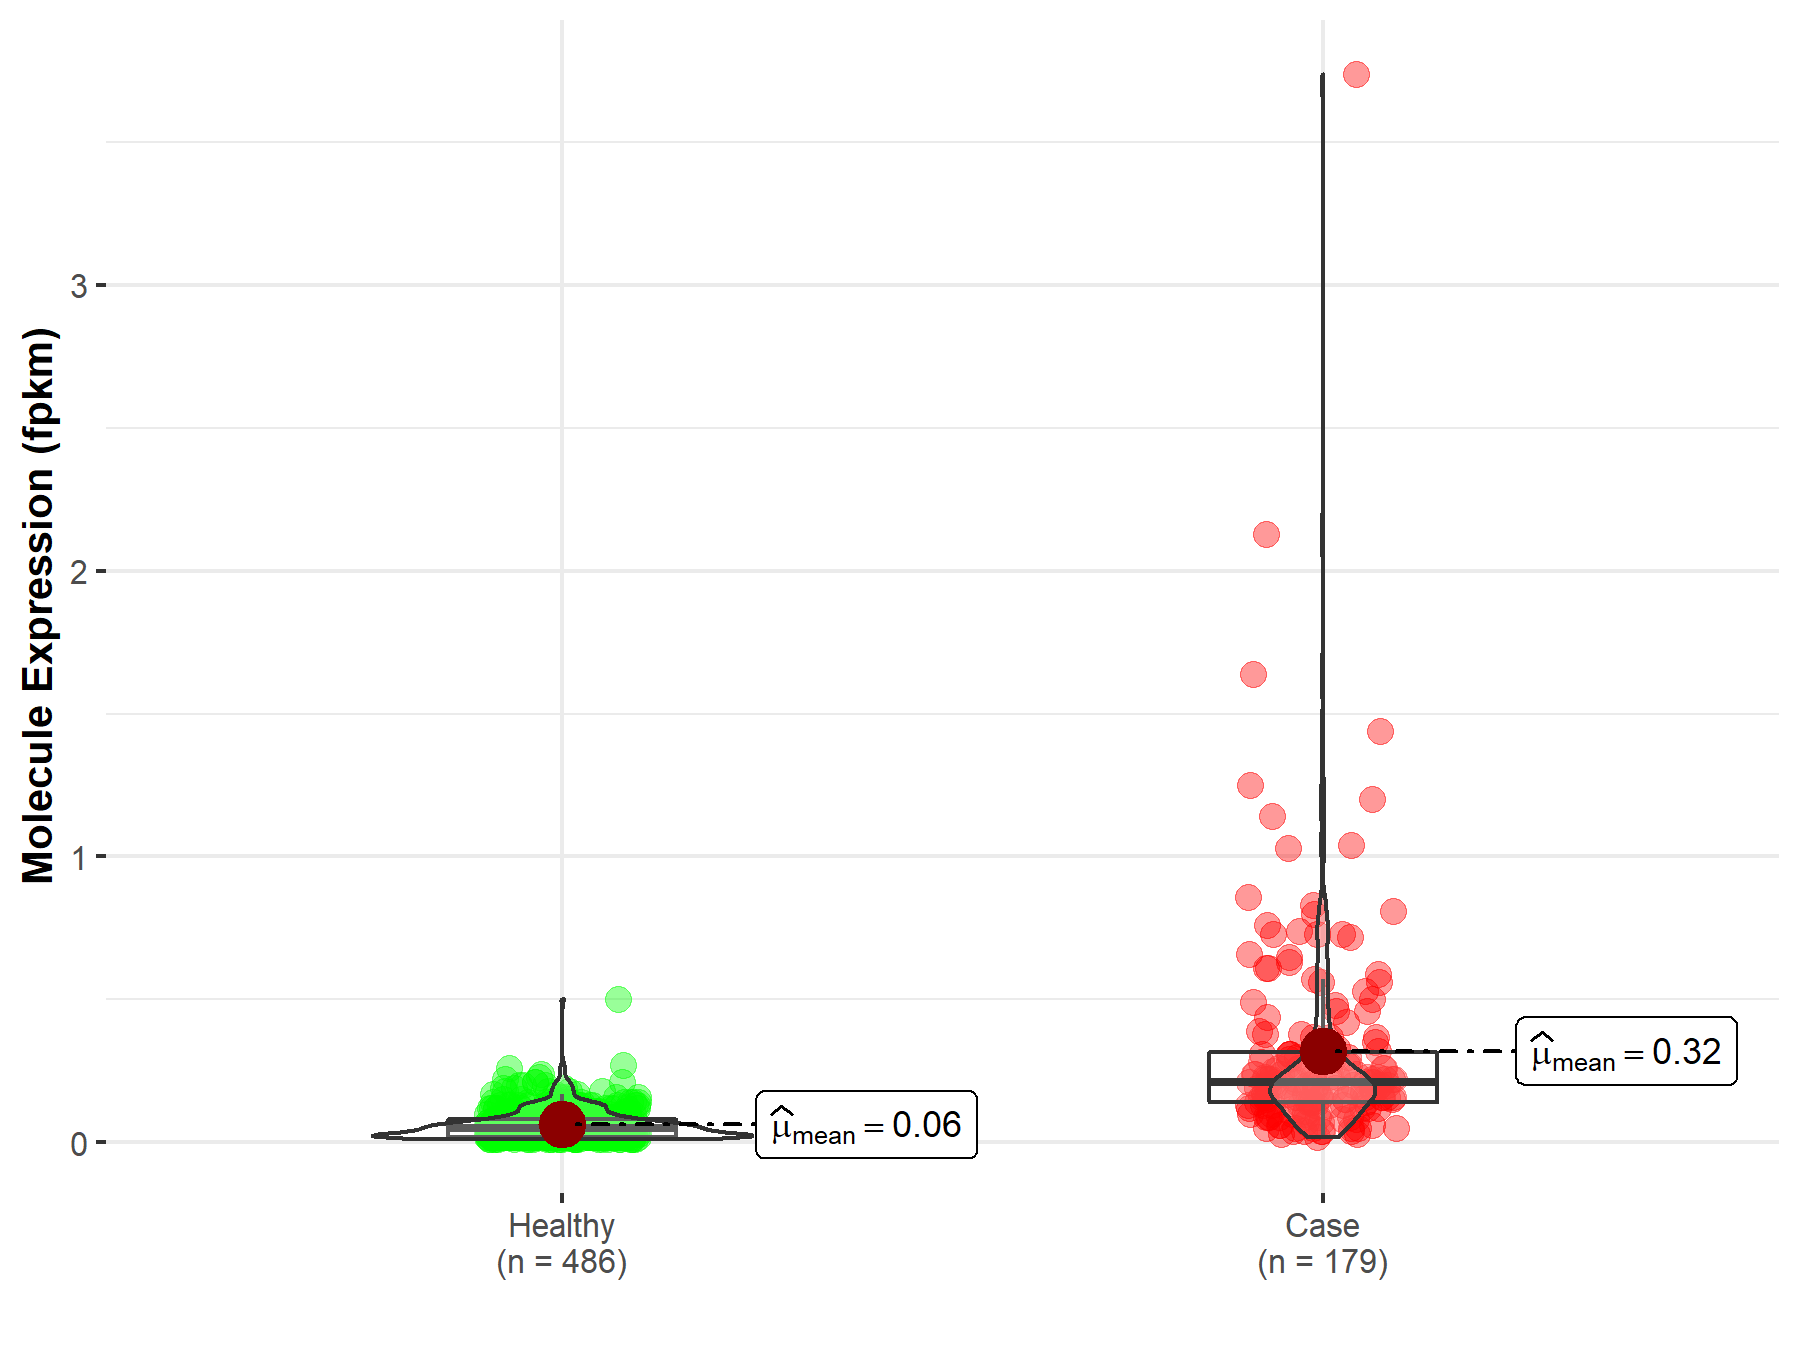
| Differential expression of molecule in resistant diseases | ||
| The Studied Tissue | Prostate | |
| The Specified Disease | Prostate adenocarcinoma | |
| The Expression Level of Disease Section Compare with the Healthy Individual Tissue | p-value: 3.43E-38; Fold-change: -7.24E-01 | |
|
Molecule expression in the diseased tissue of patients
Molecule expression in the normal tissue of healthy individuals
|
||
| Disease-specific Molecule Abundances |
|
Click to View the Clearer Original Diagram |
Tissue-specific Molecule Abundances in Healthy Individuals


|
||
References
If you find any error in data or bug in web service, please kindly report it to Dr. Sun and Dr. Yu.