Molecule Information
General Information of the Molecule (ID: Mol01290)
| Name |
NNT antisense RNA 1 (NNT-AS1)
,Homo sapiens
|
||||
|---|---|---|---|---|---|
| Synonyms |
NNT-AS1
Click to Show/Hide
|
||||
| Molecule Type |
LncRNA
|
||||
| Gene ID | |||||
| Location |
chr5:43571594-43603230[-]
|
||||
| Ensembl ID | |||||
| HGNC ID | |||||
| Click to Show/Hide the Complete Species Lineage | |||||
Type(s) of Resistant Mechanism of This Molecule
 EADR: Epigenetic Alteration of DNA, RNA or Protein
Drug Resistance Data Categorized by Drug
Approved Drug(s)
1 drug(s) in total
| Drug Sensitivity Data Categorized by Their Corresponding Mechanisms | ||||
|
Epigenetic Alteration of DNA, RNA or Protein (EADR)
|
||||
| Disease Class: Non-small cell lung cancer [ICD-11: 2C25.Y] | [1] | |||
| Sensitive Disease | Non-small cell lung cancer [ICD-11: 2C25.Y] | |||
| Sensitive Drug | Cisplatin | |||
| Molecule Alteration | Expression | Down-regulation |
||
| Experimental Note | Identified from the Human Clinical Data | |||
| Cell Pathway Regulation | Cell apoptosis | Activation | hsa04210 | |
| Cell colony | Inhibition | hsa05200 | ||
| Cell proliferation | Inhibition | hsa05200 | ||
| MAPK/Slug signaling pathway | Regulation | N.A. | ||
| In Vitro Model | A549 cells | Lung | Homo sapiens (Human) | CVCL_0023 |
| SPC-A1 cells | Lung | Homo sapiens (Human) | CVCL_6955 | |
| Experiment for Molecule Alteration |
qRT-PCR | |||
| Experiment for Drug Resistance |
MTT assay; Flow cytometry assay | |||
| Mechanism Description | LncRNA NNT-AS1 is a major mediator of cisplatin chemoresistance in non-small cell lung cancer through MAPk/Slug pathway. | |||
Disease- and Tissue-specific Abundances of This Molecule
ICD Disease Classification 02

| Differential expression of molecule in resistant diseases | ||
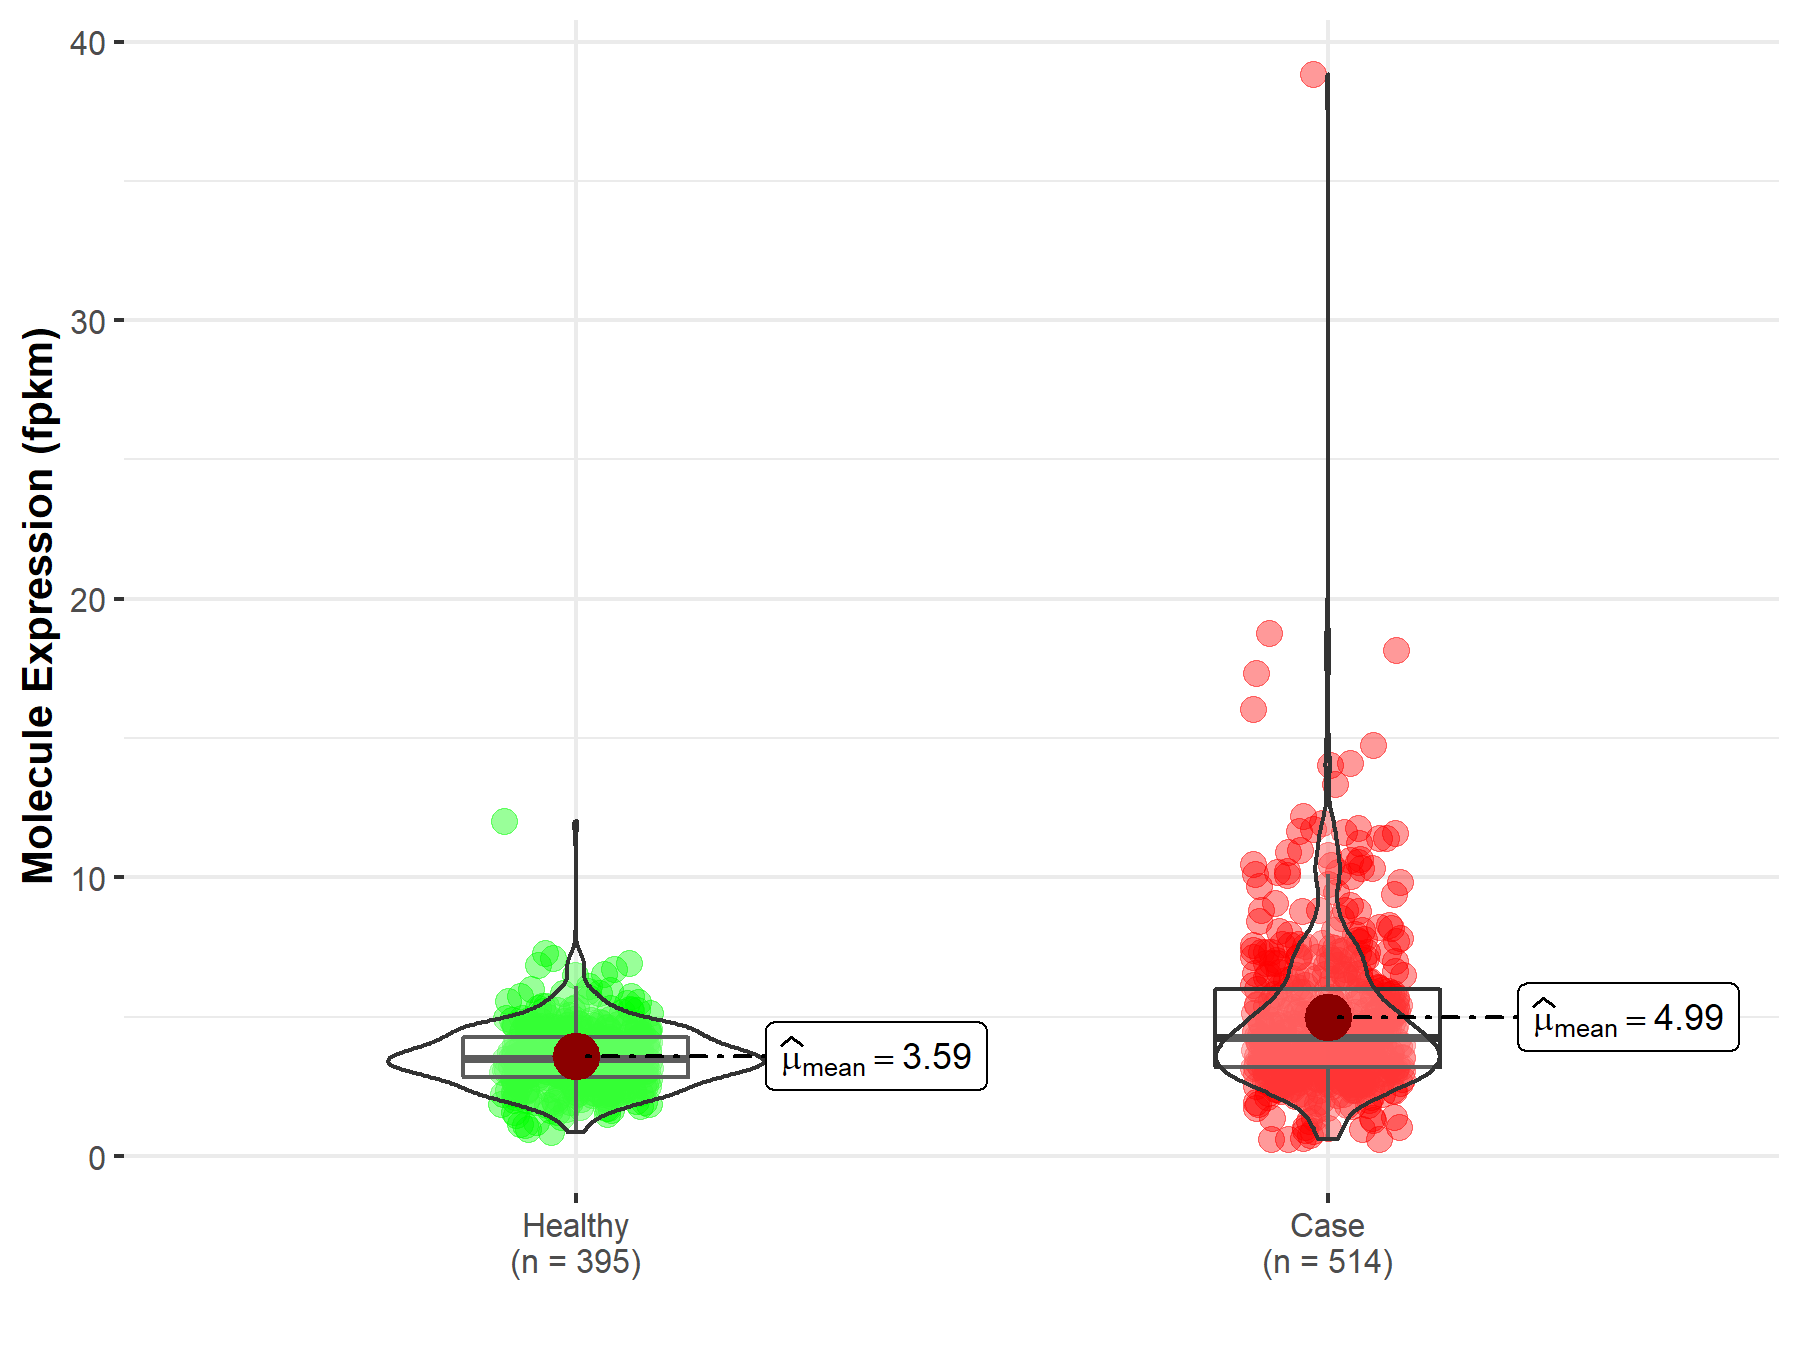
| The Studied Tissue | Lung | |
| The Specified Disease | Lung adenocarcinoma | |
| The Expression Level of Disease Section Compare with the Healthy Individual Tissue | p-value: 4.57E-17; Fold-change: -5.58E-02 | |
|
Molecule expression in the diseased tissue of patients
Molecule expression in the normal tissue of healthy individuals
|
||
| Disease-specific Molecule Abundances |
|
Click to View the Clearer Original Diagram |
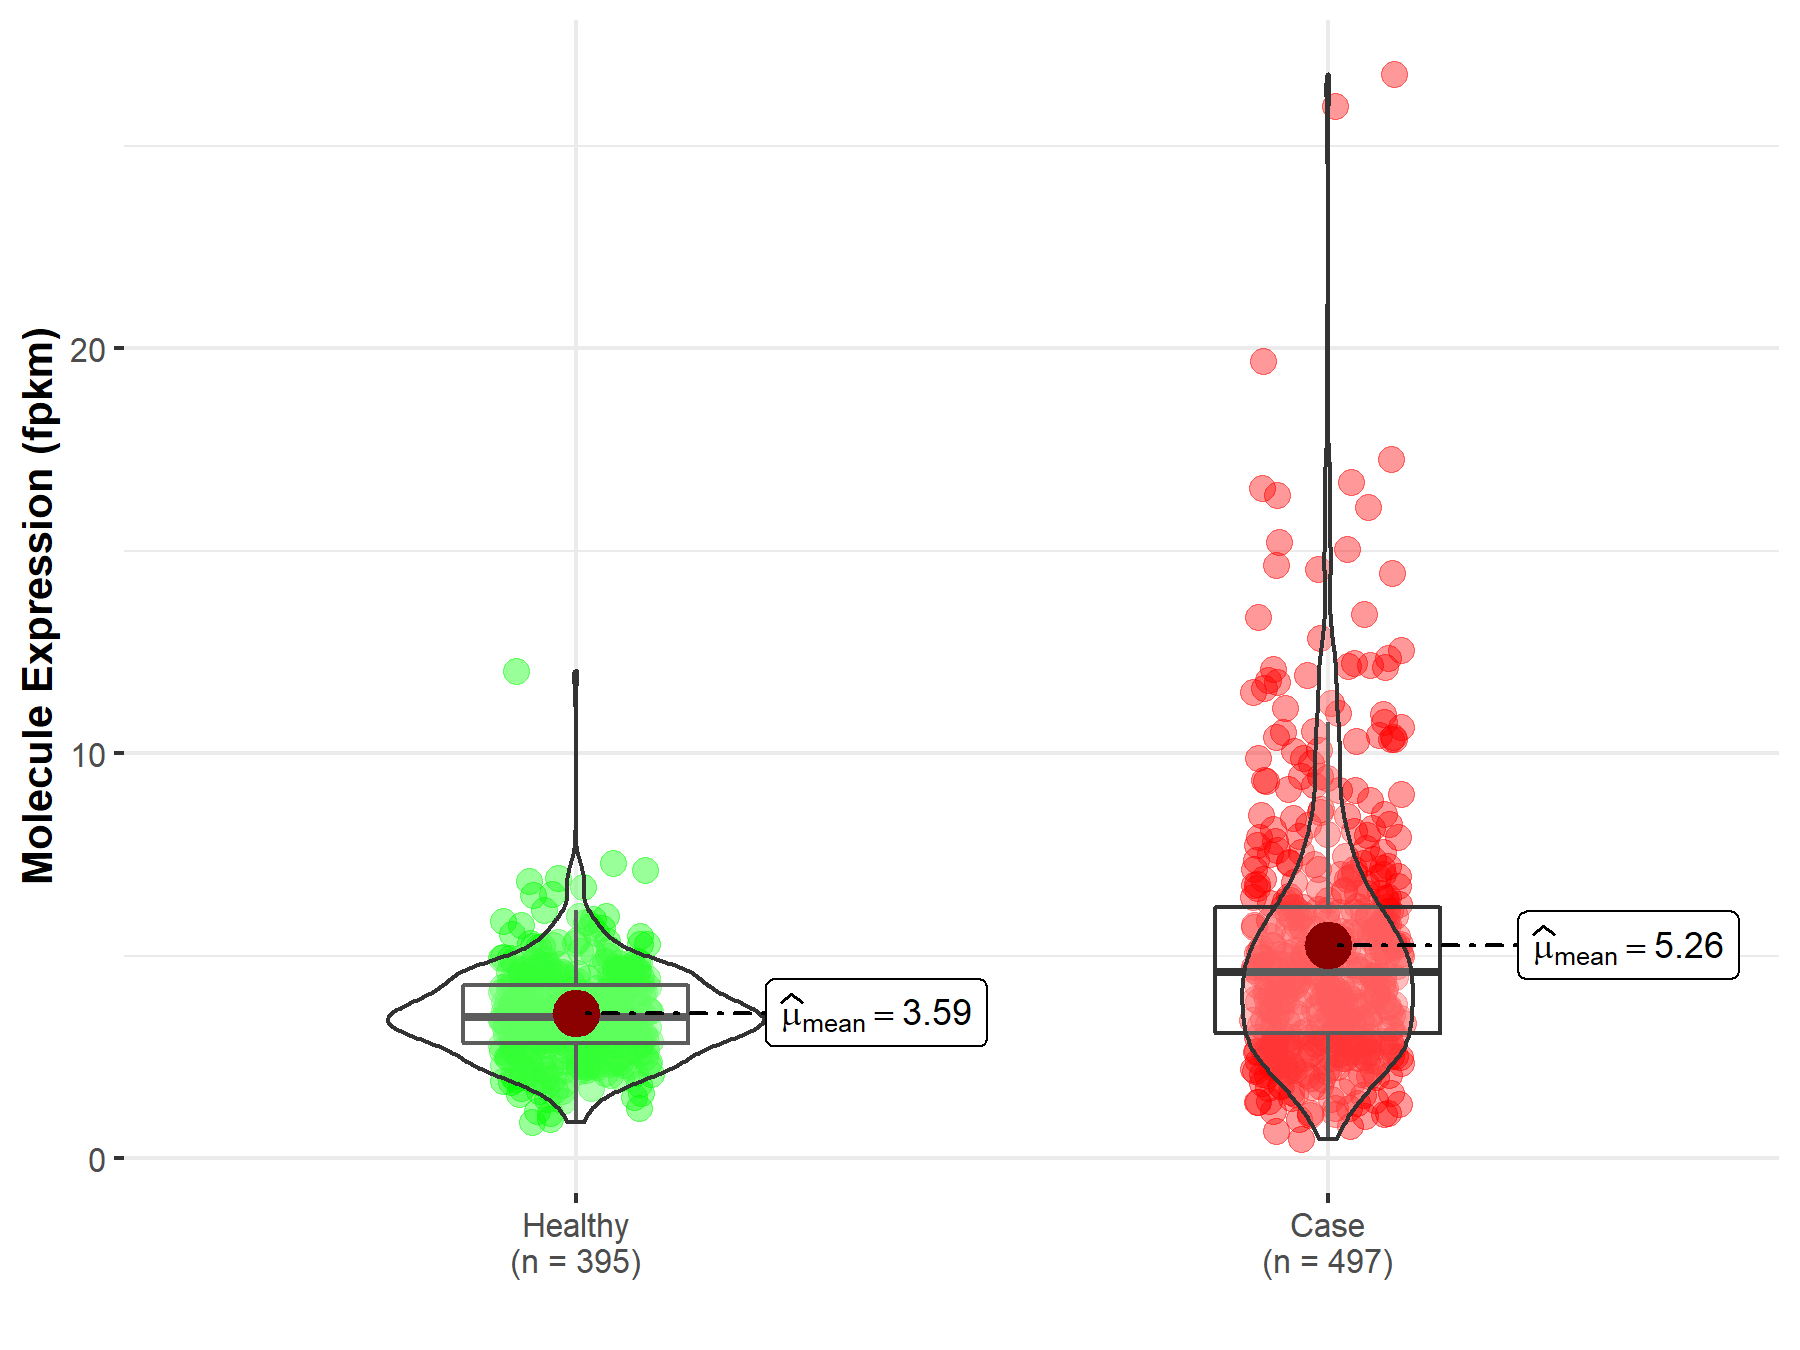
| The Studied Tissue | Lung | |
| The Specified Disease | Lung squamous cell carcinoma | |
| The Expression Level of Disease Section Compare with the Healthy Individual Tissue | p-value: 2.71E-18; Fold-change: -6.24E-02 | |
|
Molecule expression in the diseased tissue of patients
Molecule expression in the normal tissue of healthy individuals
|
||
| Disease-specific Molecule Abundances |
|
Click to View the Clearer Original Diagram |
Tissue-specific Molecule Abundances in Healthy Individuals

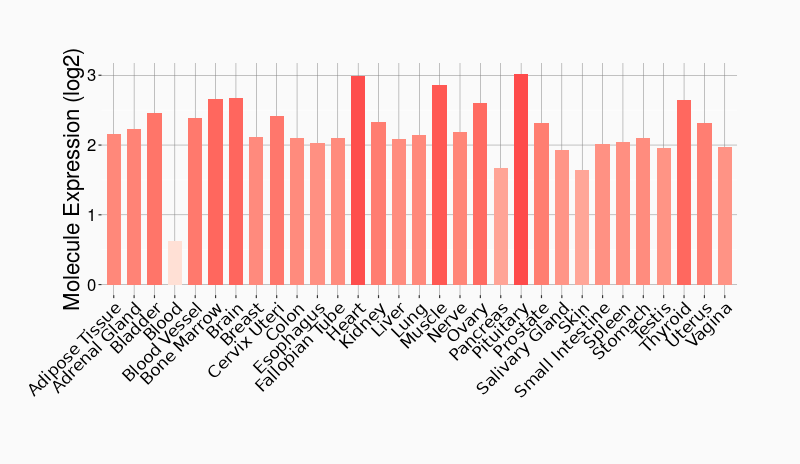
|
||
References
If you find any error in data or bug in web service, please kindly report it to Dr. Sun and Dr. Yu.