Molecule Information
General Information of the Molecule (ID: Mol01276)
| Name |
HOXA11 antisense RNA (HOXA11-AS)
,Homo sapiens
|
||||
|---|---|---|---|---|---|
| Synonyms |
HOXA11-AS
Click to Show/Hide
|
||||
| Molecule Type |
LncRNA
|
||||
| Gene Name |
ANRIL, CDKN2B-AS, CDKN2BAS, NCRNA00089, PCAT12, RP11-145E5.4, p15AS
|
||||
| Gene ID | |||||
| Location |
chr7:27184507-27189298[+]
|
||||
| Ensembl ID | |||||
| HGNC ID | |||||
| Click to Show/Hide the Complete Species Lineage | |||||
Type(s) of Resistant Mechanism of This Molecule
 RTDM: Regulation by the Disease Microenvironment
Drug Resistance Data Categorized by Drug
Approved Drug(s)
1 drug(s) in total
| Drug Resistance Data Categorized by Their Corresponding Mechanisms | ||||
|
Regulation by the Disease Microenvironment (RTDM)
|
||||
| Disease Class: Lung adenocarcinoma [ICD-11: 2C25.0] | [1] | |||
| Resistant Disease | Lung adenocarcinoma [ICD-11: 2C25.0] | |||
| Resistant Drug | Cisplatin | |||
| Molecule Alteration | Expression | Up-regulation |
||
| Differential expression of the molecule in resistant disease | ||||
| Classification of Disease | Lung cancer [ICD-11: 2C25] | |||
| The Specified Disease | Lung adenocarcinoma | |||
| The Studied Tissue | Lung | |||
| The Expression Level of Disease Section Compare with the Healthy Individual Tissue | p-value: 2.51E-07 Fold-change: 3.00E+00 Z-score: 5.26E+00 |
|||
| Experimental Note | Revealed Based on the Cell Line Data | |||
| Cell Pathway Regulation | Cell apoptosis | Inhibition | hsa04210 | |
| Cell colony | Activation | hsa05200 | ||
| Cell invasion | Activation | hsa05200 | ||
| Cell viability | Activation | hsa05200 | ||
| In Vitro Model | A549 cells | Lung | Homo sapiens (Human) | CVCL_0023 |
| H157 cells | Lung | Homo sapiens (Human) | CVCL_2458 | |
| Experiment for Molecule Alteration |
qRT-PCR | |||
| Experiment for Drug Resistance |
MTT assay; Flow cytometry assay | |||
| Mechanism Description | LncRNA HOXA11-AS drives cisplatin resistance of human LUAD cells via upregulating Stat3 by sequestering miR-454-3p. | |||
Disease- and Tissue-specific Abundances of This Molecule
ICD Disease Classification 02

| Differential expression of molecule in resistant diseases | ||
| The Studied Tissue | Lung | |
| The Specified Disease | Lung adenocarcinoma | |
| The Expression Level of Disease Section Compare with the Healthy Individual Tissue | p-value: 3.94E-08; Fold-change: -6.35E-01 | |
|
Molecule expression in the diseased tissue of patients
Molecule expression in the normal tissue of healthy individuals
|
||
| Disease-specific Molecule Abundances |
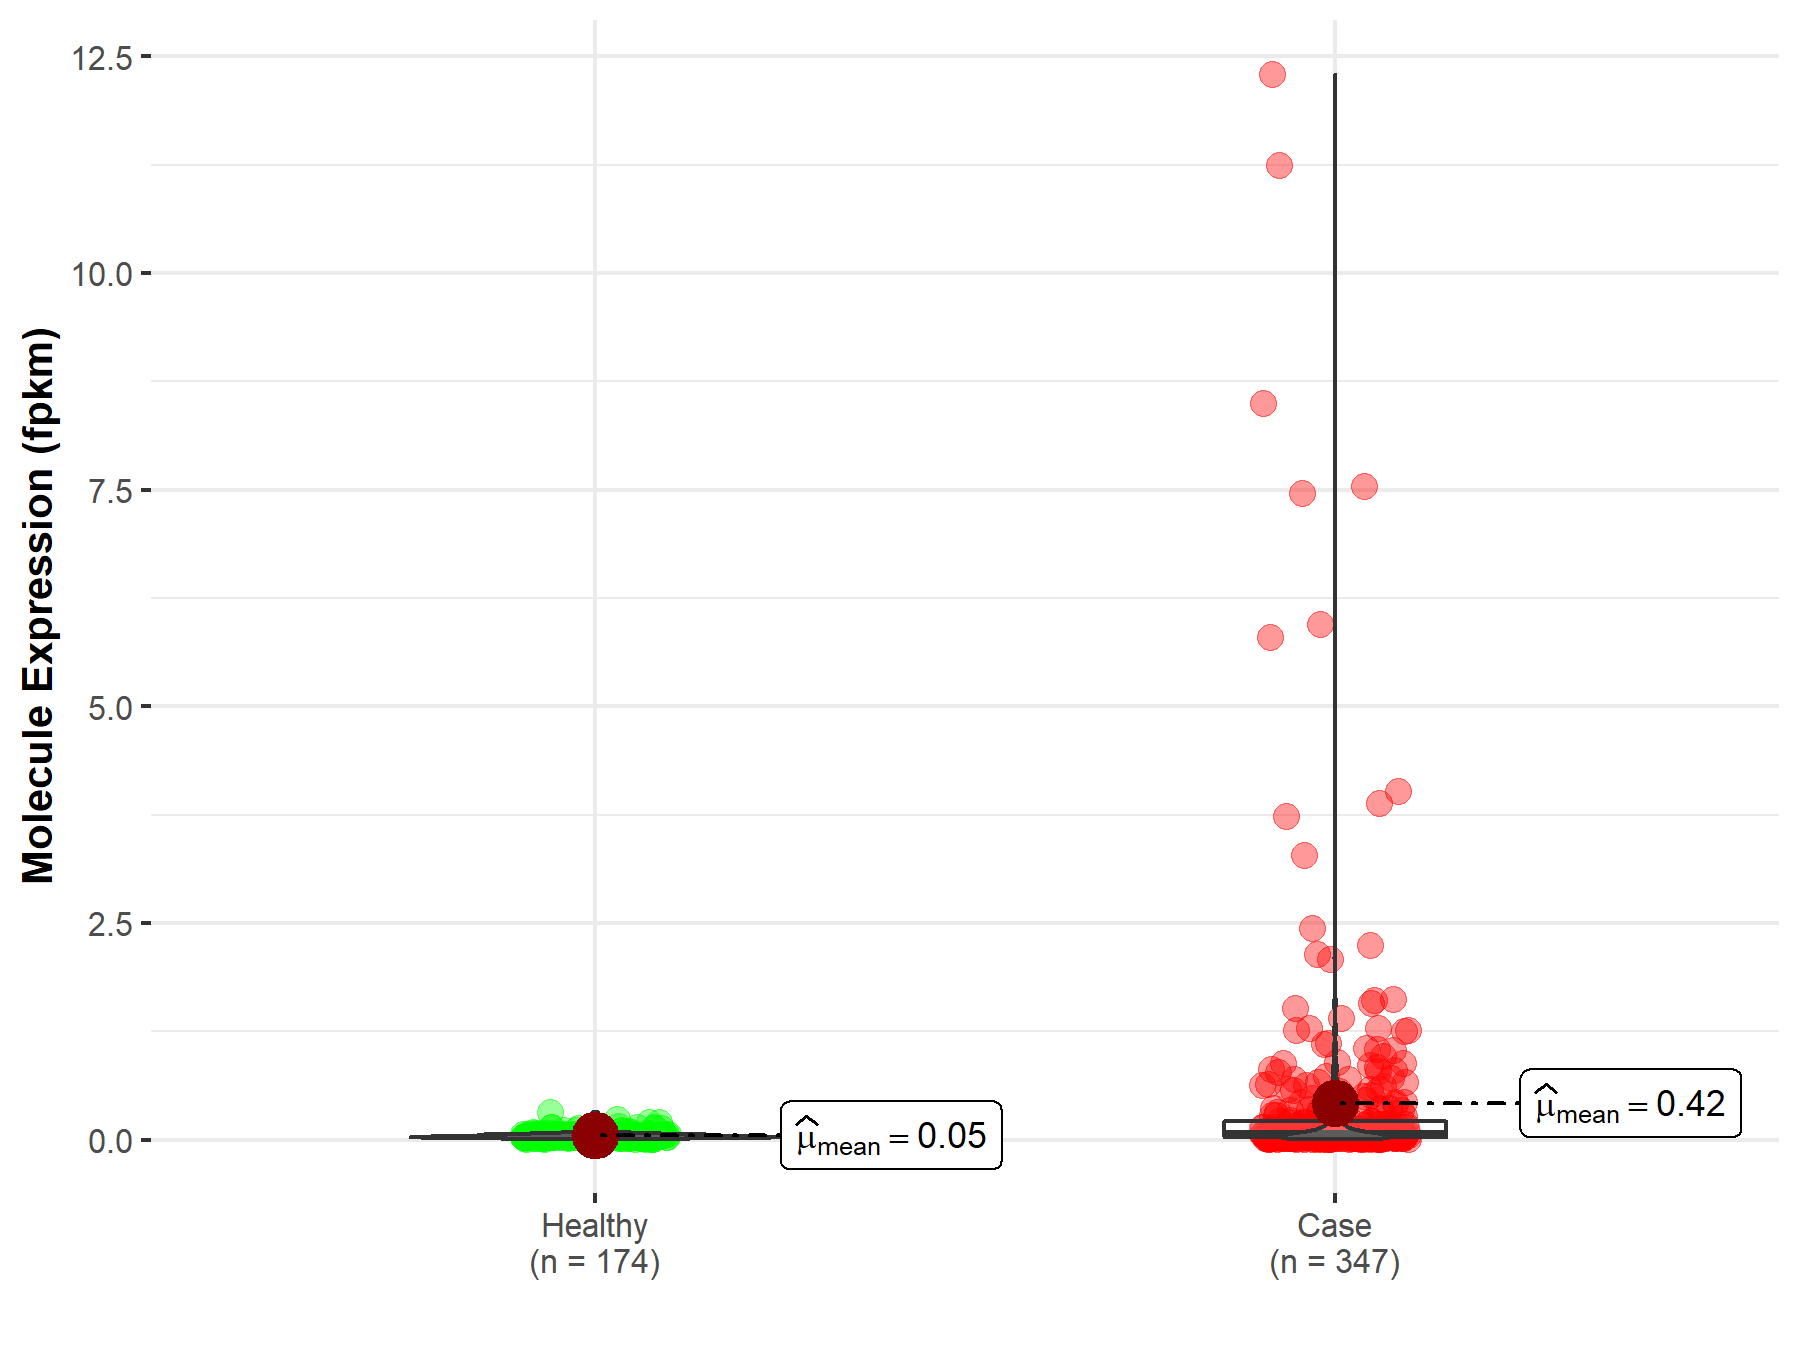
|
Click to View the Clearer Original Diagram |
| The Studied Tissue | Lung | |
| The Specified Disease | Lung squamous cell carcinoma | |
| The Expression Level of Disease Section Compare with the Healthy Individual Tissue | p-value: 7.22E-27; Fold-change: -9.91E-01 | |
|
Molecule expression in the diseased tissue of patients
Molecule expression in the normal tissue of healthy individuals
|
||
| Disease-specific Molecule Abundances |
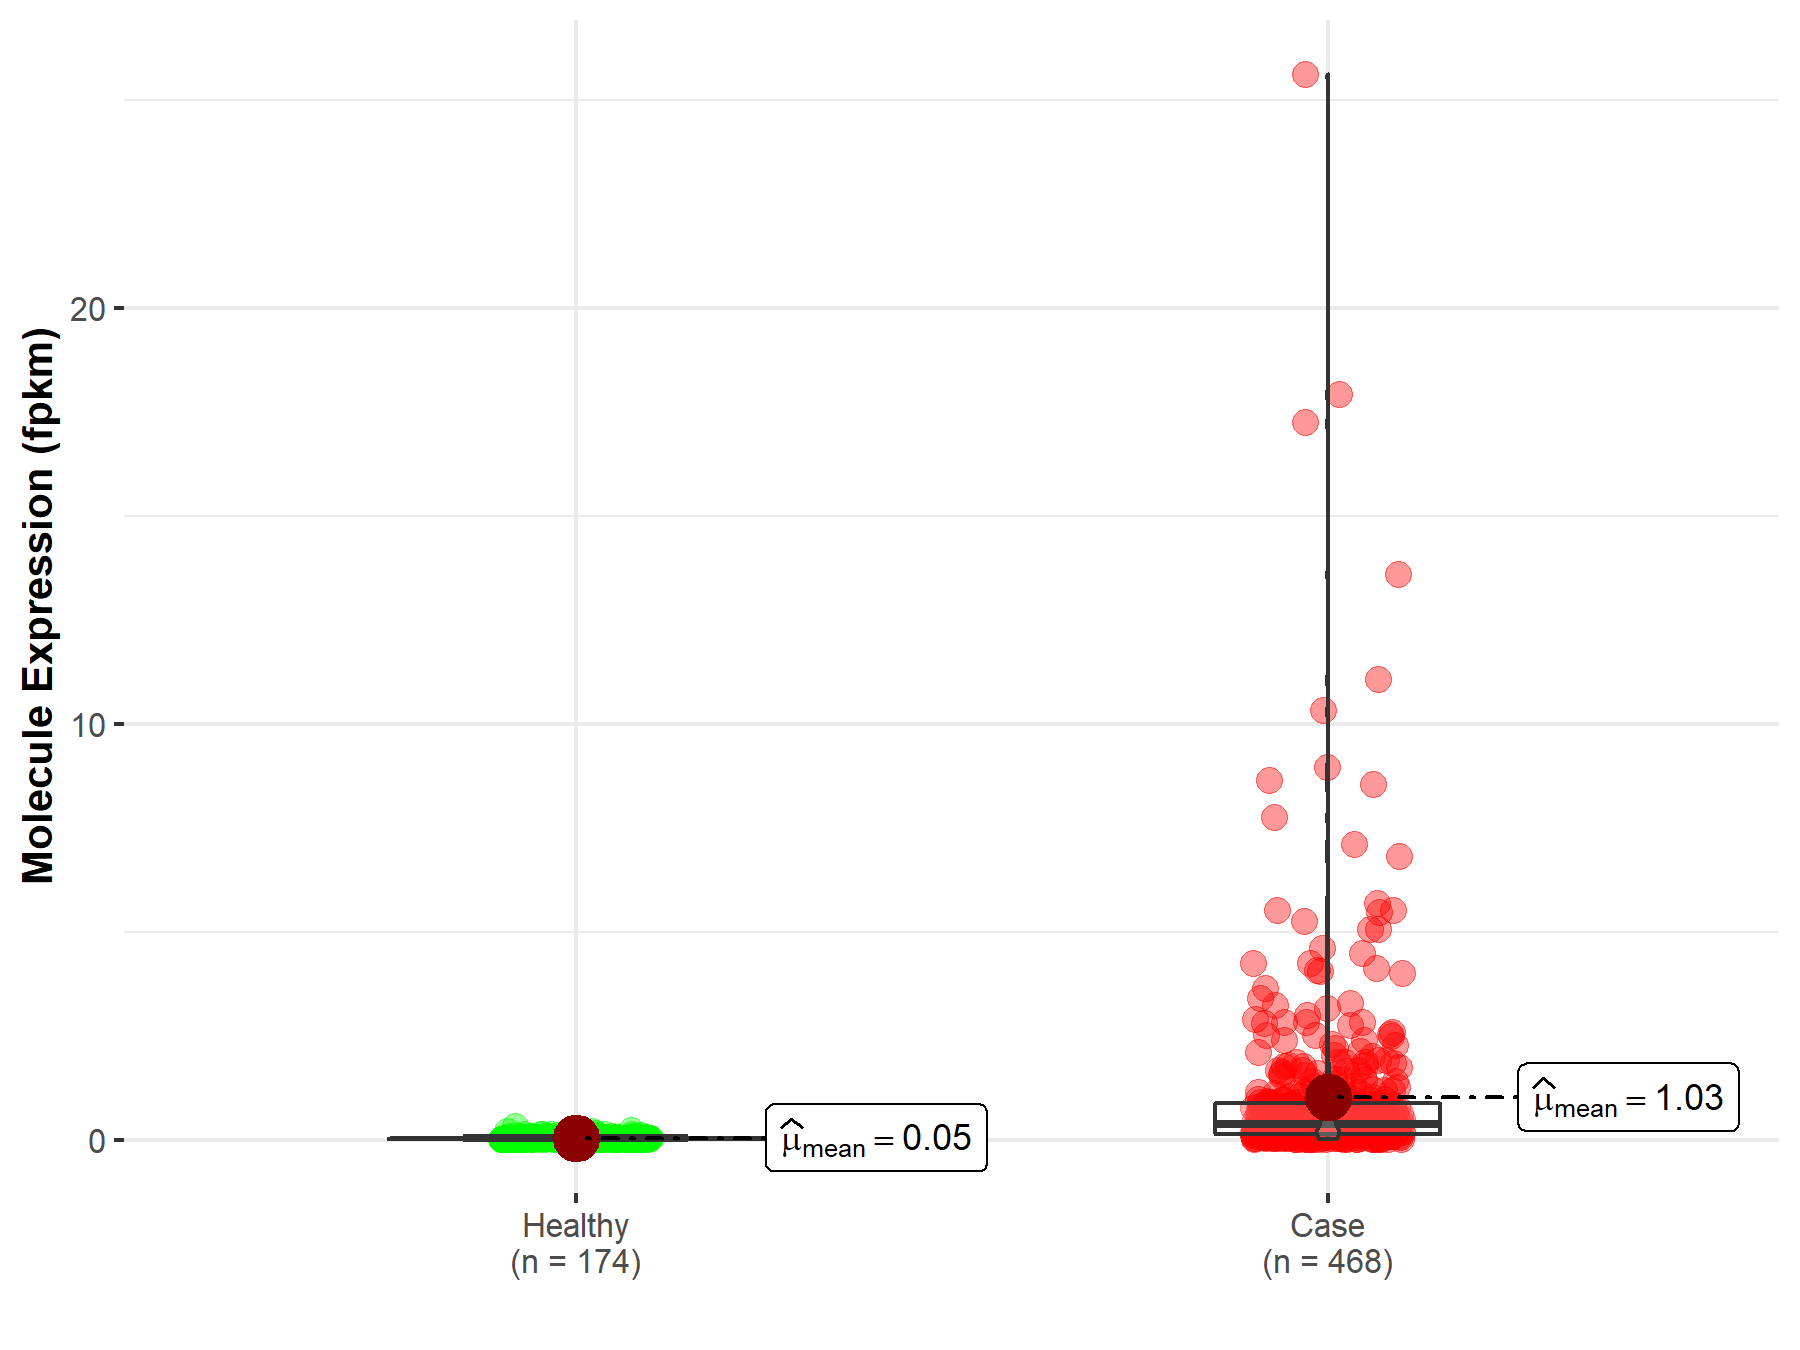
|
Click to View the Clearer Original Diagram |
Tissue-specific Molecule Abundances in Healthy Individuals

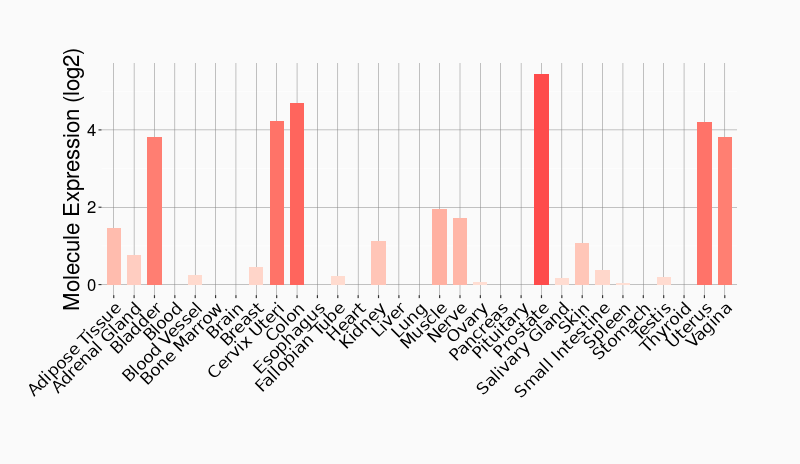
|
||
References
If you find any error in data or bug in web service, please kindly report it to Dr. Sun and Dr. Yu.