Molecule Information
General Information of the Molecule (ID: Mol01253)
| Name |
TRPM2 antisense RNA (TRPM2-AS)
,Homo sapiens
|
||||
|---|---|---|---|---|---|
| Synonyms |
TRPM2-AS
Click to Show/Hide
|
||||
| Molecule Type |
LncRNA
|
||||
| Gene Name |
DXS1089, DXS399E, LINC00001, NCRNA00001, swd66
|
||||
| Gene ID | |||||
| Location |
chr21:44414588-44425272[-]
|
||||
| Ensembl ID | |||||
| HGNC ID | |||||
| Click to Show/Hide the Complete Species Lineage | |||||
Type(s) of Resistant Mechanism of This Molecule
 EADR: Epigenetic Alteration of DNA, RNA or Protein
Drug Resistance Data Categorized by Drug
Approved Drug(s)
2 drug(s) in total
| Drug Sensitivity Data Categorized by Their Corresponding Mechanisms | ||||
|
Epigenetic Alteration of DNA, RNA or Protein (EADR)
|
||||
| Disease Class: Non-small cell lung cancer [ICD-11: 2C25.Y] | [1] | |||
| Sensitive Disease | Non-small cell lung cancer [ICD-11: 2C25.Y] | |||
| Sensitive Drug | Cisplatin | |||
| Molecule Alteration | Expression | Down-regulation |
||
| Experimental Note | Revealed Based on the Cell Line Data | |||
| Cell Pathway Regulation | Cell apoptosis | Activation | hsa04210 | |
| p53/p66shc signaling pathway | Activation | hsa04115 | ||
| In Vitro Model | A549 cells | Lung | Homo sapiens (Human) | CVCL_0023 |
| A549/DDP cells | Lung | Homo sapiens (Human) | CVCL_0023 | |
| Experiment for Molecule Alteration |
qRT-PCR | |||
| Experiment for Drug Resistance |
CCK8 assay; Flow cytometric analysis | |||
| Mechanism Description | Downregulated long non-coding RNA TRPM2-AS inhibits cisplatin resistance of non-small cell lung cancer cells via activation of p53- p66shc pathway. | |||
| Drug Resistance Data Categorized by Their Corresponding Mechanisms | ||||
|
Epigenetic Alteration of DNA, RNA or Protein (EADR)
|
||||
| Disease Class: Glioblastoma [ICD-11: 2A00.02] | [2] | |||
| Resistant Disease | Glioblastoma [ICD-11: 2A00.02] | |||
| Resistant Drug | Temozolomide | |||
| Molecule Alteration | Expression | Up-regulation |
||
| Experimental Note | Revealed Based on the Cell Line Data | |||
| In Vitro Model | U87MG cells | Brain | Homo sapiens (Human) | CVCL_GP63 |
| In Vivo Model | Glioblastoma patients | Homo sapiens | ||
| Experiment for Molecule Alteration |
Western blot | |||
| Experiment for Drug Resistance |
Cell proliferation assay; Neurite outgrowth assay | |||
| Mechanism Description | Hypoxia promotes temozolomide resistance in glioblastoma cells via ROS- mediated up-regulation of TRPM2 | |||
Disease- and Tissue-specific Abundances of This Molecule
ICD Disease Classification 02

| Differential expression of molecule in resistant diseases | ||
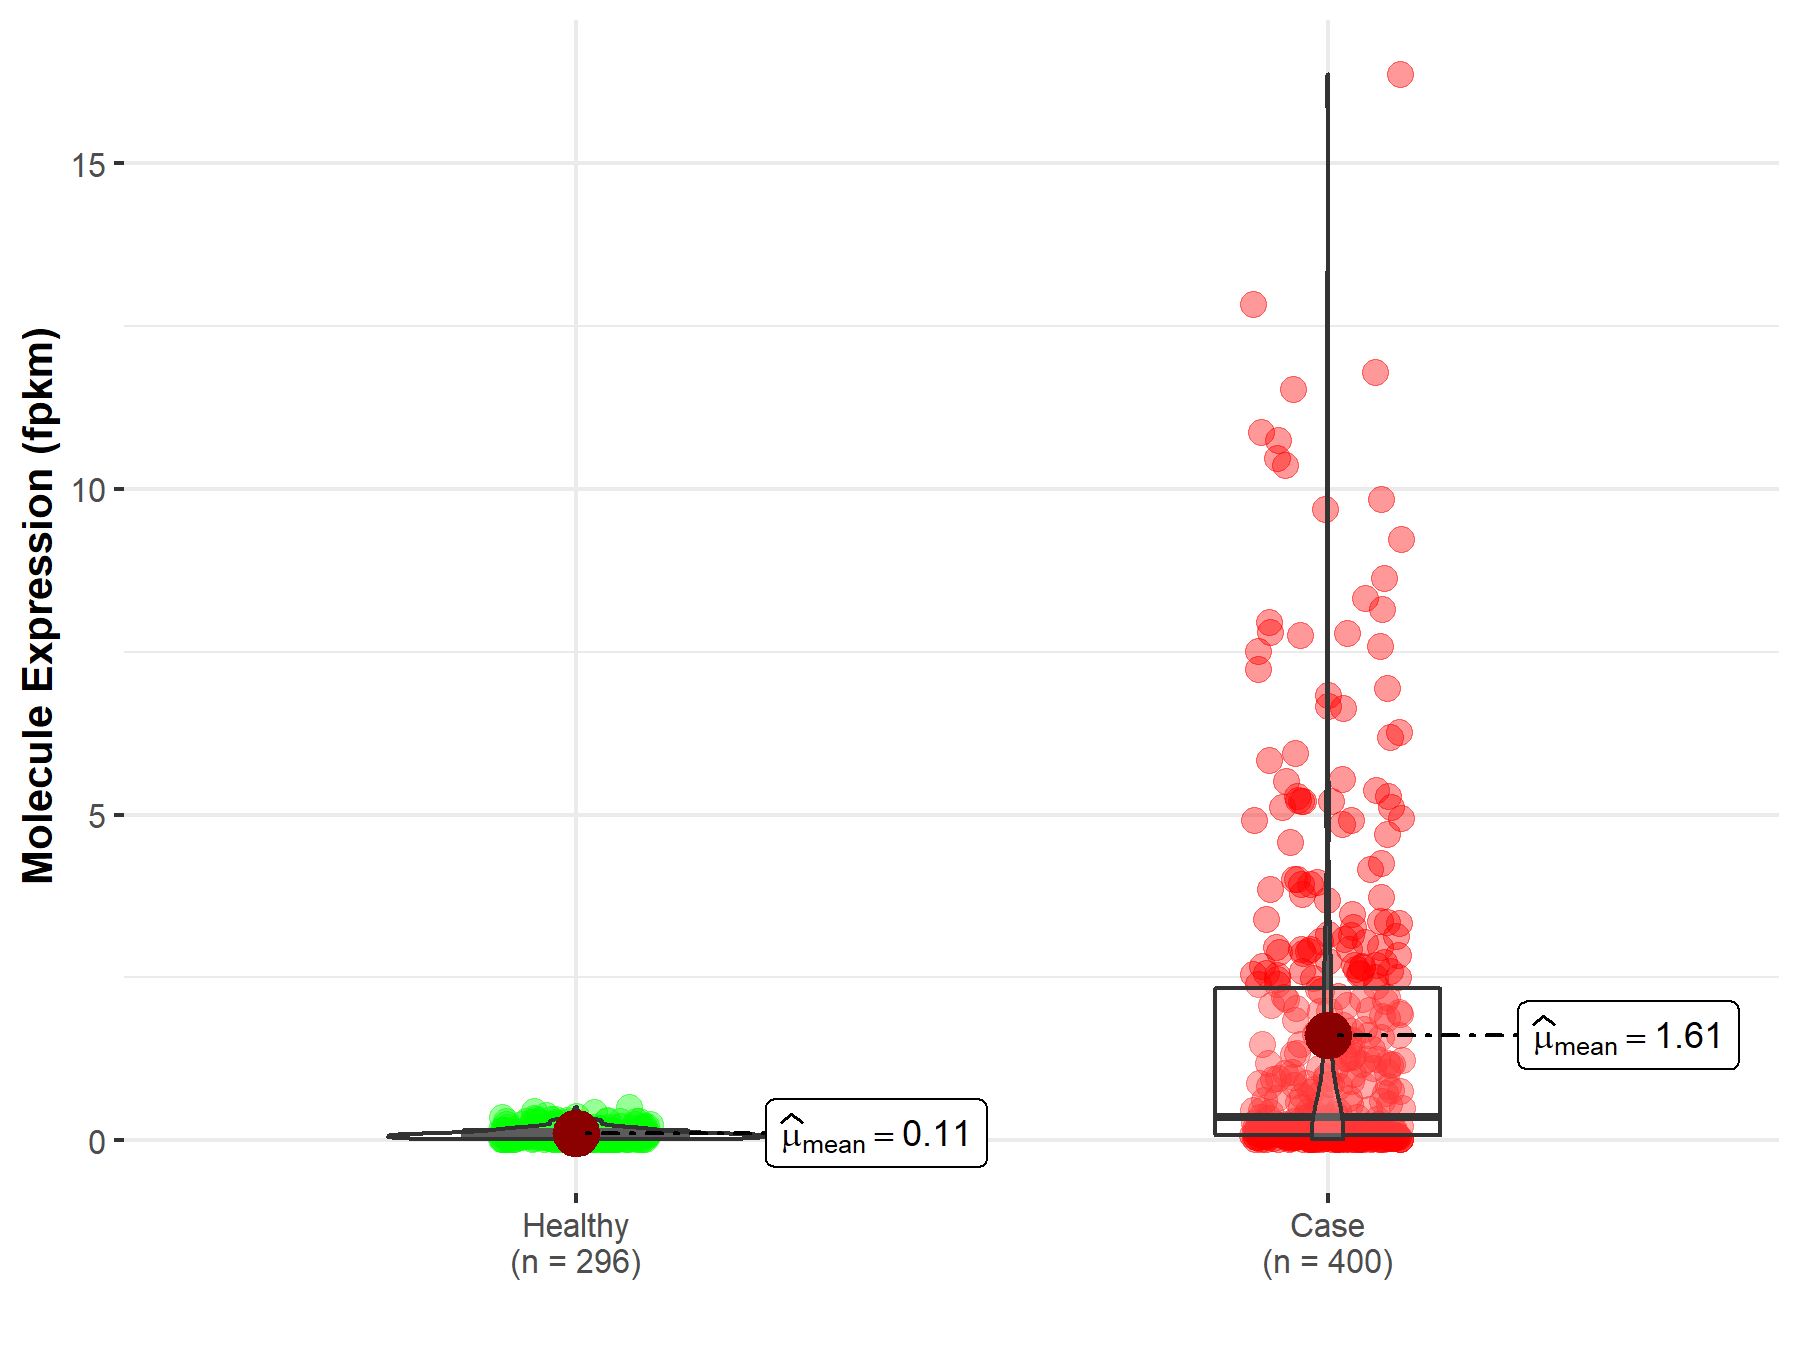
| The Studied Tissue | Lung | |
| The Specified Disease | Lung adenocarcinoma | |
| The Expression Level of Disease Section Compare with the Healthy Individual Tissue | p-value: 4.42E-37; Fold-change: -8.17E-01 | |
|
Molecule expression in the diseased tissue of patients
Molecule expression in the normal tissue of healthy individuals
|
||
| Disease-specific Molecule Abundances |
|
Click to View the Clearer Original Diagram |
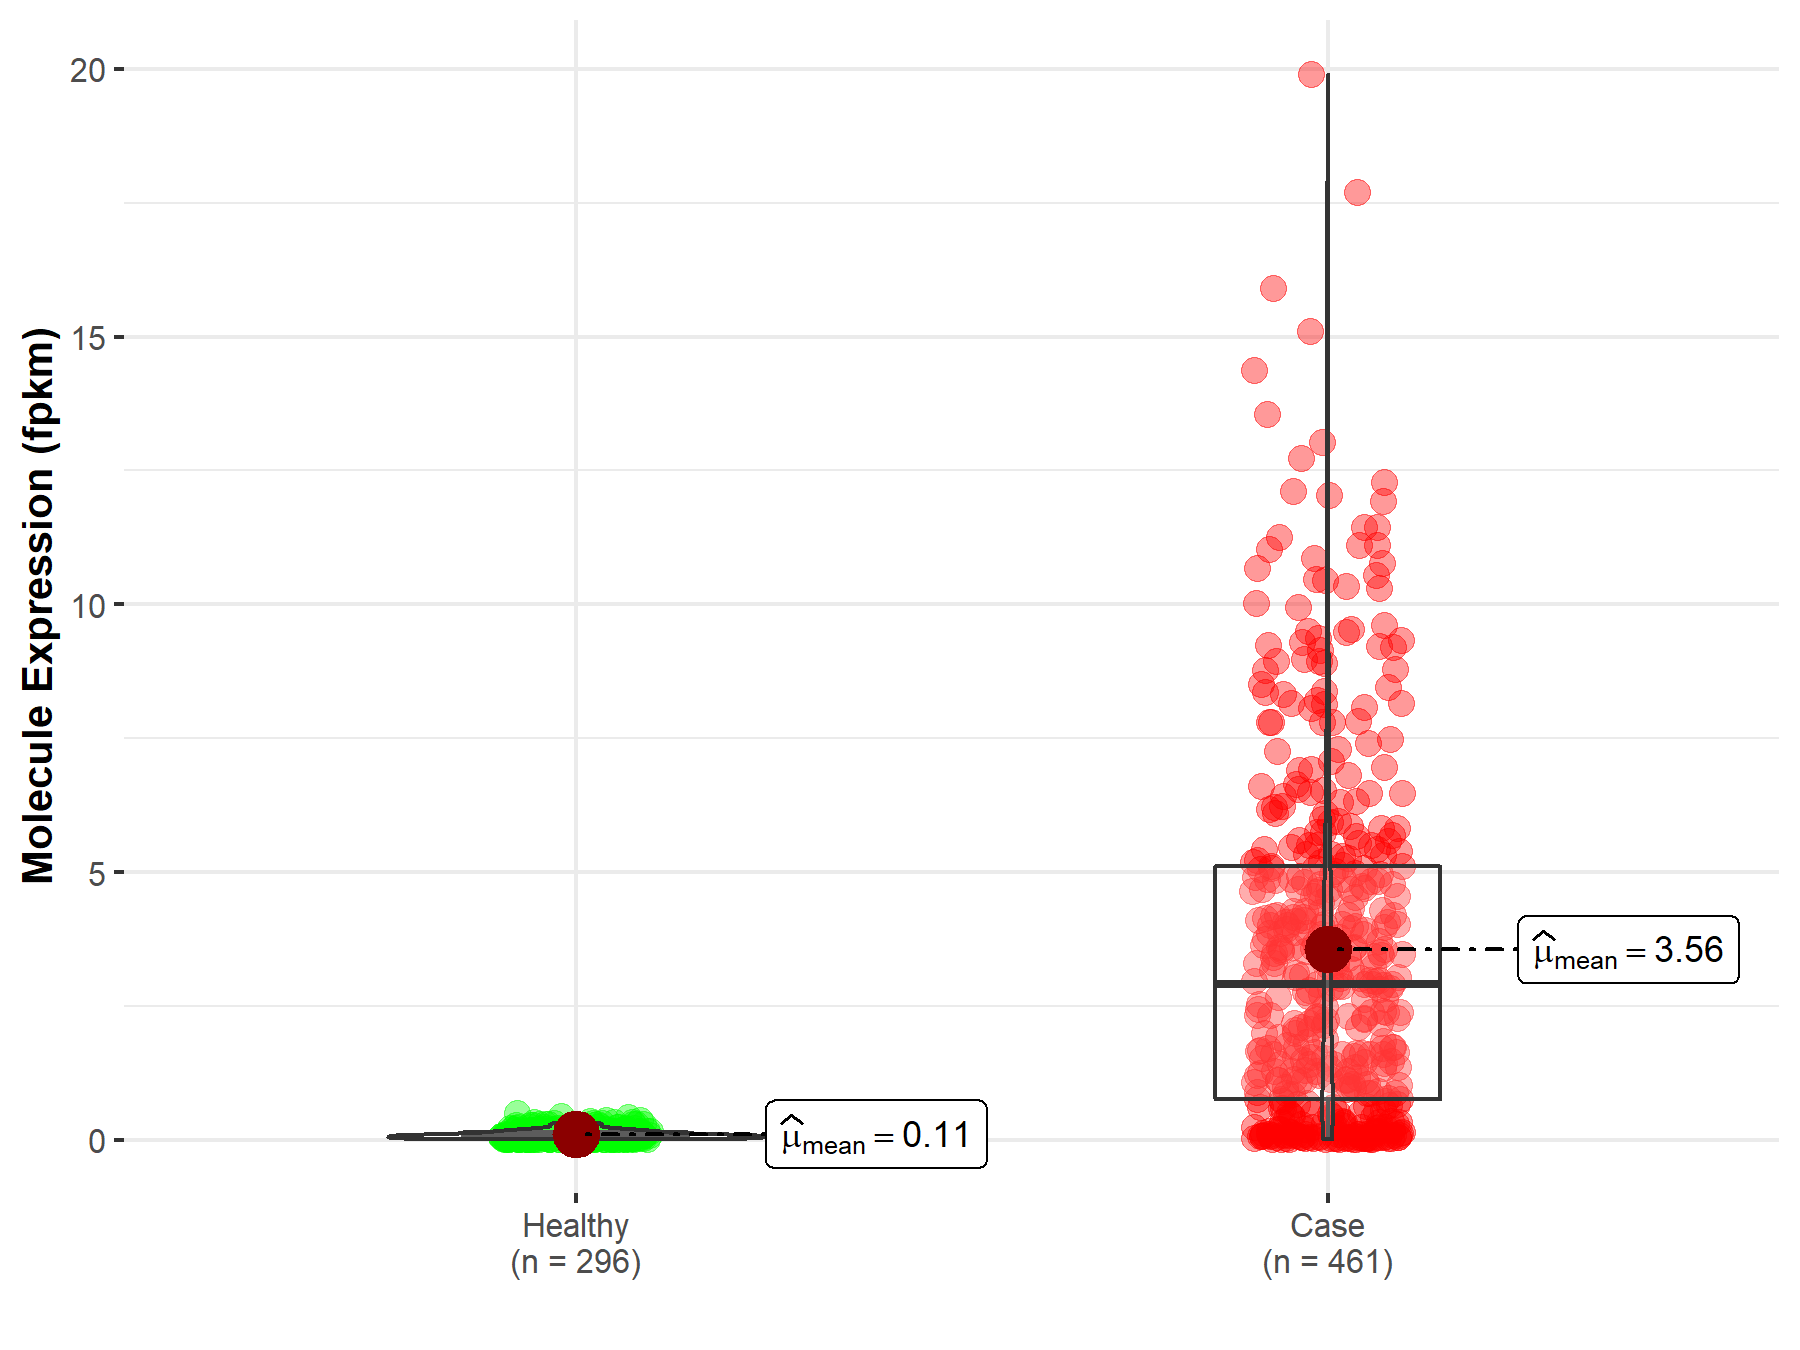
| The Studied Tissue | Lung | |
| The Specified Disease | Lung squamous cell carcinoma | |
| The Expression Level of Disease Section Compare with the Healthy Individual Tissue | p-value: 2.23E-102; Fold-change: -1.09E+00 | |
|
Molecule expression in the diseased tissue of patients
Molecule expression in the normal tissue of healthy individuals
|
||
| Disease-specific Molecule Abundances |
|
Click to View the Clearer Original Diagram |
Tissue-specific Molecule Abundances in Healthy Individuals

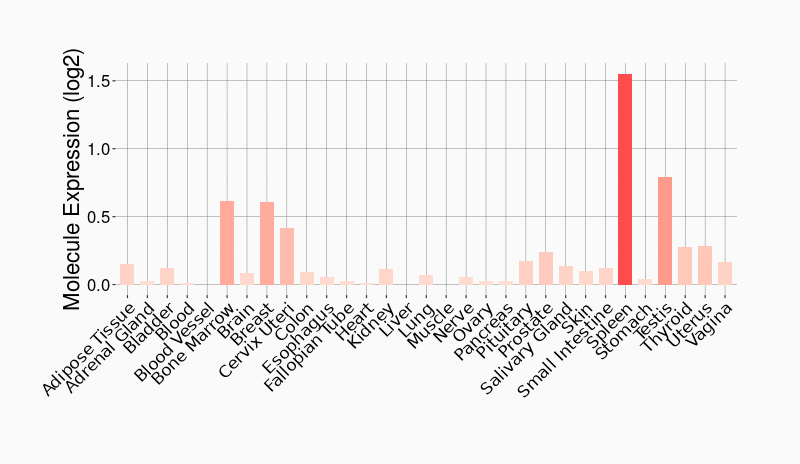
|
||
References
If you find any error in data or bug in web service, please kindly report it to Dr. Sun and Dr. Yu.