Molecule Information
General Information of the Molecule (ID: Mol01242)
| Name |
Novel transcript (RP3-508I15.14)
,Homo sapiens
|
||||
|---|---|---|---|---|---|
| Synonyms |
RP3-508I15.14
Click to Show/Hide
|
||||
| Molecule Type |
LncRNA
|
||||
| Gene Name |
SFTPF
|
||||
| Location |
chr22:38739003-38749041[+]
|
||||
| Ensembl ID | |||||
| Click to Show/Hide the Complete Species Lineage | |||||
Type(s) of Resistant Mechanism of This Molecule
 EADR: Epigenetic Alteration of DNA, RNA or Protein
Drug Resistance Data Categorized by Drug
Approved Drug(s)
1 drug(s) in total
| Drug Resistance Data Categorized by Their Corresponding Mechanisms | ||||
|
Epigenetic Alteration of DNA, RNA or Protein (EADR)
|
||||
| Disease Class: Non-small cell lung cancer [ICD-11: 2C25.Y] | [1] | |||
| Resistant Disease | Non-small cell lung cancer [ICD-11: 2C25.Y] | |||
| Resistant Drug | Cisplatin | |||
| Molecule Alteration | Expression | Down-regulation |
||
| Differential expression of the molecule in resistant disease | ||||
| Classification of Disease | Lung cancer [ICD-11: 2C25] | |||
| The Specified Disease | Lung adenocarcinoma | |||
| The Studied Tissue | Lung | |||
| The Expression Level of Disease Section Compare with the Healthy Individual Tissue | p-value: 1.23E-34 Fold-change: -1.21E+00 Z-score: -1.32E+01 |
|||
| Experimental Note | Revealed Based on the Cell Line Data | |||
| Cell Pathway Regulation | Cell apoptosis | Inhibition | hsa04210 | |
| In Vitro Model | A549 cells | Lung | Homo sapiens (Human) | CVCL_0023 |
| A549/CDDP cells | Lung | Homo sapiens (Human) | CVCL_0023 | |
| Experiment for Molecule Alteration |
qRT-PCR; RT-PCR | |||
| Experiment for Drug Resistance |
Flow cytometry assay | |||
| Mechanism Description | LncRNA Ak123263, CES1P1-001, RP3-508I15.14, Ak126698, TP53TG1, and AC090952.4.1 decreased, whereas uc003bgl.1 and NCRNA00210 increased in CDDP resistance A549 cell line. | |||
Disease- and Tissue-specific Abundances of This Molecule
ICD Disease Classification 02

| Differential expression of molecule in resistant diseases | ||
| The Studied Tissue | Lung | |
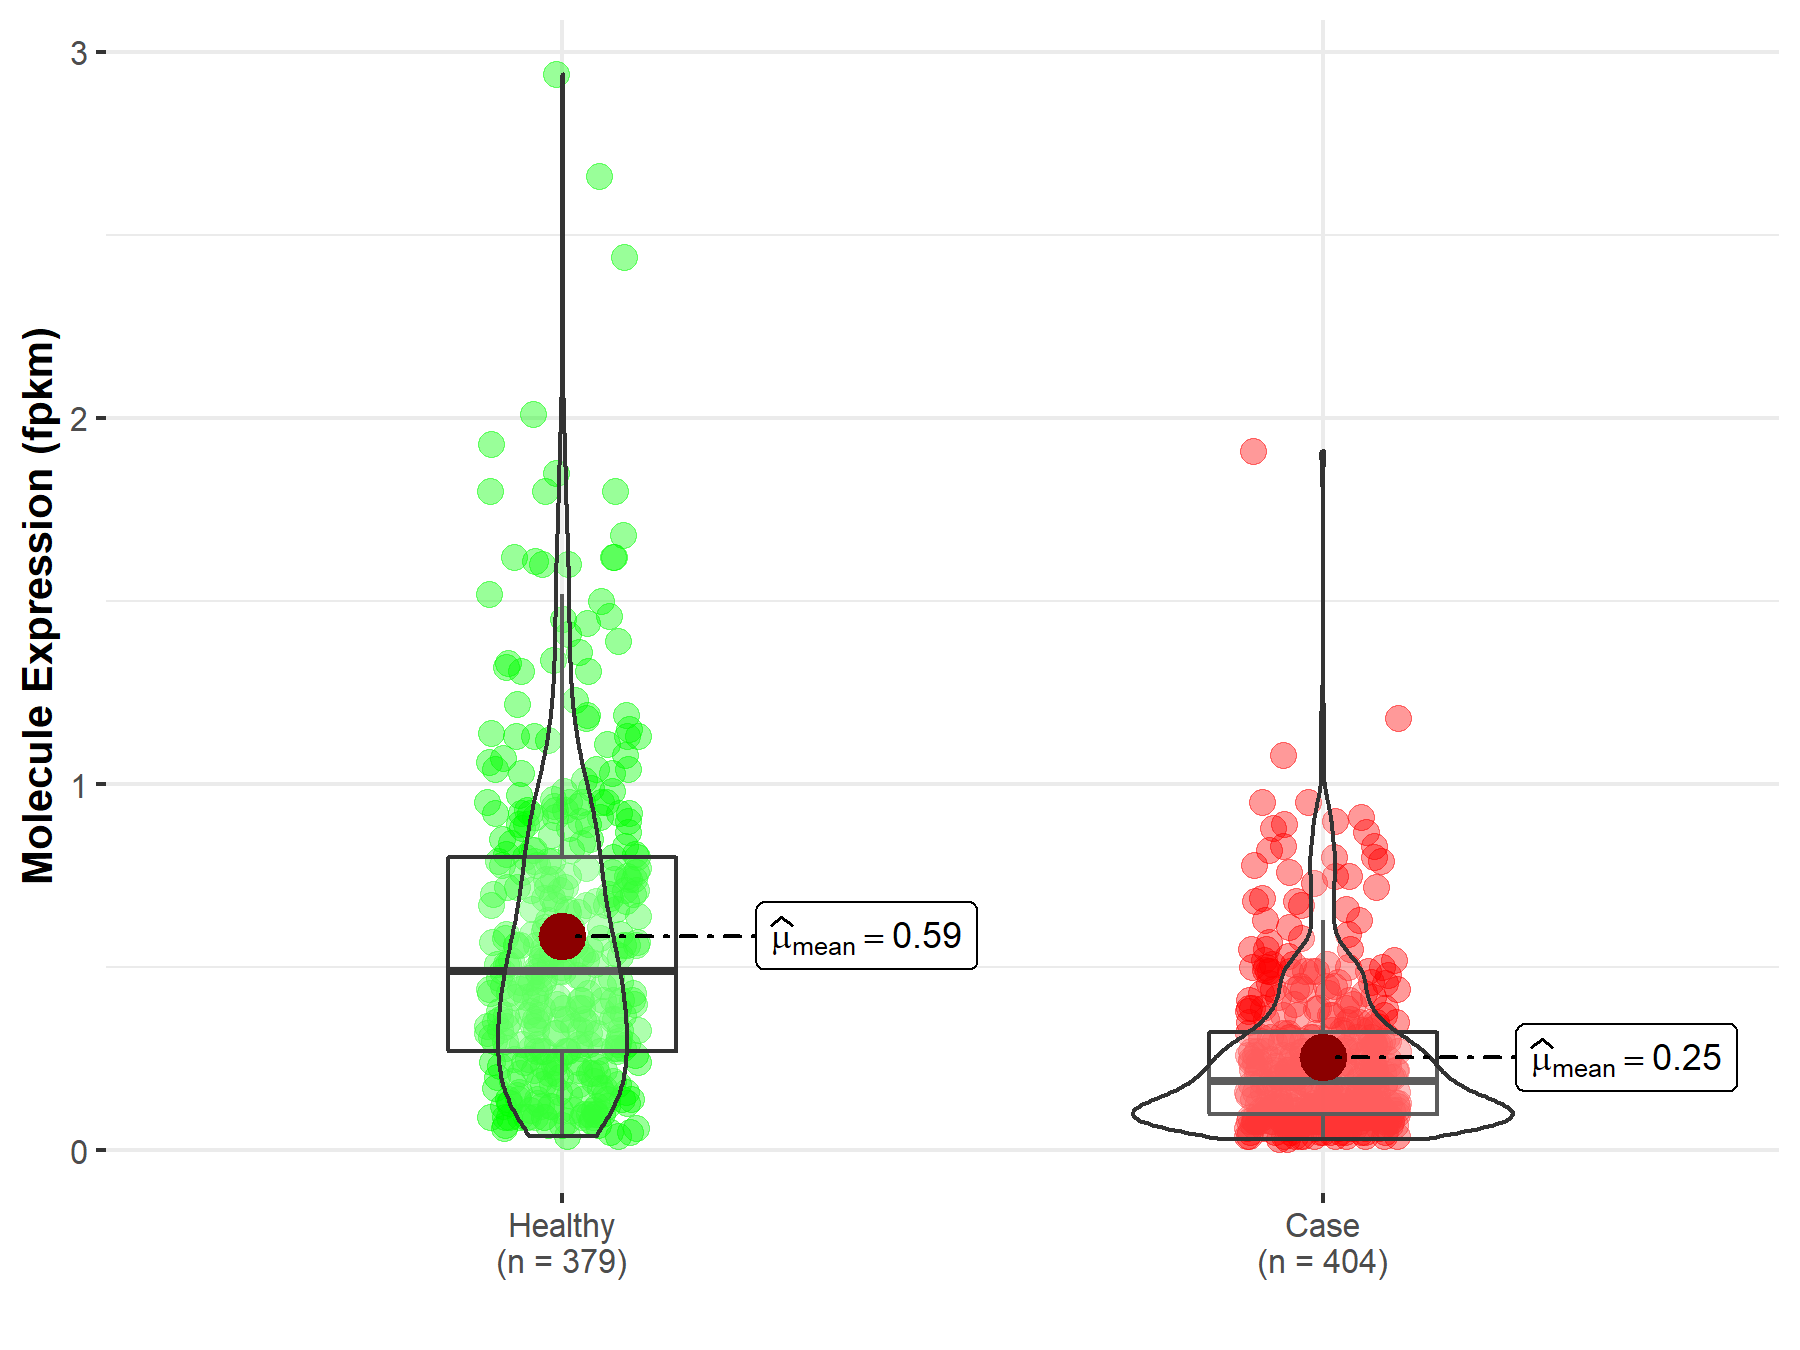
| The Specified Disease | Lung adenocarcinoma | |
| The Expression Level of Disease Section Compare with the Healthy Individual Tissue | p-value: 9.07E-43; Fold-change: 3.03E-01 | |
|
Molecule expression in the diseased tissue of patients
Molecule expression in the normal tissue of healthy individuals
|
||
| Disease-specific Molecule Abundances |
|
Click to View the Clearer Original Diagram |
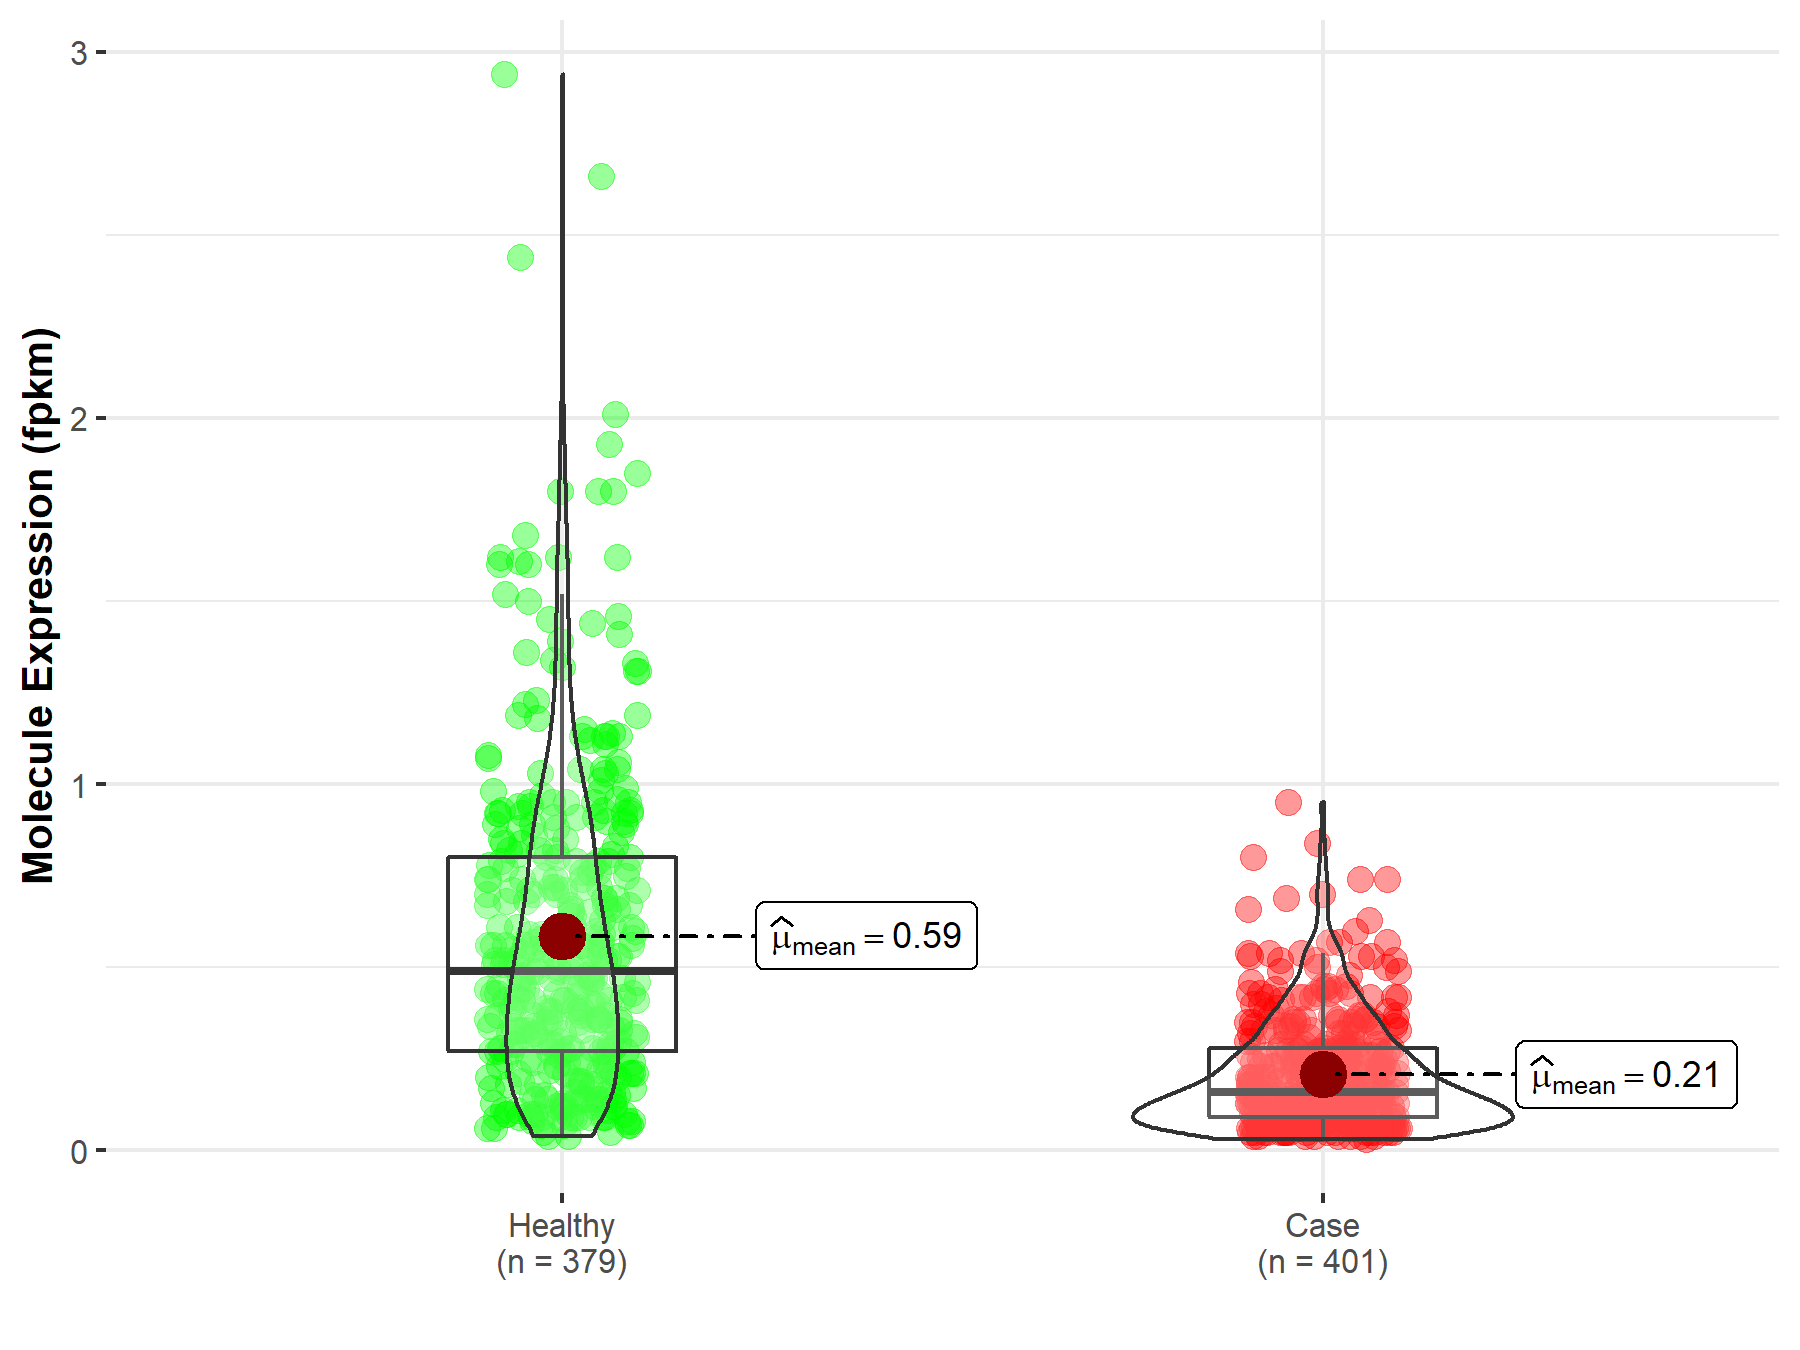
| The Studied Tissue | Lung | |
| The Specified Disease | Lung squamous cell carcinoma | |
| The Expression Level of Disease Section Compare with the Healthy Individual Tissue | p-value: 8.41E-60; Fold-change: 3.74E-01 | |
|
Molecule expression in the diseased tissue of patients
Molecule expression in the normal tissue of healthy individuals
|
||
| Disease-specific Molecule Abundances |
|
Click to View the Clearer Original Diagram |
Tissue-specific Molecule Abundances in Healthy Individuals

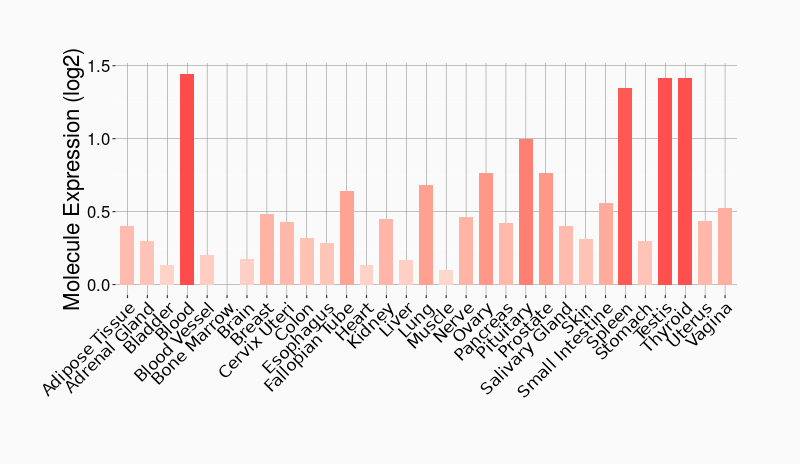
|
||
References
If you find any error in data or bug in web service, please kindly report it to Dr. Sun and Dr. Yu.