Molecule Information
General Information of the Molecule (ID: Mol01241)
| Name |
Surfactant associated 1, LncRNA (SFTA1P)
,Homo sapiens
|
||||
|---|---|---|---|---|---|
| Synonyms |
SFTA1P
Click to Show/Hide
|
||||
| Molecule Type |
LncRNA
|
||||
| Gene Name |
HOXD-AS1, MIR7704HG, Mdgt
|
||||
| Gene ID | |||||
| Location |
chr10:10784437-10795047[-]
|
||||
| Ensembl ID | |||||
| HGNC ID | |||||
| Click to Show/Hide the Complete Species Lineage | |||||
Type(s) of Resistant Mechanism of This Molecule
 EADR: Epigenetic Alteration of DNA, RNA or Protein
Drug Resistance Data Categorized by Drug
Approved Drug(s)
1 drug(s) in total
| Drug Sensitivity Data Categorized by Their Corresponding Mechanisms | ||||
|
Epigenetic Alteration of DNA, RNA or Protein (EADR)
|
||||
| Disease Class: Lung squamous cell carcinoma [ICD-11: 2C25.3] | [1] | |||
| Sensitive Disease | Lung squamous cell carcinoma [ICD-11: 2C25.3] | |||
| Sensitive Drug | Cisplatin | |||
| Molecule Alteration | Expression | Up-regulation |
||
| Experimental Note | Identified from the Human Clinical Data | |||
| Cell Pathway Regulation | Cell apoptosis | Activation | hsa04210 | |
| In Vitro Model | A549 cells | Lung | Homo sapiens (Human) | CVCL_0023 |
| H1299 cells | Lung | Homo sapiens (Human) | CVCL_0060 | |
| Sk-MES-1 cells | Lung | Homo sapiens (Human) | CVCL_0630 | |
| 16HBE cells | Lung | Homo sapiens (Human) | CVCL_0112 | |
| A549-DDP cells | Lung | Homo sapiens (Human) | CVCL_IP03 | |
| NCl-H226 cells | Lung | Homo sapiens (Human) | CVCL_1544 | |
| Experiment for Molecule Alteration |
RT-PCR | |||
| Experiment for Drug Resistance |
MTS Cell Proliferation Assay; EdU assay; Flow cytometry assay | |||
| Mechanism Description | Long noncoding RNA SFTA1P promoted apoptosis and increased cisplatin chemosensitivity via regulating the hnRNP-U-GADD45A axis in lung squamous cell carcinoma. SFTA1P could up-regulate hnRNP-U expression. hnRNP-U enhanced cisplatin-induced apoptosis through up-regulation of GADD45A. | |||
Disease- and Tissue-specific Abundances of This Molecule
ICD Disease Classification 02

| Differential expression of molecule in resistant diseases | ||
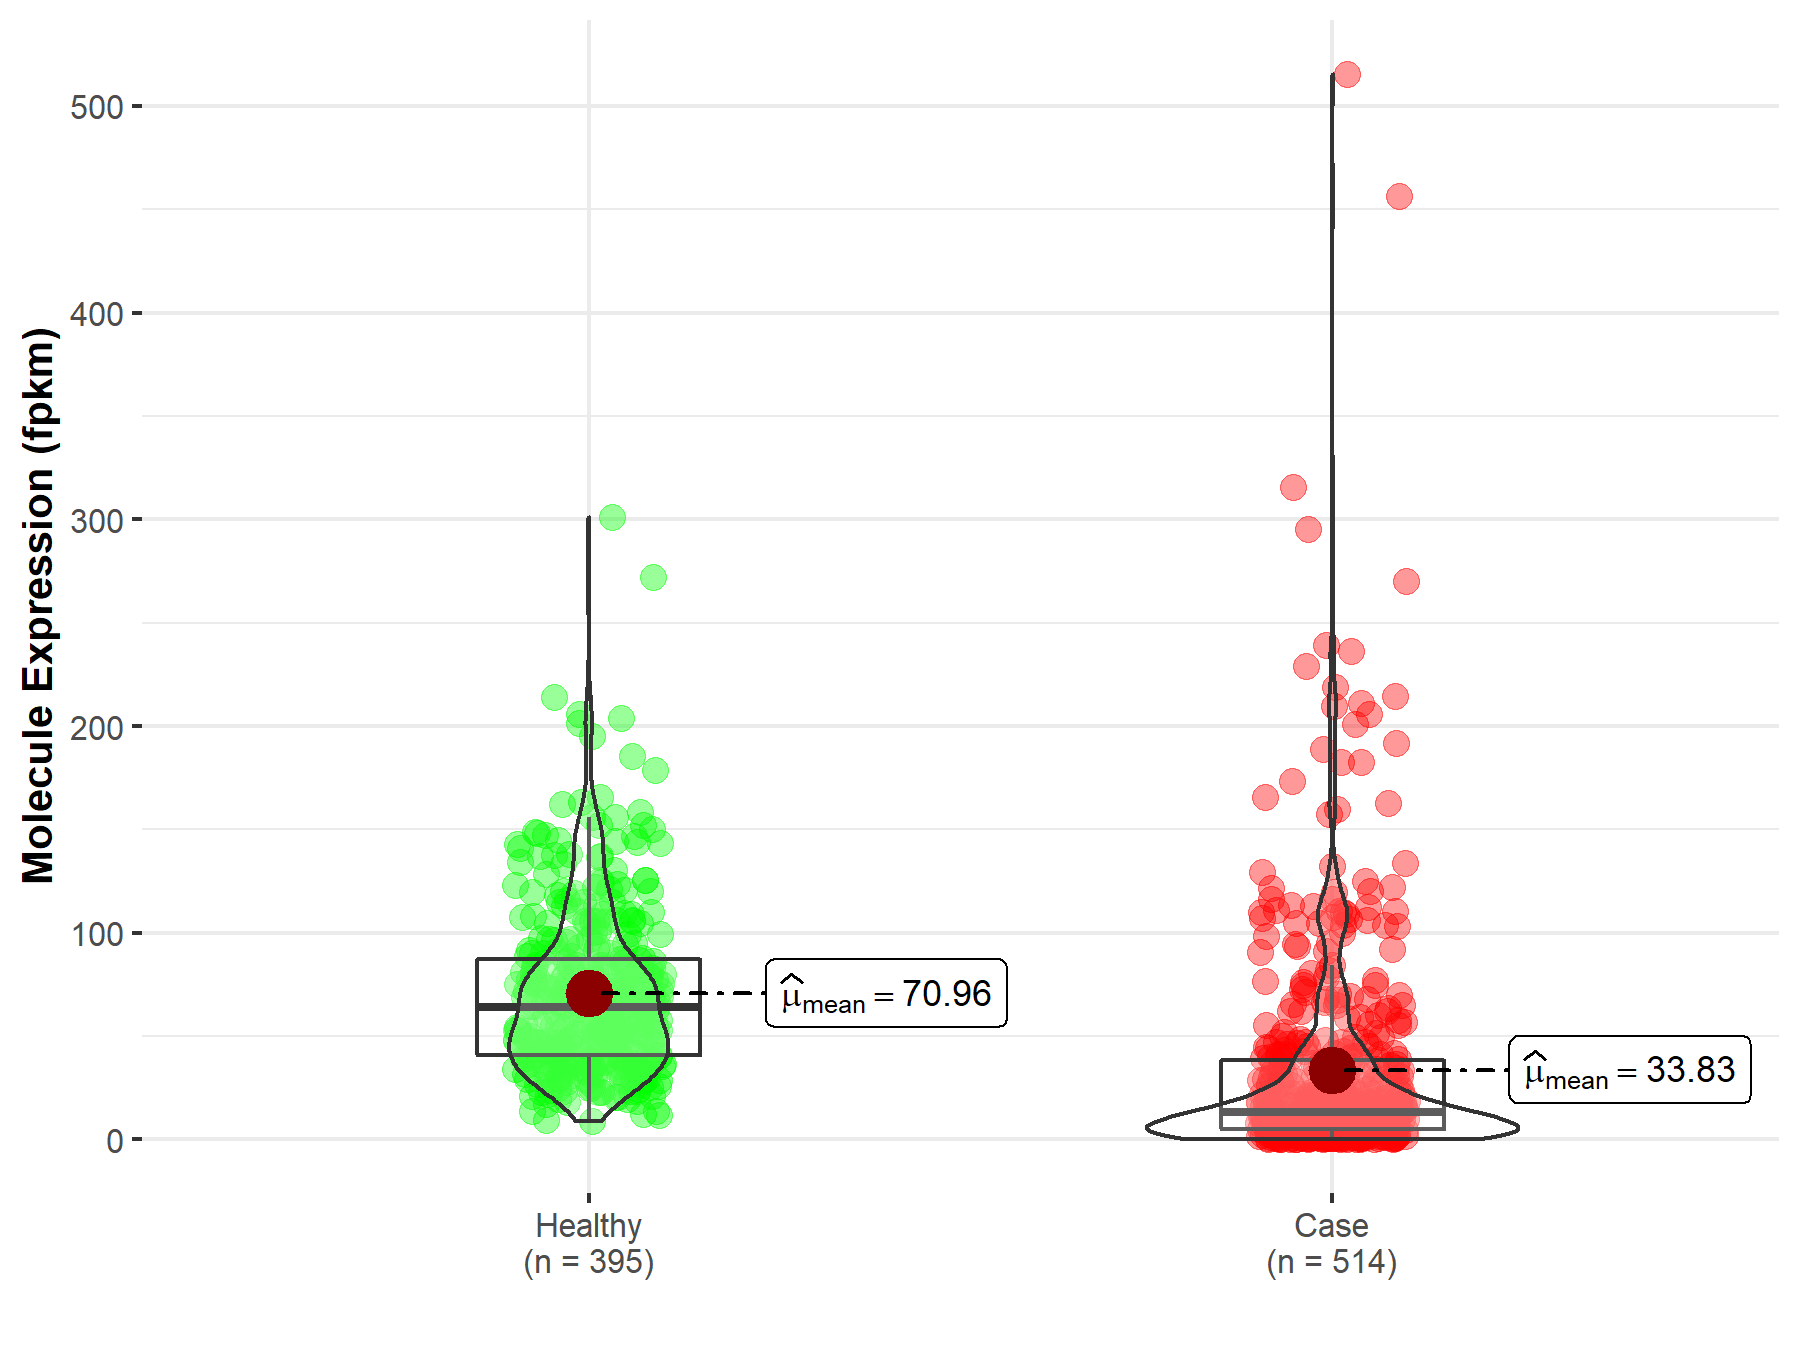
| The Studied Tissue | Lung | |
| The Specified Disease | Lung adenocarcinoma | |
| The Expression Level of Disease Section Compare with the Healthy Individual Tissue | p-value: 1.96E-74; Fold-change: 1.88E-01 | |
|
Molecule expression in the diseased tissue of patients
Molecule expression in the normal tissue of healthy individuals
|
||
| Disease-specific Molecule Abundances |
|
Click to View the Clearer Original Diagram |
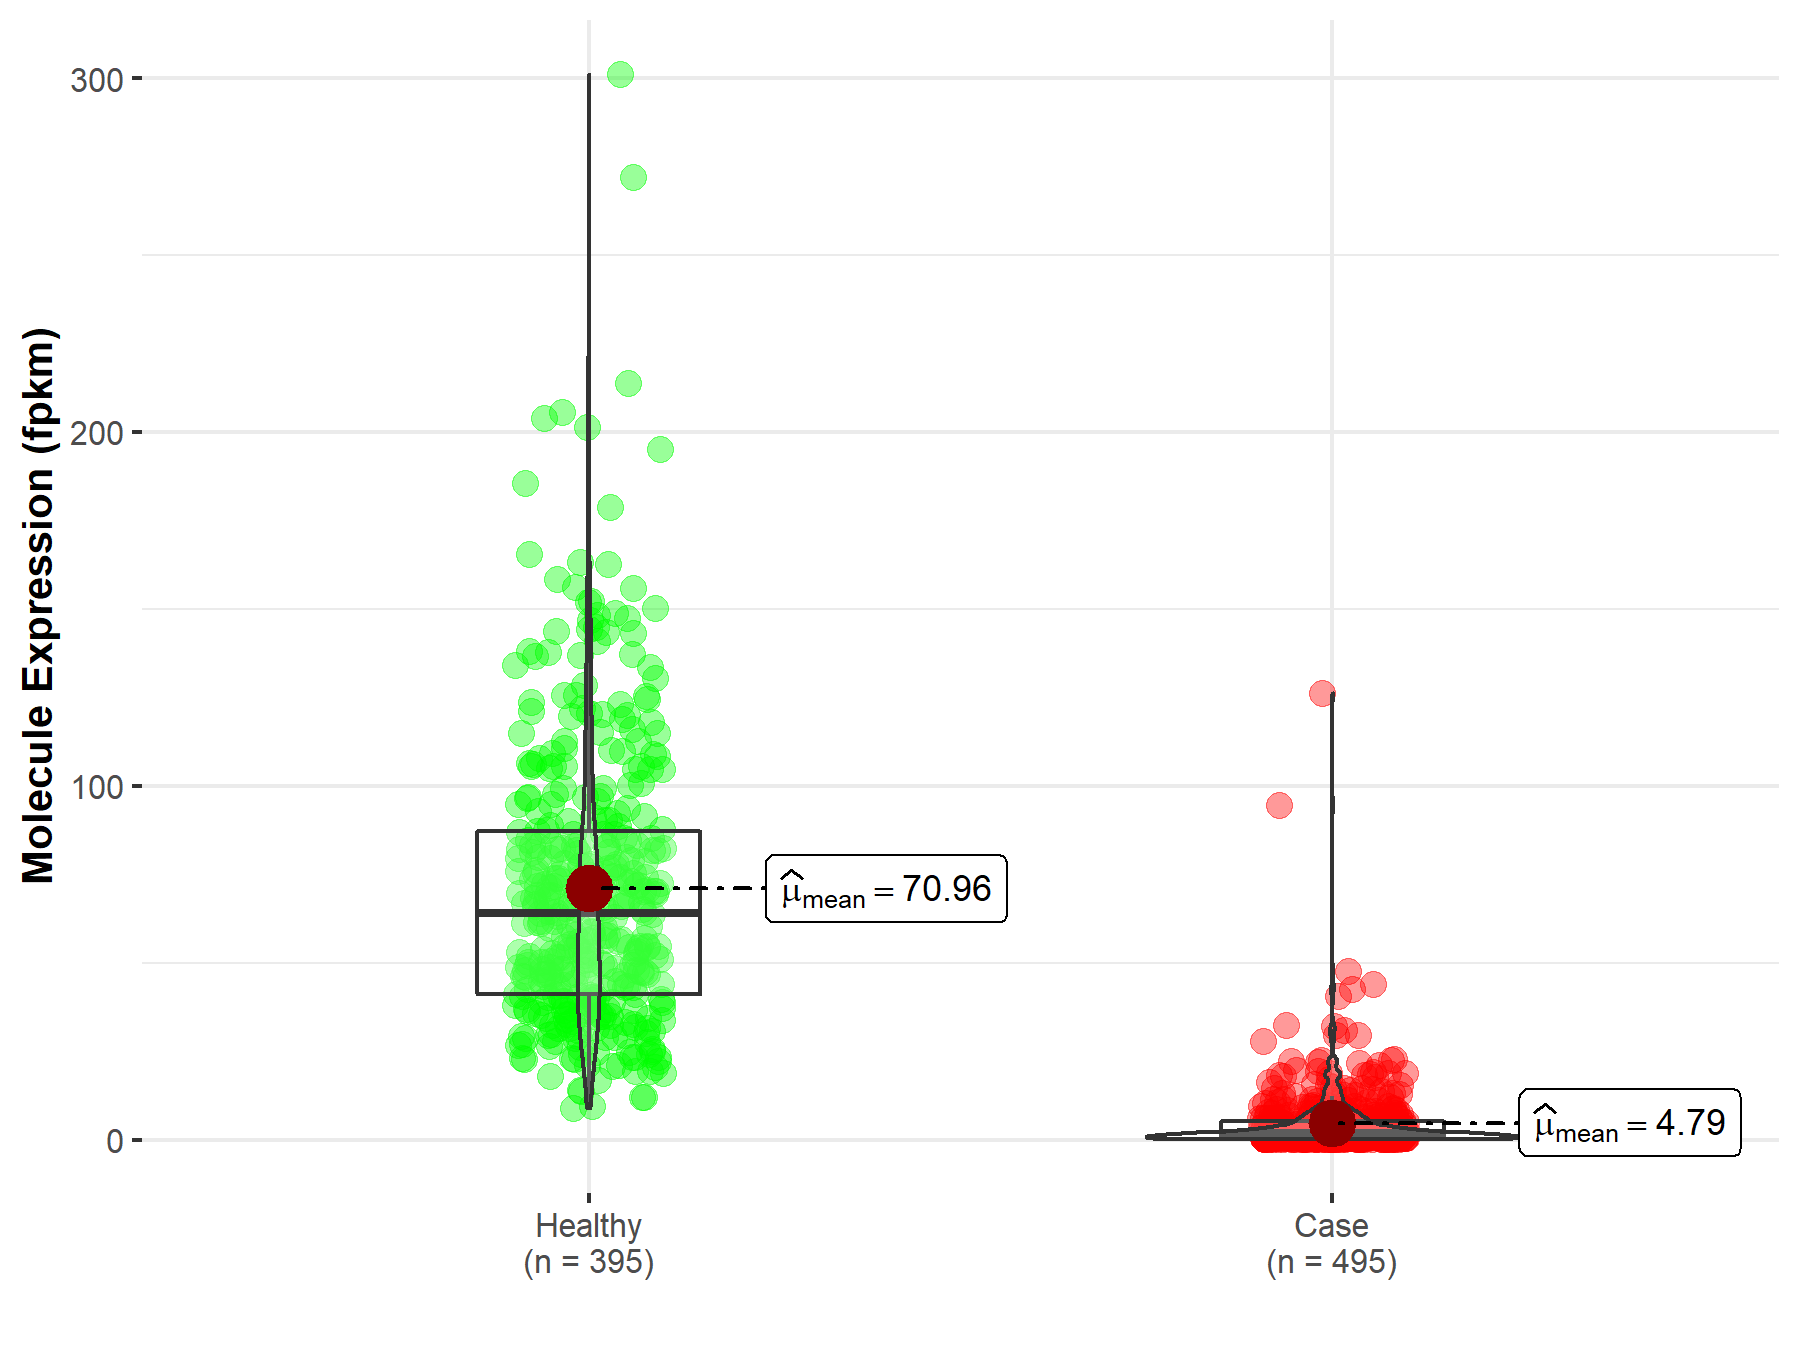
| The Studied Tissue | Lung | |
| The Specified Disease | Lung squamous cell carcinoma | |
| The Expression Level of Disease Section Compare with the Healthy Individual Tissue | p-value: 1.90E-290; Fold-change: 5.22E-01 | |
|
Molecule expression in the diseased tissue of patients
Molecule expression in the normal tissue of healthy individuals
|
||
| Disease-specific Molecule Abundances |
|
Click to View the Clearer Original Diagram |
Tissue-specific Molecule Abundances in Healthy Individuals

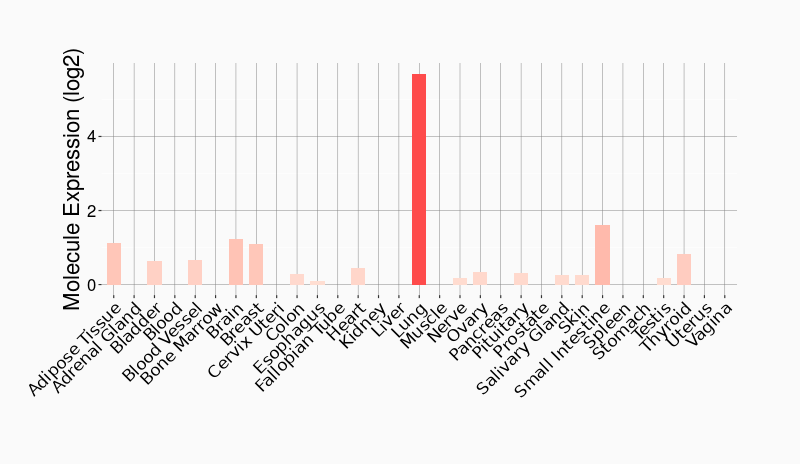
|
||
References
If you find any error in data or bug in web service, please kindly report it to Dr. Sun and Dr. Yu.