Molecule Information
General Information of the Molecule (ID: Mol01218)
| Name |
MIR4435-2 host gene (MIR4435-2HG)
,Homo sapiens
|
||||
|---|---|---|---|---|---|
| Synonyms |
MIR4435-2HG
Click to Show/Hide
|
||||
| Molecule Type |
LncRNA
|
||||
| Gene Name |
LOC554202, LncHIFCAR, hsa-lnc-31
|
||||
| Gene ID | |||||
| Location |
chr2:111006015-111523376[-]
|
||||
| Ensembl ID | |||||
| HGNC ID | |||||
| Click to Show/Hide the Complete Species Lineage | |||||
Type(s) of Resistant Mechanism of This Molecule
 EADR: Epigenetic Alteration of DNA, RNA or Protein
Drug Resistance Data Categorized by Drug
Approved Drug(s)
1 drug(s) in total
| Drug Resistance Data Categorized by Their Corresponding Mechanisms | ||||
|
Epigenetic Alteration of DNA, RNA or Protein (EADR)
|
||||
| Disease Class: Non-small cell lung cancer [ICD-11: 2C25.Y] | [1] | |||
| Resistant Disease | Non-small cell lung cancer [ICD-11: 2C25.Y] | |||
| Resistant Drug | Cisplatin | |||
| Molecule Alteration | Expression | Up-regulation |
||
| Differential expression of the molecule in resistant disease | ||||
| Classification of Disease | Lung cancer [ICD-11: 2C25] | |||
| The Specified Disease | Lung adenocarcinoma | |||
| The Studied Tissue | Lung | |||
| The Expression Level of Disease Section Compare with the Healthy Individual Tissue | p-value: 4.02E-10 Fold-change: 4.79E-01 Z-score: 6.32E+00 |
|||
| Experimental Note | Revealed Based on the Cell Line Data | |||
| Cell Pathway Regulation | Cell apoptosis | Inhibition | hsa04210 | |
| Cell proliferation | Activation | hsa05200 | ||
| In Vitro Model | A549 cells | Lung | Homo sapiens (Human) | CVCL_0023 |
| Experiment for Molecule Alteration |
RT-qPCR | |||
| Experiment for Drug Resistance |
MTT assay; Flow cytometric analysis | |||
| Mechanism Description | LncRNA Ak001796 increased the resistance of NSCLC cells to cisplatin through regulating cell apoptosis and cell proliferation. | |||
Disease- and Tissue-specific Abundances of This Molecule
ICD Disease Classification 02

| Differential expression of molecule in resistant diseases | ||
| The Studied Tissue | Lung | |
| The Specified Disease | Lung adenocarcinoma | |
| The Expression Level of Disease Section Compare with the Healthy Individual Tissue | p-value: 1.76E-14; Fold-change: -3.76E-02 | |
|
Molecule expression in the diseased tissue of patients
Molecule expression in the normal tissue of healthy individuals
|
||
| Disease-specific Molecule Abundances |
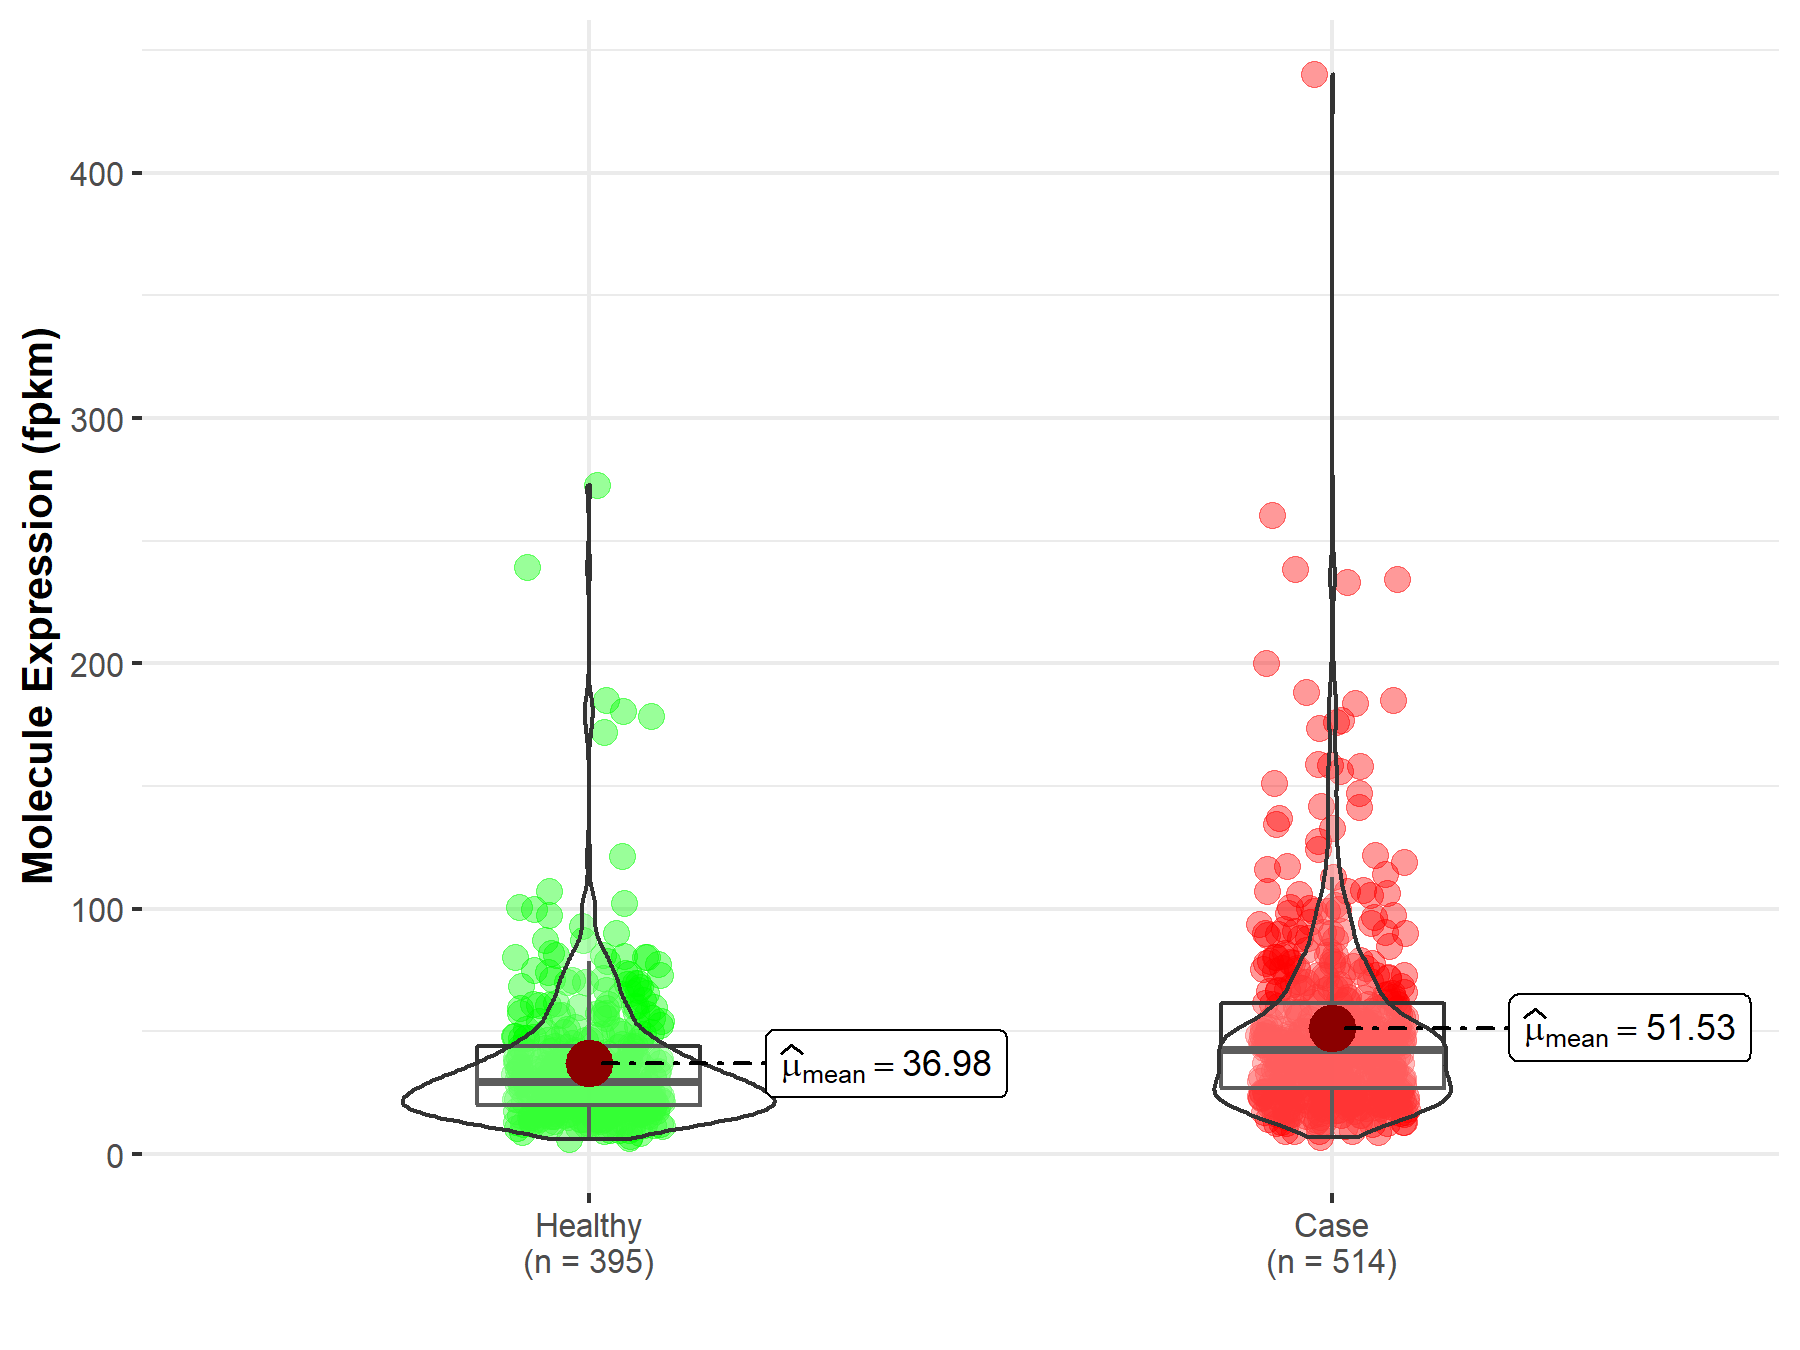
|
Click to View the Clearer Original Diagram |
| The Studied Tissue | Lung | |
| The Specified Disease | Lung squamous cell carcinoma | |
| The Expression Level of Disease Section Compare with the Healthy Individual Tissue | p-value: 5.83E-27; Fold-change: -5.37E-02 | |
|
Molecule expression in the diseased tissue of patients
Molecule expression in the normal tissue of healthy individuals
|
||
| Disease-specific Molecule Abundances |
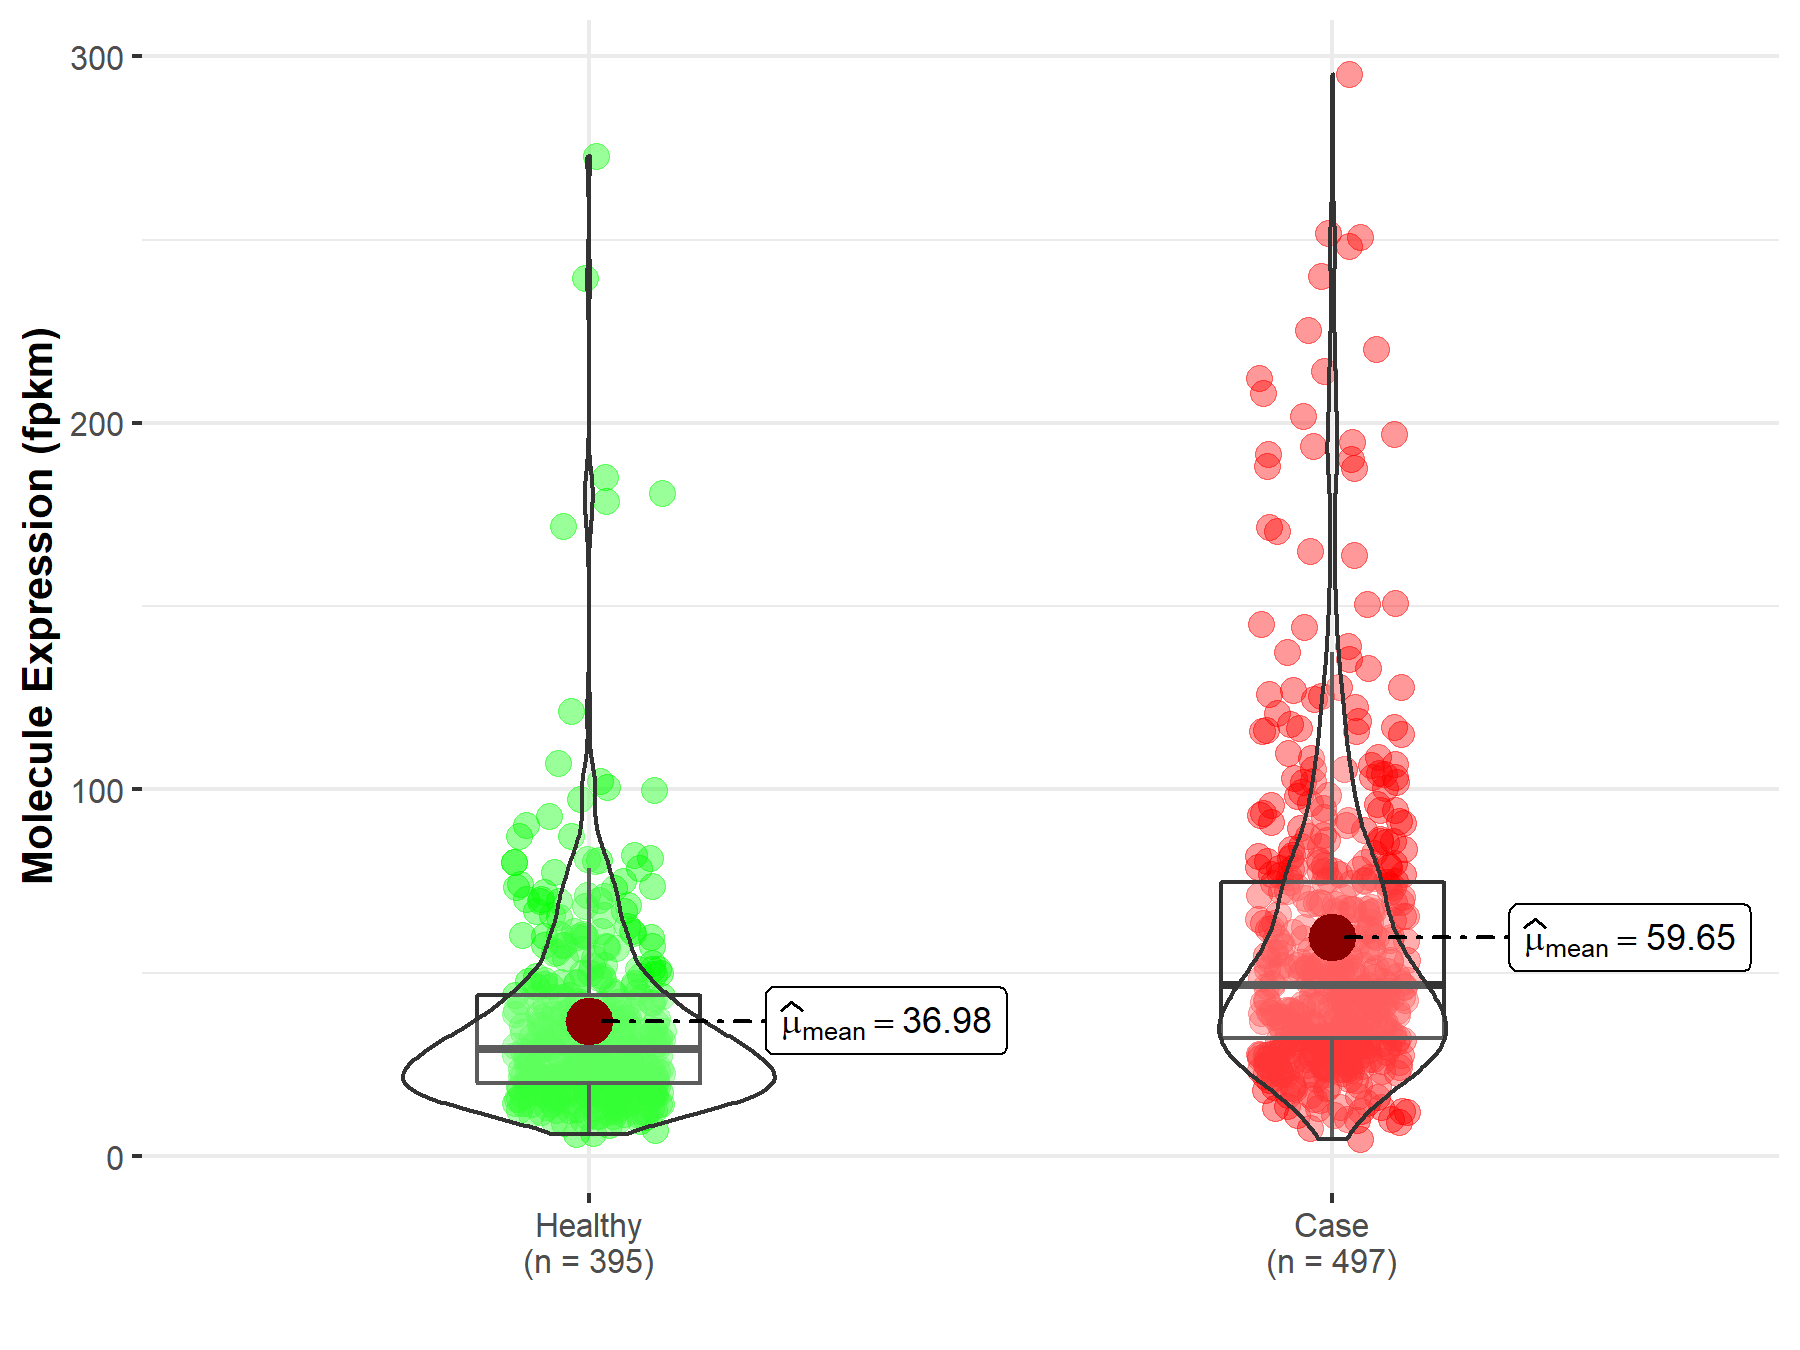
|
Click to View the Clearer Original Diagram |
Tissue-specific Molecule Abundances in Healthy Individuals

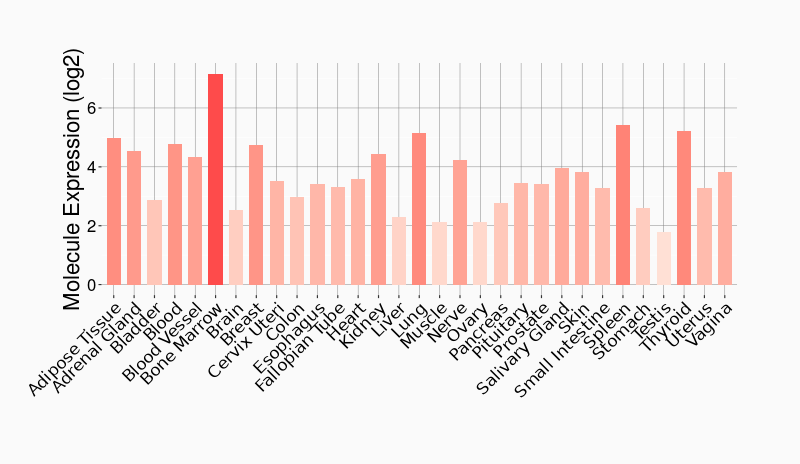
|
||
References
If you find any error in data or bug in web service, please kindly report it to Dr. Sun and Dr. Yu.