Molecule Information
General Information of the Molecule (ID: Mol00665)
| Name |
Translationally-controlled tumor protein (TCTP)
,Homo sapiens
|
||||
|---|---|---|---|---|---|
| Synonyms |
TCTP; Fortilin; Histamine-releasing factor; HRF; p23
Click to Show/Hide
|
||||
| Molecule Type |
Protein
|
||||
| Gene Name |
TPT1
|
||||
| Gene ID | |||||
| Location |
chr13:45333471-45341284[-]
|
||||
| Sequence |
MIIYRDLISHDEMFSDIYKIREIADGLCLEVEGKMVSRTEGNIDDSLIGGNASAEGPEGE
GTESTVITGVDIVMNHHLQETSFTKEAYKKYIKDYMKSIKGKLEEQRPERVKPFMTGAAE QIKHILANFKNYQFFIGENMNPDGMVALLDYREDGVTPYMIFFKDGLEMEKC Click to Show/Hide
|
||||
| 3D-structure |
|
||||
| Function |
Involved in calcium binding and microtubule stabilization.
Click to Show/Hide
|
||||
| Uniprot ID | |||||
| Ensembl ID | |||||
| HGNC ID | |||||
| Click to Show/Hide the Complete Species Lineage | |||||
Type(s) of Resistant Mechanism of This Molecule
 UAPP: Unusual Activation of Pro-survival Pathway
Drug Resistance Data Categorized by Drug
Approved Drug(s)
1 drug(s) in total
| Drug Resistance Data Categorized by Their Corresponding Mechanisms | ||||
|
Unusual Activation of Pro-survival Pathway (UAPP)
|
||||
| Disease Class: Lung cancer [ICD-11: 2C25.5] | [1] | |||
| Resistant Disease | Lung cancer [ICD-11: 2C25.5] | |||
| Resistant Drug | Cisplatin | |||
| Molecule Alteration | Expression | Up-regulation |
||
| Experimental Note | Revealed Based on the Cell Line Data | |||
| Cell Pathway Regulation | Cell apoptosis | Activation | hsa04210 | |
| Cell proliferation | Inhibition | hsa05200 | ||
| Cell viability | Inhibition | hsa05200 | ||
| pim-3 signaling pathway | Inhibition | hsa05206 | ||
| In Vitro Model | A549 cells | Lung | Homo sapiens (Human) | CVCL_0023 |
| Experiment for Molecule Alteration |
Western blot analysis | |||
| Experiment for Drug Resistance |
MTT assay; Flow cytometry assay | |||
| Mechanism Description | Upregulation of miR-1236-3p could reverse DDP resistance in lung cancer cells through targeting TPT1 and inhibition of the Pim-3 signaling pathway. | |||
Disease- and Tissue-specific Abundances of This Molecule
ICD Disease Classification 02

| Differential expression of molecule in resistant diseases | ||
| The Studied Tissue | Lung | |
| The Specified Disease | Lung cancer | |
| The Expression Level of Disease Section Compare with the Healthy Individual Tissue | p-value: 4.61E-41; Fold-change: -1.70E-01; Z-score: -1.21E+00 | |
| The Expression Level of Disease Section Compare with the Adjacent Tissue | p-value: 6.02E-14; Fold-change: -1.03E-01; Z-score: -8.23E-01 | |
|
Molecule expression in the normal tissue adjacent to the diseased tissue of patients
Molecule expression in the diseased tissue of patients
Molecule expression in the normal tissue of healthy individuals
|
||
| Disease-specific Molecule Abundances |
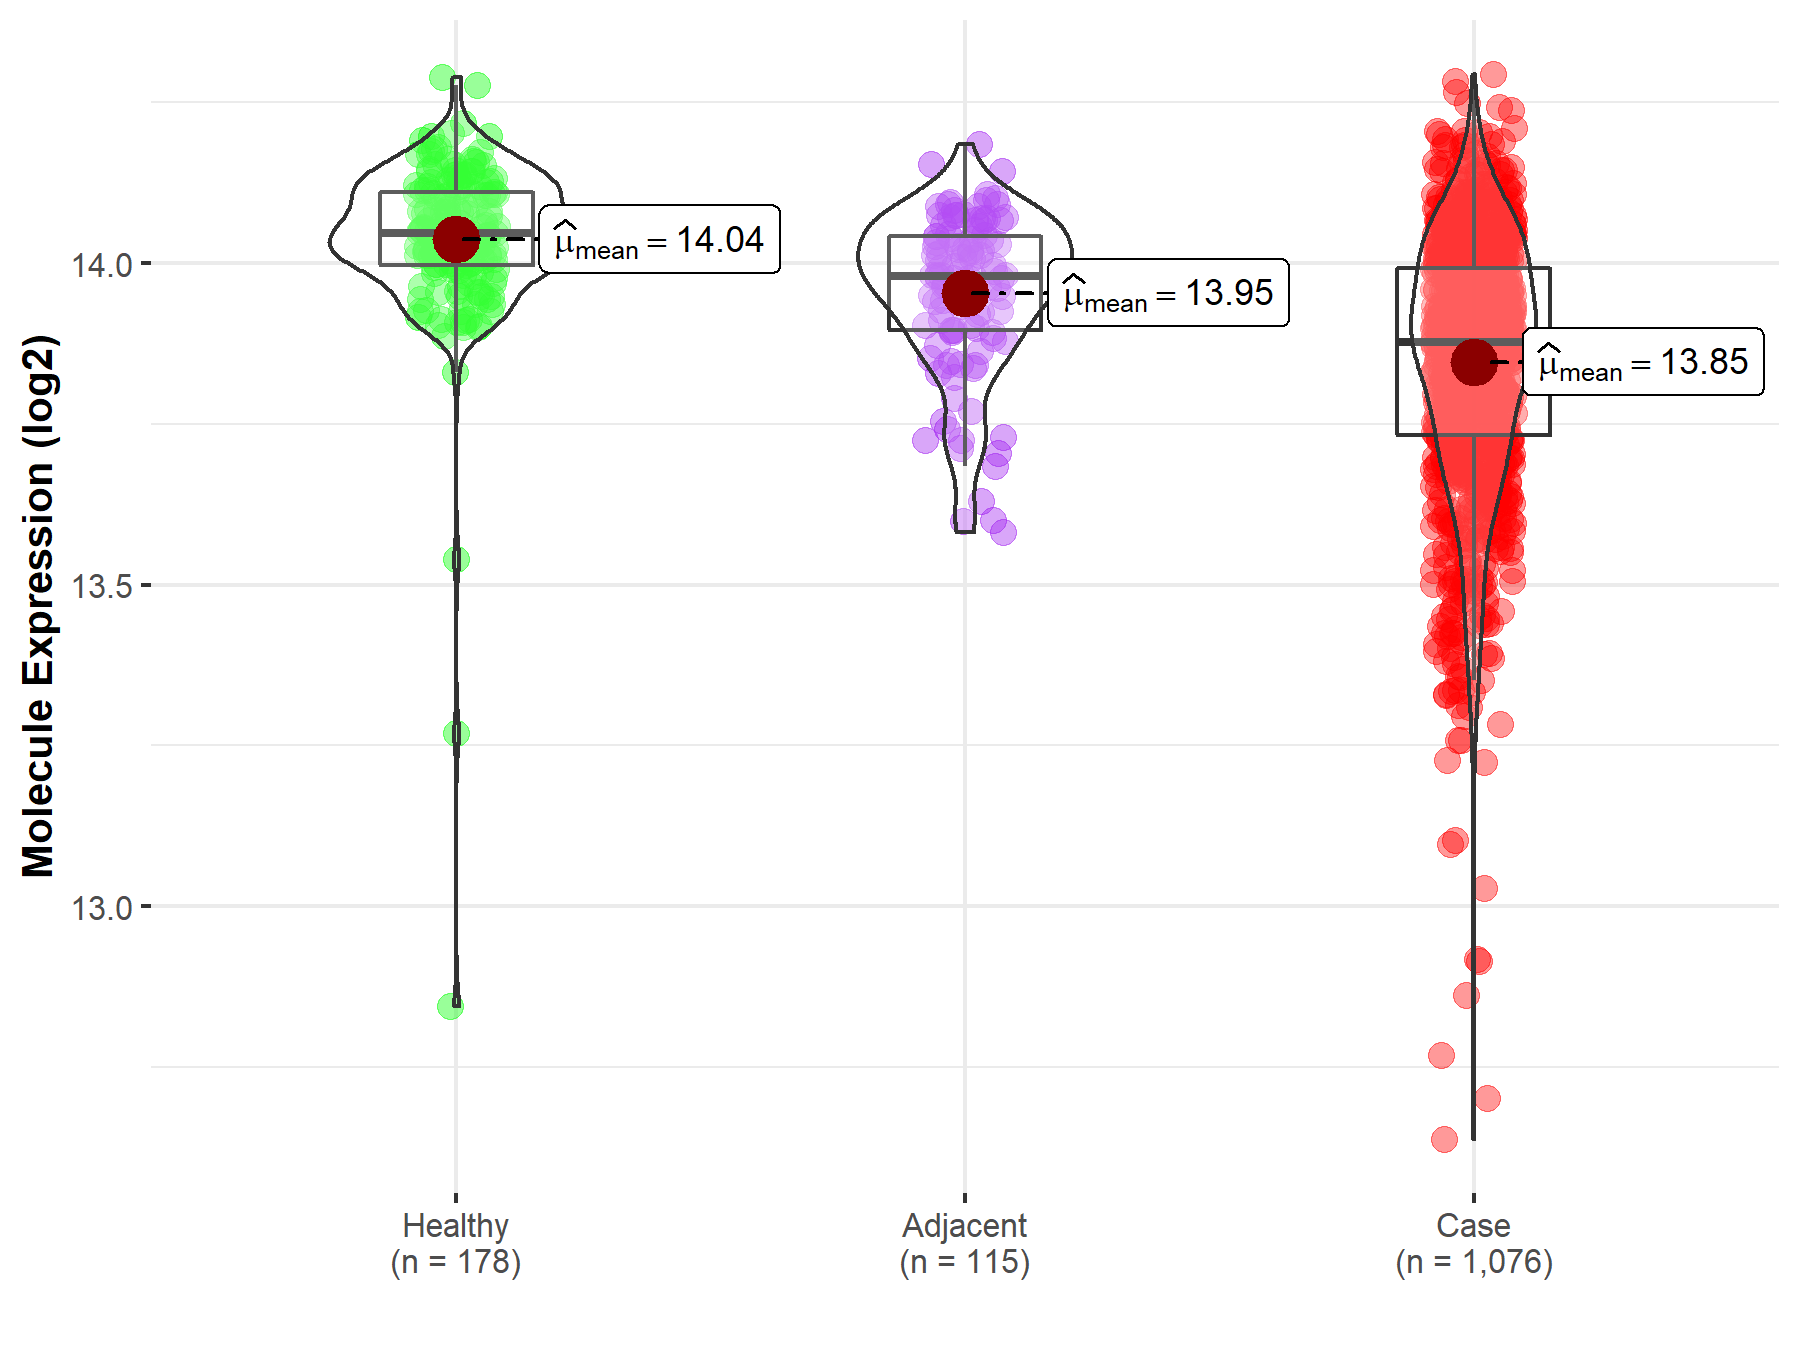
|
Click to View the Clearer Original Diagram |
References
If you find any error in data or bug in web service, please kindly report it to Dr. Sun and Dr. Yu.