Molecule Information
General Information of the Molecule (ID: Mol00654)
| Name |
Signal transducer activator transcription 5B (STAT5B)
,Homo sapiens
|
||||
|---|---|---|---|---|---|
| Molecule Type |
Protein
|
||||
| Gene Name |
STAT5B
|
||||
| Gene ID | |||||
| Location |
chr17:42199177-42276707[-]
|
||||
| Sequence |
MAVWIQAQQLQGEALHQMQALYGQHFPIEVRHYLSQWIESQAWDSVDLDNPQENIKATQL
LEGLVQELQKKAEHQVGEDGFLLKIKLGHYATQLQNTYDRCPMELVRCIRHILYNEQRLV REANNGSSPAGSLADAMSQKHLQINQTFEELRLVTQDTENELKKLQQTQEYFIIQYQESL RIQAQFGPLAQLSPQERLSRETALQQKQVSLEAWLQREAQTLQQYRVELAEKHQKTLQLL RKQQTIILDDELIQWKRRQQLAGNGGPPEGSLDVLQSWCEKLAEIIWQNRQQIRRAEHLC QQLPIPGPVEEMLAEVNATITDIISALVTSTFIIEKQPPQVLKTQTKFAATVRLLVGGKL NVHMNPPQVKATIISEQQAKSLLKNENTRNDYSGEILNNCCVMEYHQATGTLSAHFRNMS LKRIKRSDRRGAESVTEEKFTILFESQFSVGGNELVFQVKTLSLPVVVIVHGSQDNNATA TVLWDNAFAEPGRVPFAVPDKVLWPQLCEALNMKFKAEVQSNRGLTKENLVFLAQKLFNN SSSHLEDYSGLSVSWSQFNRENLPGRNYTFWQWFDGVMEVLKKHLKPHWNDGAILGFVNK QQAHDLLINKPDGTFLLRFSDSEIGGITIAWKFDSQERMFWNLMPFTTRDFSIRSLADRL GDLNYLIYVFPDRPKDEVYSKYYTPVPCESATAKAVDGYVKPQIKQVVPEFVNASADAGG GSATYMDQAPSPAVCPQAHYNMYPQNPDSVLDTDGDFDLEDTMDVARRVEELLGRPMDSQ WIPHAQS Click to Show/Hide
|
||||
| 3D-structure |
|
||||
| Function |
Carries out a dual function: signal transduction and activation of transcription. Mediates cellular responses to the cytokine KITLG/SCF and other growth factors. Binds to the GAS element and activates PRL-induced transcription. Positively regulates hematopoietic/erythroid differentiation.
Click to Show/Hide
|
||||
| Uniprot ID | |||||
| Ensembl ID | |||||
| HGNC ID | |||||
| Click to Show/Hide the Complete Species Lineage | |||||
Type(s) of Resistant Mechanism of This Molecule
 UAPP: Unusual Activation of Pro-survival Pathway
Drug Resistance Data Categorized by Drug
Approved Drug(s)
1 drug(s) in total
| Drug Sensitivity Data Categorized by Their Corresponding Mechanisms | ||||
|
Unusual Activation of Pro-survival Pathway (UAPP)
|
||||
| Disease Class: Breast cancer [ICD-11: 2C60.3] | [1] | |||
| Sensitive Disease | Breast cancer [ICD-11: 2C60.3] | |||
| Sensitive Drug | Cisplatin | |||
| Molecule Alteration | Expression | Down-regulation |
||
| Differential expression of the molecule in resistant disease | ||||
| Classification of Disease | Breast cancer [ICD-11: 2C60] | |||
| The Specified Disease | Breast cancer | |||
| The Studied Tissue | Breast tissue | |||
| The Expression Level of Disease Section Compare with the Healthy Individual Tissue | p-value: 5.95E-09 Fold-change: -4.23E-02 Z-score: -5.96E+00 |
|||
| Experimental Note | Revealed Based on the Cell Line Data | |||
| Cell Pathway Regulation | Cell apoptosis | Activation | hsa04210 | |
| Cell invasion | Inhibition | hsa05200 | ||
| Cell migration | Inhibition | hsa04670 | ||
| In Vitro Model | Hs-578T cells | Breast | Homo sapiens (Human) | CVCL_0332 |
| Experiment for Molecule Alteration |
Western blot analysis | |||
| Experiment for Drug Resistance |
Acid phosphatase assay | |||
| Mechanism Description | When delivered directly by transfection the STAT5B and Hsp90 expression levels were reduced, but response to anti-Hsp90 drugs was not augmented. However, cellular growth was reduced and cisplatin-induced apoptosis was (+). Delivery via miR-134-enriched EVs also reduced STAT5B and Hsp90 expression, had no apparent effects on proliferation, but cellular migration and invasion were reduced and sensitivity to anti-Hsp90 drugs was (+). | |||
Disease- and Tissue-specific Abundances of This Molecule
ICD Disease Classification 02

| Differential expression of molecule in resistant diseases | ||
| The Studied Tissue | Breast tissue | |
| The Specified Disease | Breast cancer | |
| The Expression Level of Disease Section Compare with the Healthy Individual Tissue | p-value: 5.95E-09; Fold-change: -2.40E-01; Z-score: -4.49E-01 | |
| The Expression Level of Disease Section Compare with the Adjacent Tissue | p-value: 1.02E-01; Fold-change: -1.81E-01; Z-score: -3.26E-01 | |
|
Molecule expression in the normal tissue adjacent to the diseased tissue of patients
Molecule expression in the diseased tissue of patients
Molecule expression in the normal tissue of healthy individuals
|
||
| Disease-specific Molecule Abundances |
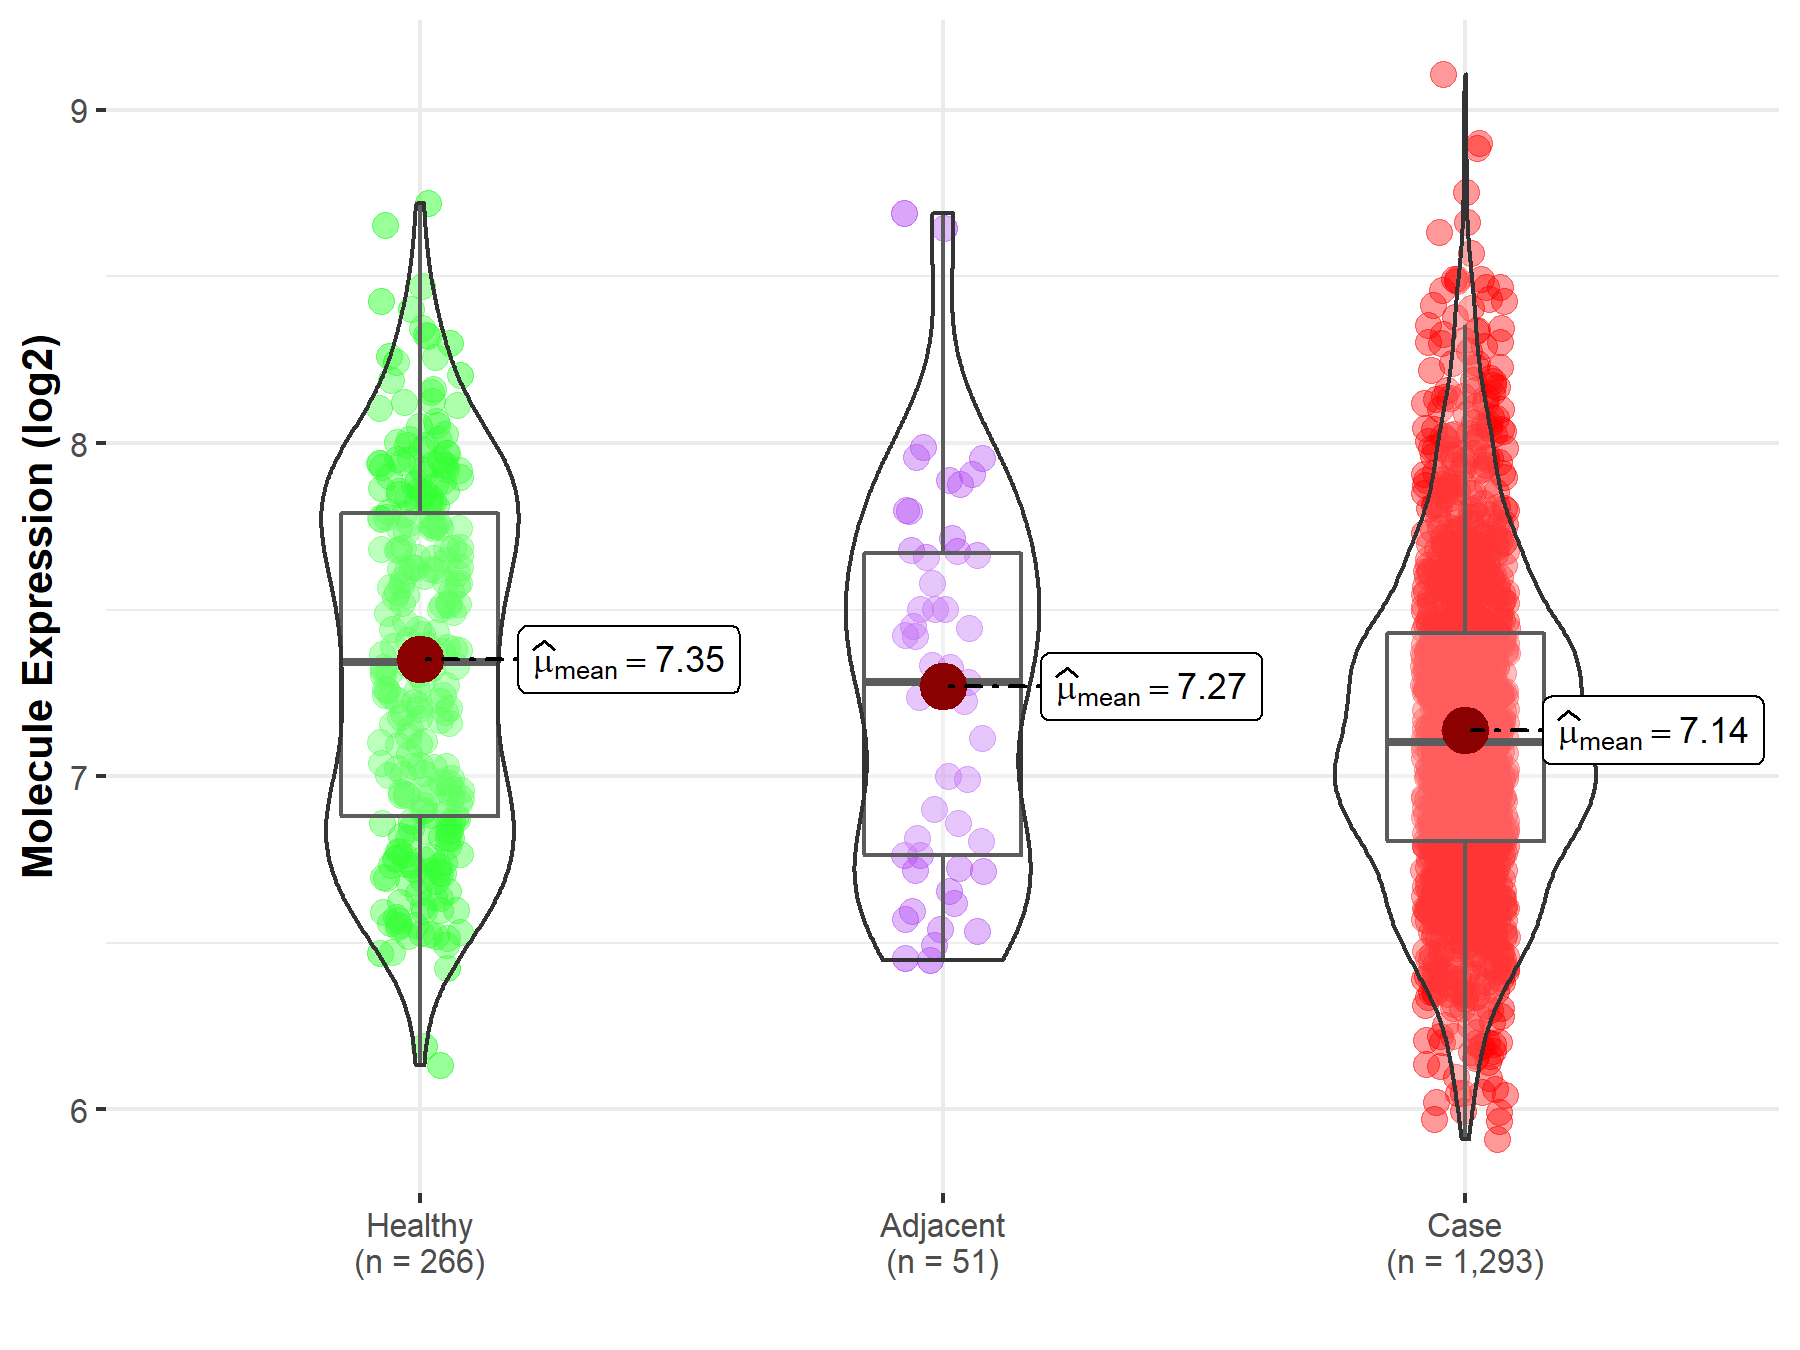
|
Click to View the Clearer Original Diagram |
Tissue-specific Molecule Abundances in Healthy Individuals

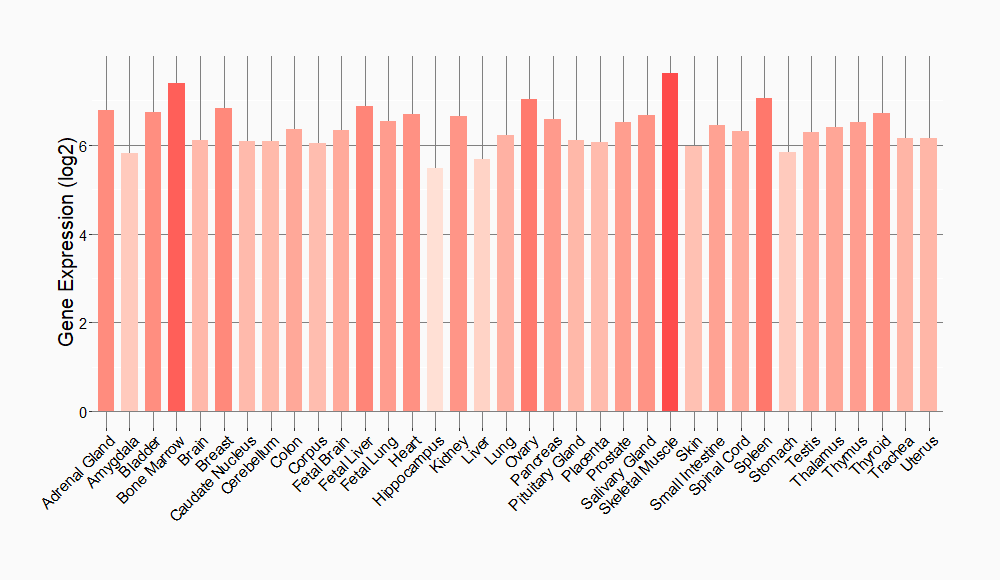
|
||
References
If you find any error in data or bug in web service, please kindly report it to Dr. Sun and Dr. Yu.