Molecule Information
General Information of the Molecule (ID: Mol00606)
| Name |
Rho-related GTP-binding protein RhoE (RND3)
,Homo sapiens
|
||||
|---|---|---|---|---|---|
| Synonyms |
Protein MemB; Rho family GTPase 3; Rho-related GTP-binding protein Rho8; Rnd3; ARHE; RHO8; RHOE
Click to Show/Hide
|
||||
| Molecule Type |
Protein
|
||||
| Gene Name |
RND3
|
||||
| Gene ID | |||||
| Location |
chr2:150468195-150539011[-]
|
||||
| Sequence |
MKERRASQKLSSKSIMDPNQNVKCKIVVVGDSQCGKTALLHVFAKDCFPENYVPTVFENY
TASFEIDTQRIELSLWDTSGSPYYDNVRPLSYPDSDAVLICFDISRPETLDSVLKKWKGE IQEFCPNTKMLLVGCKSDLRTDVSTLVELSNHRQTPVSYDQGANMAKQIGAATYIECSAL QSENSVRDIFHVATLACVNKTNKNVKRNKSQRATKRISHMPSRPELSAVATDLRKDKAKS CTVM Click to Show/Hide
|
||||
| 3D-structure |
|
||||
| Function |
Binds GTP but lacks intrinsic GTPase activity and is resistant to Rho-specific GTPase-activating proteins.
Click to Show/Hide
|
||||
| Uniprot ID | |||||
| Ensembl ID | |||||
| HGNC ID | |||||
| Click to Show/Hide the Complete Species Lineage | |||||
Type(s) of Resistant Mechanism of This Molecule
 UAPP: Unusual Activation of Pro-survival Pathway
Drug Resistance Data Categorized by Drug
Approved Drug(s)
1 drug(s) in total
| Drug Resistance Data Categorized by Their Corresponding Mechanisms | ||||
|
Unusual Activation of Pro-survival Pathway (UAPP)
|
||||
| Disease Class: Lung cancer [ICD-11: 2C25.5] | [1] | |||
| Resistant Disease | Lung cancer [ICD-11: 2C25.5] | |||
| Resistant Drug | Cisplatin | |||
| Molecule Alteration | Expression | Up-regulation |
||
| Differential expression of the molecule in resistant disease | ||||
| Classification of Disease | Lung cancer [ICD-11: 2C25] | |||
| The Specified Disease | Lung cancer | |||
| The Studied Tissue | Lung tissue | |||
| The Expression Level of Disease Section Compare with the Healthy Individual Tissue | p-value: 8.89E-02 Fold-change: 9.03E-02 Z-score: 1.71E+00 |
|||
| Experimental Note | Revealed Based on the Cell Line Data | |||
| Cell Pathway Regulation | Cell apoptosis | Inhibition | hsa04210 | |
| Cell invasion | Activation | hsa05200 | ||
| Cell migration | Activation | hsa04670 | ||
| Cell proliferation | Activation | hsa05200 | ||
| TGF-beta/Smad2/STAT3/STAT5 signaling pathway | Activation | hsa04350 | ||
| In Vitro Model | A549 cells | Lung | Homo sapiens (Human) | CVCL_0023 |
| Experiment for Molecule Alteration |
Western blot analysis | |||
| Experiment for Drug Resistance |
MTS assay; Flow cytometry assay | |||
| Mechanism Description | miR-10a had an important role in promoting drug resistance in tumors through enhancing drug efflux and inhibiting apoptosis via upregulation of MDR1, MRP1 and RhoE expression. In addition, miR-10a promoted the expression of TGF-beta as wells as regulated the activity of the Smad2/STAT3/STAT5 pathway and its downstream transcriptional factors of HIF and eIF4E, which may be the potential mechanism of drug resistance in A549 cells. Therefore, miR-10a may be an important drug target for improving cancer treatment; however, further studies are required to explore the clinical applications of miR-10a inhibitors. | |||
| Drug Sensitivity Data Categorized by Their Corresponding Mechanisms | ||||
|
Unusual Activation of Pro-survival Pathway (UAPP)
|
||||
| Disease Class: Gastric cancer [ICD-11: 2B72.1] | [2] | |||
| Sensitive Disease | Gastric cancer [ICD-11: 2B72.1] | |||
| Sensitive Drug | Cisplatin | |||
| Molecule Alteration | Expression | Down-regulation |
||
| Experimental Note | Identified from the Human Clinical Data | |||
| In Vitro Model | SGC7901 cells | Gastric | Homo sapiens (Human) | CVCL_0520 |
| Experiment for Molecule Alteration |
Western blot analysis | |||
| Experiment for Drug Resistance |
MTT assay | |||
| Mechanism Description | The knockdown of RhoE enhanced the sensitivity of SGC7901/DDP cells and changed expres-sion of some genes. Transfection of pre-miR-200c reduces RhoEexpression. miRNA-200cregulated the sensitivity of chemotherapy to cisplatin(DDP) in gastric cancer by possibly targeting RhoE. | |||
Disease- and Tissue-specific Abundances of This Molecule
ICD Disease Classification 02

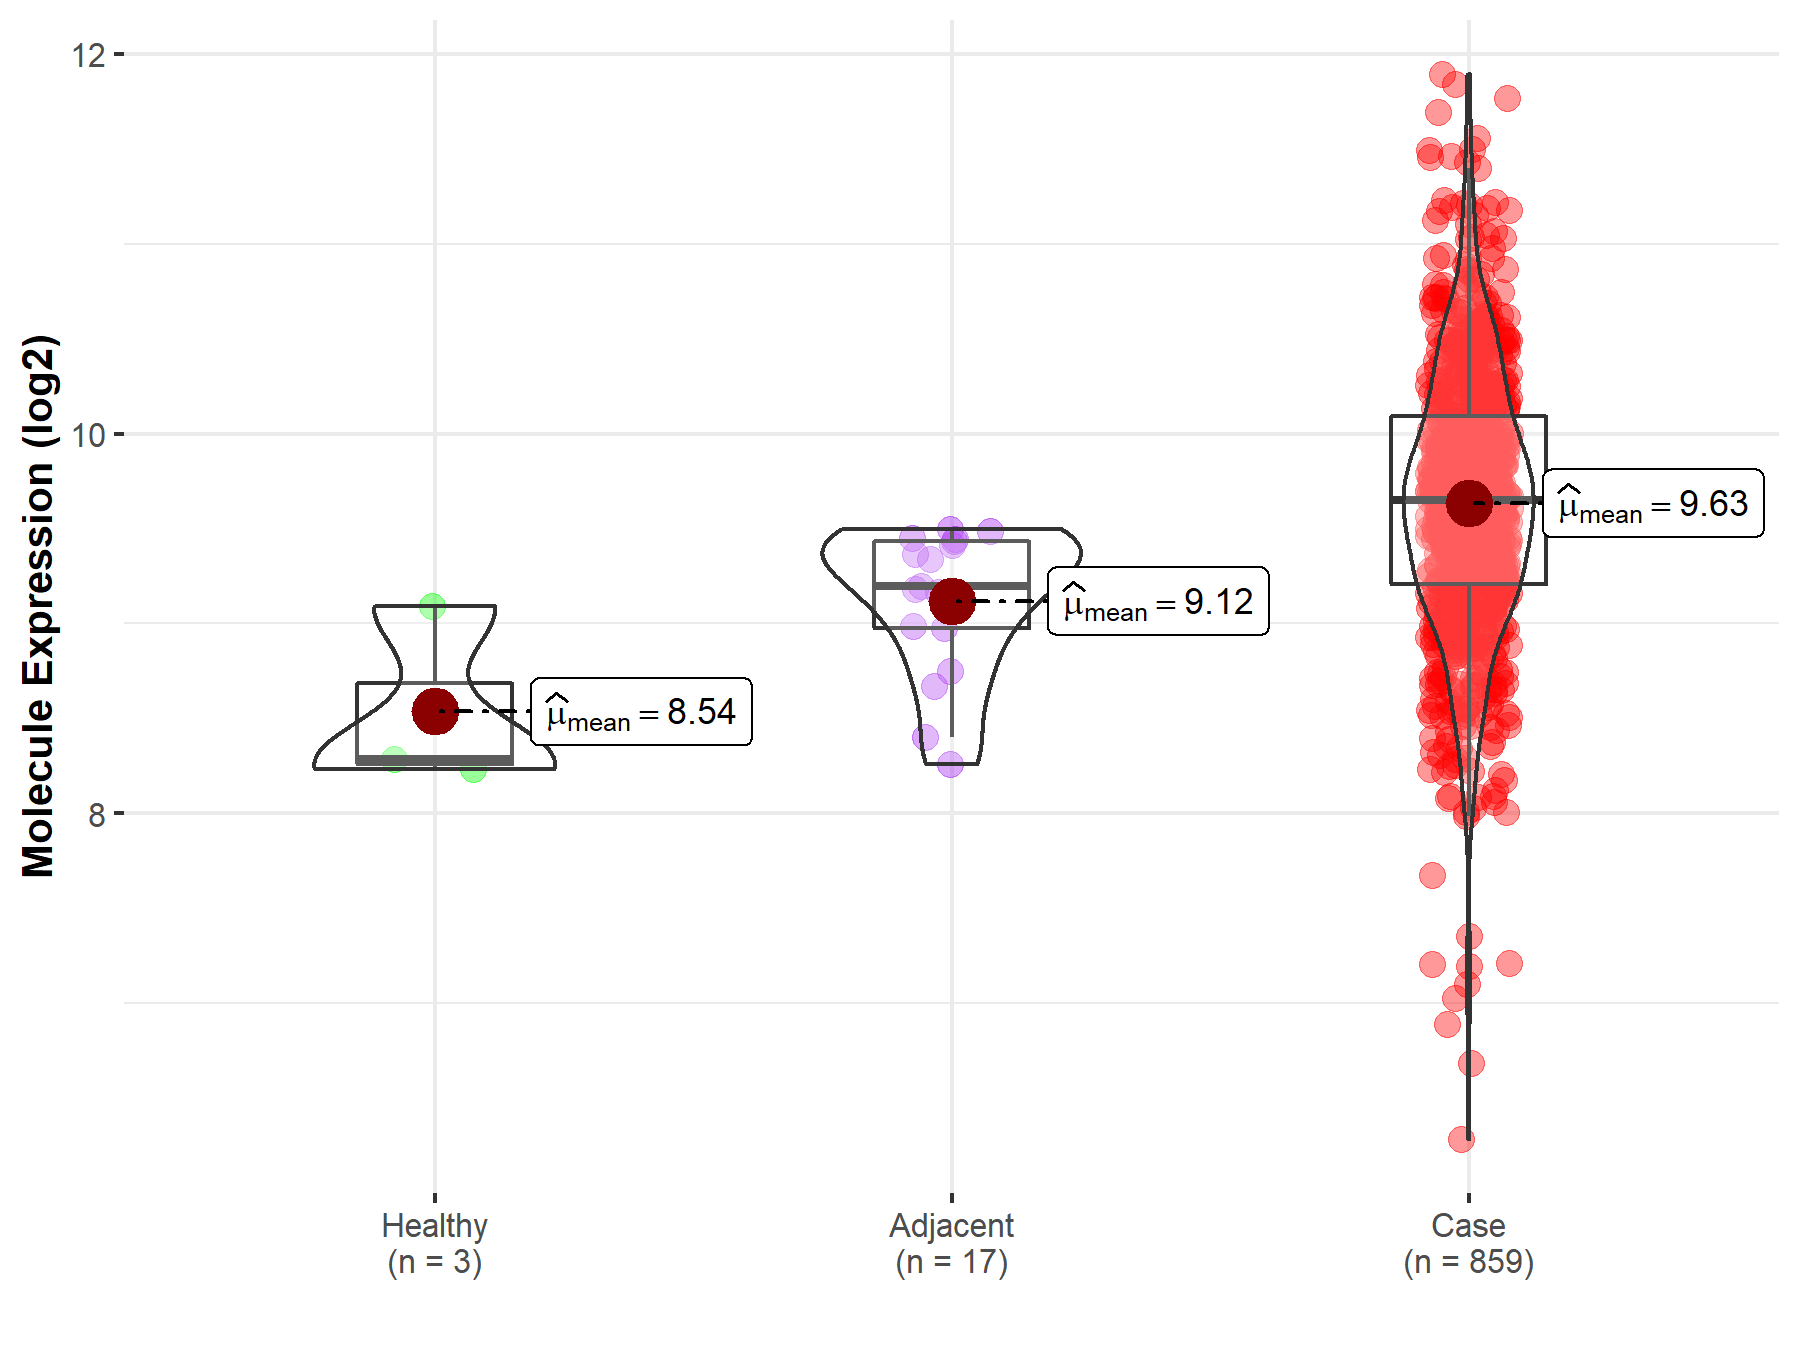
| Differential expression of molecule in resistant diseases | ||
| The Studied Tissue | Gastric tissue | |
| The Specified Disease | Gastric cancer | |
| The Expression Level of Disease Section Compare with the Healthy Individual Tissue | p-value: 5.76E-02; Fold-change: 1.37E+00; Z-score: 2.83E+00 | |
| The Expression Level of Disease Section Compare with the Adjacent Tissue | p-value: 4.91E-05; Fold-change: 4.51E-01; Z-score: 1.16E+00 | |
|
Molecule expression in the normal tissue adjacent to the diseased tissue of patients
Molecule expression in the diseased tissue of patients
Molecule expression in the normal tissue of healthy individuals
|
||
| Disease-specific Molecule Abundances |
|
Click to View the Clearer Original Diagram |
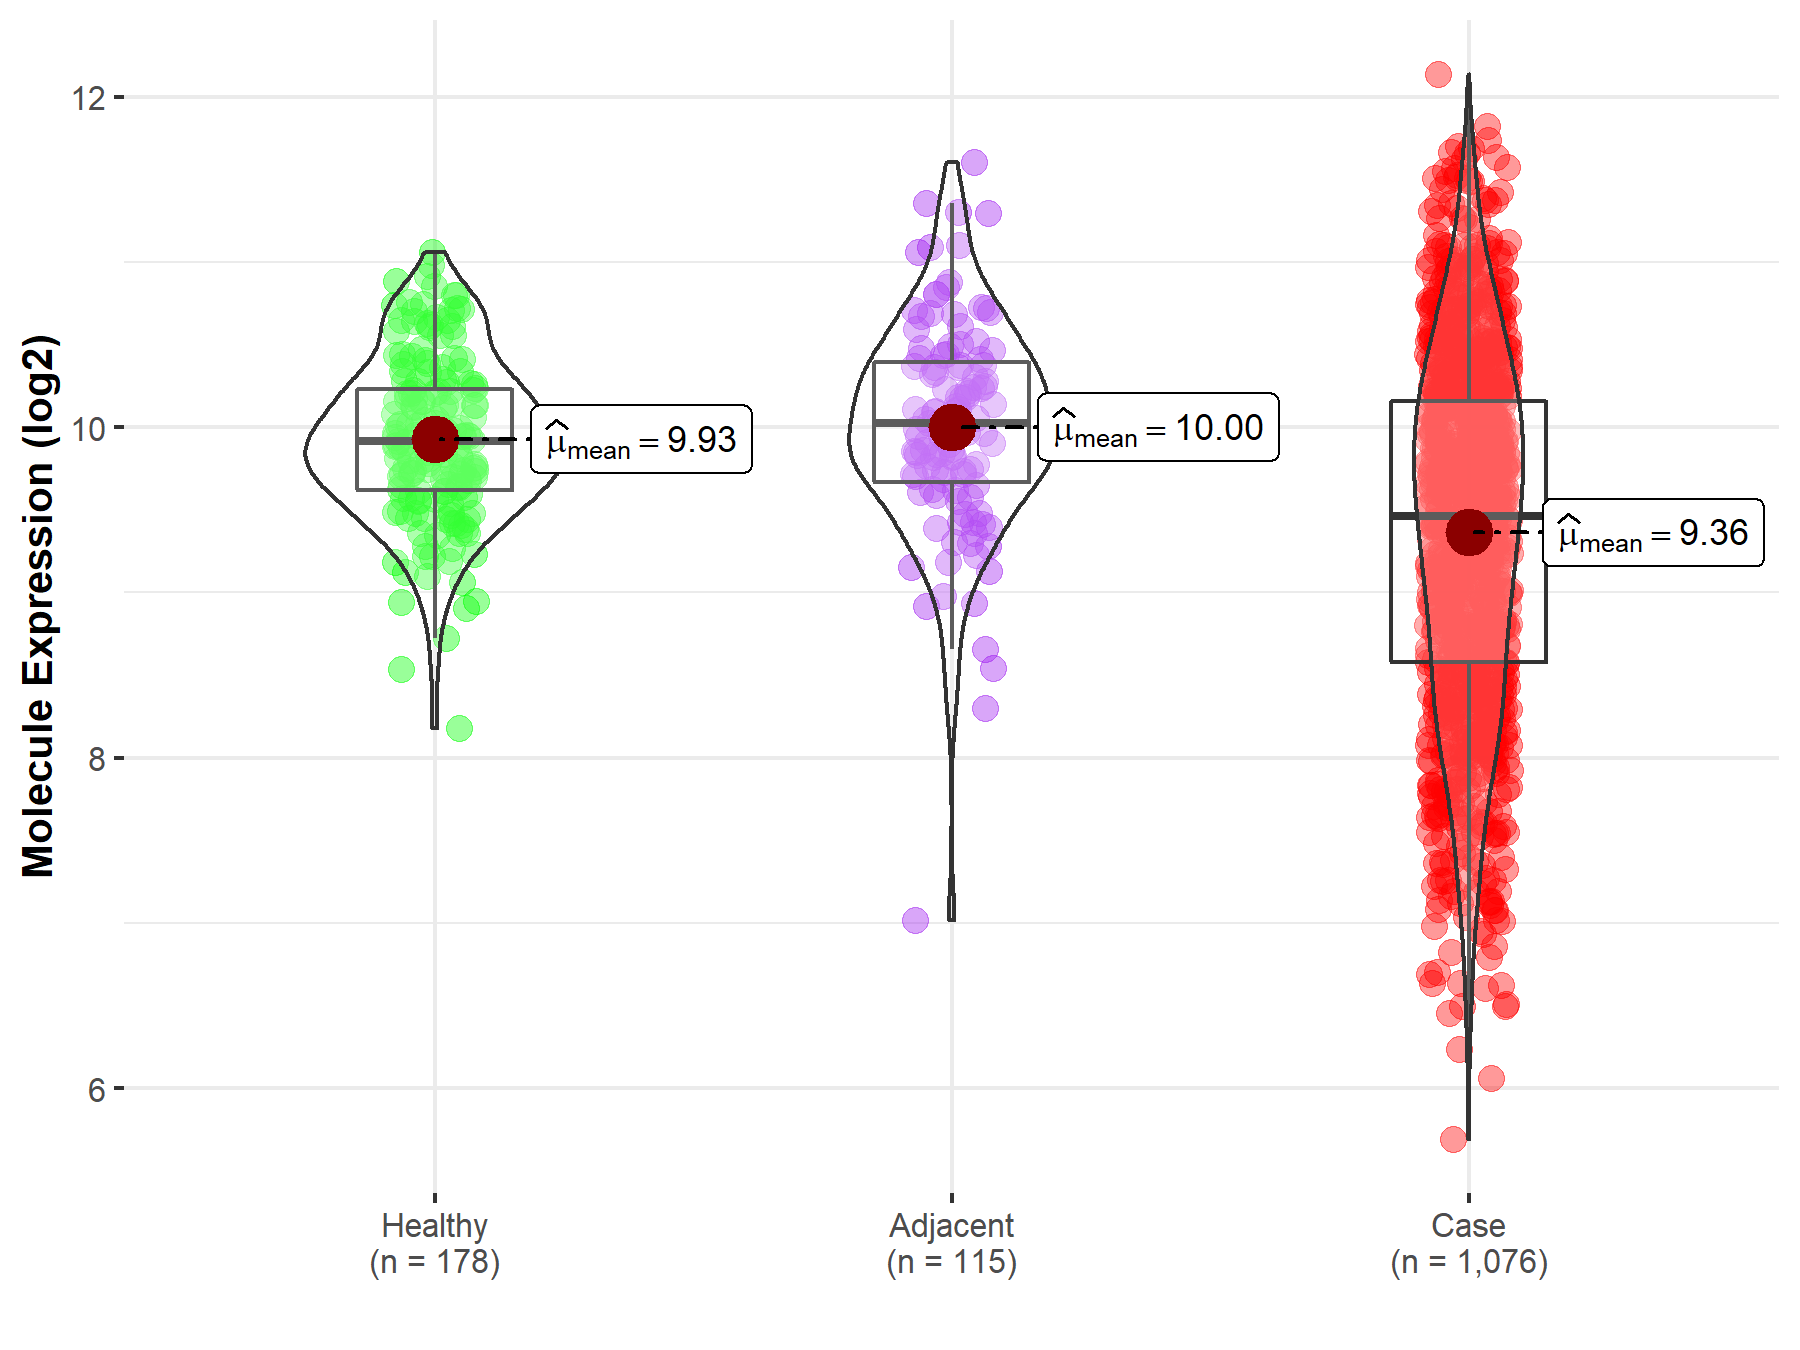
| Differential expression of molecule in resistant diseases | ||
| The Studied Tissue | Lung | |
| The Specified Disease | Lung cancer | |
| The Expression Level of Disease Section Compare with the Healthy Individual Tissue | p-value: 9.01E-27; Fold-change: -4.54E-01; Z-score: -9.17E-01 | |
| The Expression Level of Disease Section Compare with the Adjacent Tissue | p-value: 1.25E-16; Fold-change: -5.64E-01; Z-score: -8.52E-01 | |
|
Molecule expression in the normal tissue adjacent to the diseased tissue of patients
Molecule expression in the diseased tissue of patients
Molecule expression in the normal tissue of healthy individuals
|
||
| Disease-specific Molecule Abundances |
|
Click to View the Clearer Original Diagram |
Tissue-specific Molecule Abundances in Healthy Individuals

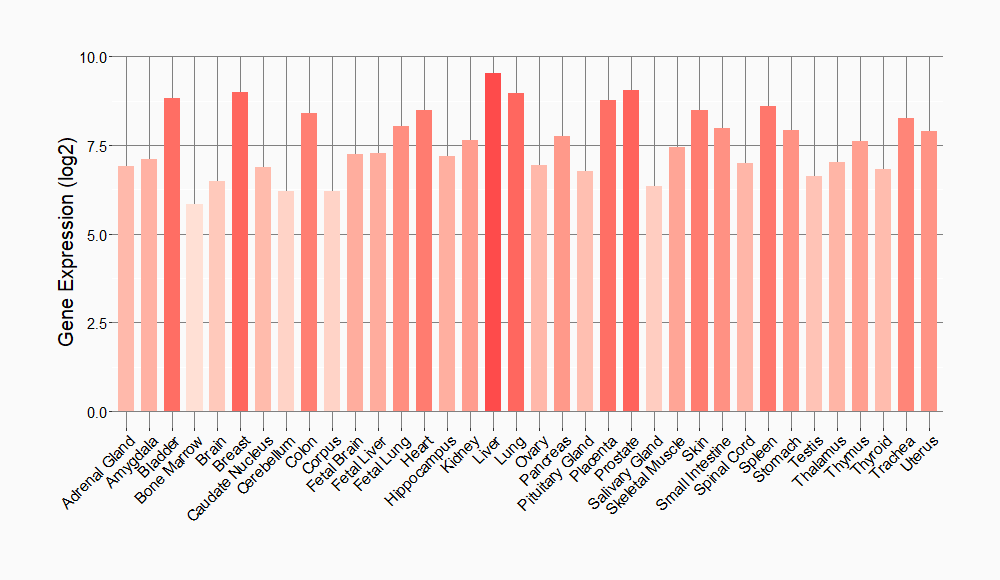
|
||
References
If you find any error in data or bug in web service, please kindly report it to Dr. Sun and Dr. Yu.