Molecule Information
General Information of the Molecule (ID: Mol00431)
| Name |
DNA-binding protein Ikaros (IKZF1)
,Homo sapiens
|
||||
|---|---|---|---|---|---|
| Synonyms |
Ikaros family zinc finger protein 1; Lymphoid transcription factor LyF-1; IK1; IKAROS; LYF1; ZNFN1A1
Click to Show/Hide
|
||||
| Molecule Type |
Protein
|
||||
| Gene Name |
IKZF1
|
||||
| Gene ID | |||||
| Location |
chr7:50304068-50405101[+]
|
||||
| Sequence |
MDADEGQDMSQVSGKESPPVSDTPDEGDEPMPIPEDLSTTSGGQQSSKSDRVVASNVKVE
TQSDEENGRACEMNGEECAEDLRMLDASGEKMNGSHRDQGSSALSGVGGIRLPNGKLKCD ICGIICIGPNVLMVHKRSHTGERPFQCNQCGASFTQKGNLLRHIKLHSGEKPFKCHLCNY ACRRRDALTGHLRTHSVGKPHKCGYCGRSYKQRSSLEEHKERCHNYLESMGLPGTLYPVI KEETNHSEMAEDLCKIGSERSLVLDRLASNVAKRKSSMPQKFLGDKGLSDTPYDSSASYE KENEMMKSHVMDQAINNAINYLGAESLRPLVQTPPGGSEVVPVISPMYQLHKPLAEGTPR SNHSAQDSAVENLLLLSKAKLVPSEREASPSNSCQDSTDTESNNEEQRSGLIYLTNHIAP HARNGLSLKEEHRAYDLLRAASENSQDALRVVSTSGEQMKVYKCEHCRVLFLDHVMYTIH MGCHGFRDPFECNMCGYHSQDRYEFSSHITRGEHRFHMS Click to Show/Hide
|
||||
| 3D-structure |
|
||||
| Function |
Transcription regulator of hematopoietic cell differentiation. Binds gamma-satellite DNA. Plays a role in the development of lymphocytes, B- and T-cells. Binds and activates the enhancer (delta-A element) of the CD3-delta gene. Repressor of the TDT (fikzfterminal deoxynucleotidyltransferase) gene during thymocyte differentiation. Regulates transcription through association with both HDAC-dependent and HDAC-independent complexes. Targets the 2 chromatin-remodeling complexes, NuRD and BAF (SWI/SNF), in a single complex (PYR complex), to the beta-globin locus in adult erythrocytes. Increases normal apoptosis in adult erythroid cells. Confers early temporal competence to retinal progenitor cells (RPCs). Function is isoform-specific and is modulated by dominant-negative inactive isoforms.
Click to Show/Hide
|
||||
| Uniprot ID | |||||
| Ensembl ID | |||||
| HGNC ID | |||||
| Click to Show/Hide the Complete Species Lineage | |||||
Type(s) of Resistant Mechanism of This Molecule
 ADTT: Aberration of the Drug's Therapeutic Target
 UAPP: Unusual Activation of Pro-survival Pathway
Drug Resistance Data Categorized by Drug
Approved Drug(s)
3 drug(s) in total
| Drug Resistance Data Categorized by Their Corresponding Mechanisms | ||||
|
Unusual Activation of Pro-survival Pathway (UAPP)
|
||||
| Disease Class: Multiple myeloma [ICD-11: 2A83.0] | [1] | |||
| Resistant Disease | Multiple myeloma [ICD-11: 2A83.0] | |||
| Resistant Drug | Lenalidomide | |||
| Molecule Alteration | Mutation | . |
||
| Experimental Note | Identified from the Human Clinical Data | |||
| Cell Pathway Regulation | Cell proliferation | Activation | hsa05200 | |
| PI3K/RAS signaling pathway | Regulation | N.A. | ||
| In Vitro Model | Bone marrow | Blood | Homo sapiens (Human) | N.A. |
| In Vivo Model | A retrospective survey in conducting clinical studies | Homo sapiens | ||
| Experiment for Molecule Alteration |
Gene expression profiling assay; High-resolution copy number arrays assay; Whole-exome sequencing assay | |||
| Experiment for Drug Resistance |
Longitudinal copy number aberration (CNA) analysis | |||
| Mechanism Description | Resistance to immunomodulatory drugs (IMiD) and proteasome inhibitors was recently associated with mutations in IMiD response genes IRF4, CRBN, DDB1, CUL4A, CUL4B, IkZF1, IkZF2, and IkZF3 or in the proteasome inhibitor response genes PSMB5 and PSMG2, respectively. Mechanistically, bi-allelic loss of tumor-suppressor genes is a crucial mechanism, allowing units of selection to evade treatment-induced apoptosis with the acquisition of subsequent proliferative advantage leading to their outgrowth. | |||
| Drug Sensitivity Data Categorized by Their Corresponding Mechanisms | ||||
|
Aberration of the Drug's Therapeutic Target (ADTT)
|
||||
| Disease Class: Epstein-barr virus (ebv) infection [ICD-11: XN0R2] | [2] | |||
| Sensitive Disease | Epstein-barr virus (ebv) infection [ICD-11: XN0R2] | |||
| Sensitive Drug | Pomalidomide | |||
| Molecule Alteration | Expression | Down-regulation |
||
| Experimental Note | Revealed Based on the Cell Line Data | |||
| Cell Pathway Regulation | PI3K/AKT signaling pathway | Activation | hsa04151 | |
| In Vitro Model | Daudi cells | Peripheral blood | Homo sapiens (Human) | CVCL_0008 |
| Namalwa cells | Lymphoid | Homo sapiens (Human) | CVCL_0067 | |
| EBV-negative BL41 cells | Lymphoid | Homo sapiens (Human) | N.A. | |
| EBV-positive BL41 cells | Lymphoid | Homo sapiens (Human) | N.A. | |
| BCBL-1 cells | Peritoneal fluid | Homo sapiens (Human) | CVCL_0165 | |
| JSC-1 cells | Lymphoid | Homo sapiens (Human) | CVCL_3728 | |
| PBMCs cells | Blood | Homo sapiens (Human) | N.A. | |
| BC-2 cells | N.A. | Homo sapiens (Human) | CVCL_1856 | |
| HUVEC-C cells | N.A. | Homo sapiens (Human) | CVCL_2959 | |
| U937 cells | Blood | Homo sapiens (Human) | CVCL_0007 | |
| Experiment for Molecule Alteration |
Flow cytometry; Immunoblotting assay; Cytokine/Chemokine analysis; RT-qPCR; Chromatin immunoprecipitation assay | |||
| Experiment for Drug Resistance |
Cell activation assay | |||
| Mechanism Description | Pom increased B7-2/CD86 mRNA, protein, and surface expression in EBV-infected cells but this was virtually eliminated in EBV-infected cells made resistant to Pom-induced cytostatic effects. This indicates that Pom initiates the upregulation of these markers by interacting with its target, cereblon. Interestingly, Pom increased the proinflammatory cytokines IP-10 and MIP-1alpha/beta in EBV infected cells, supporting a possible role for the phosphoinositide 3-kinase (PI3K)/AKT pathway in Pom's effects. Idelalisib, an inhibitor of the delta subunit of PI3 Kinase, blocked AKT-Ser phosphorylation and Pom-induced B7-2 surface expression. PU.1 is a downstream target for AKT that is expressed in EBV-infected cells. Pom treatment led to an increase in PU.1 binding to the B7-2 promoter based on ChIP analysis. Thus, our data indicates Pom acts through cereblon leading to degradation of Ikaros and activation of the PI3K/AKT/PU.1 pathway resulting in upregulation of B7-2 mRNA and protein expression. The increased immune recognition in addition to the increases in proinflammatory cytokines upon Pom treatment suggests Pom may be useful in the treatment of EBV-positive lymphomas. | |||
| Drug Resistance Data Categorized by Their Corresponding Mechanisms | ||||
|
Unusual Activation of Pro-survival Pathway (UAPP)
|
||||
| Disease Class: Multiple myeloma [ICD-11: 2A83.0] | [1] | |||
| Resistant Disease | Multiple myeloma [ICD-11: 2A83.0] | |||
| Resistant Drug | Thalidomide | |||
| Molecule Alteration | Mutation | . |
||
| Experimental Note | Identified from the Human Clinical Data | |||
| Cell Pathway Regulation | Cell proliferation | Activation | hsa05200 | |
| PI3K/RAS signaling pathway | Regulation | N.A. | ||
| In Vitro Model | Bone marrow | Blood | Homo sapiens (Human) | N.A. |
| In Vivo Model | A retrospective survey in conducting clinical studies | Homo sapiens | ||
| Experiment for Molecule Alteration |
Gene expression profiling assay; High-resolution copy number arrays assay; Whole-exome sequencing assay | |||
| Experiment for Drug Resistance |
Longitudinal copy number aberration (CNA) analysis | |||
| Mechanism Description | Resistance to immunomodulatory drugs (IMiD) and proteasome inhibitors was recently associated with mutations in IMiD response genes IRF4, CRBN, DDB1, CUL4A, CUL4B, IkZF1, IkZF2, and IkZF3 or in the proteasome inhibitor response genes PSMB5 and PSMG2, respectively. Mechanistically, bi-allelic loss of tumor-suppressor genes is a crucial mechanism, allowing units of selection to evade treatment-induced apoptosis with the acquisition of subsequent proliferative advantage leading to their outgrowth. | |||
Disease- and Tissue-specific Abundances of This Molecule
ICD Disease Classification 02

| Differential expression of molecule in resistant diseases | ||
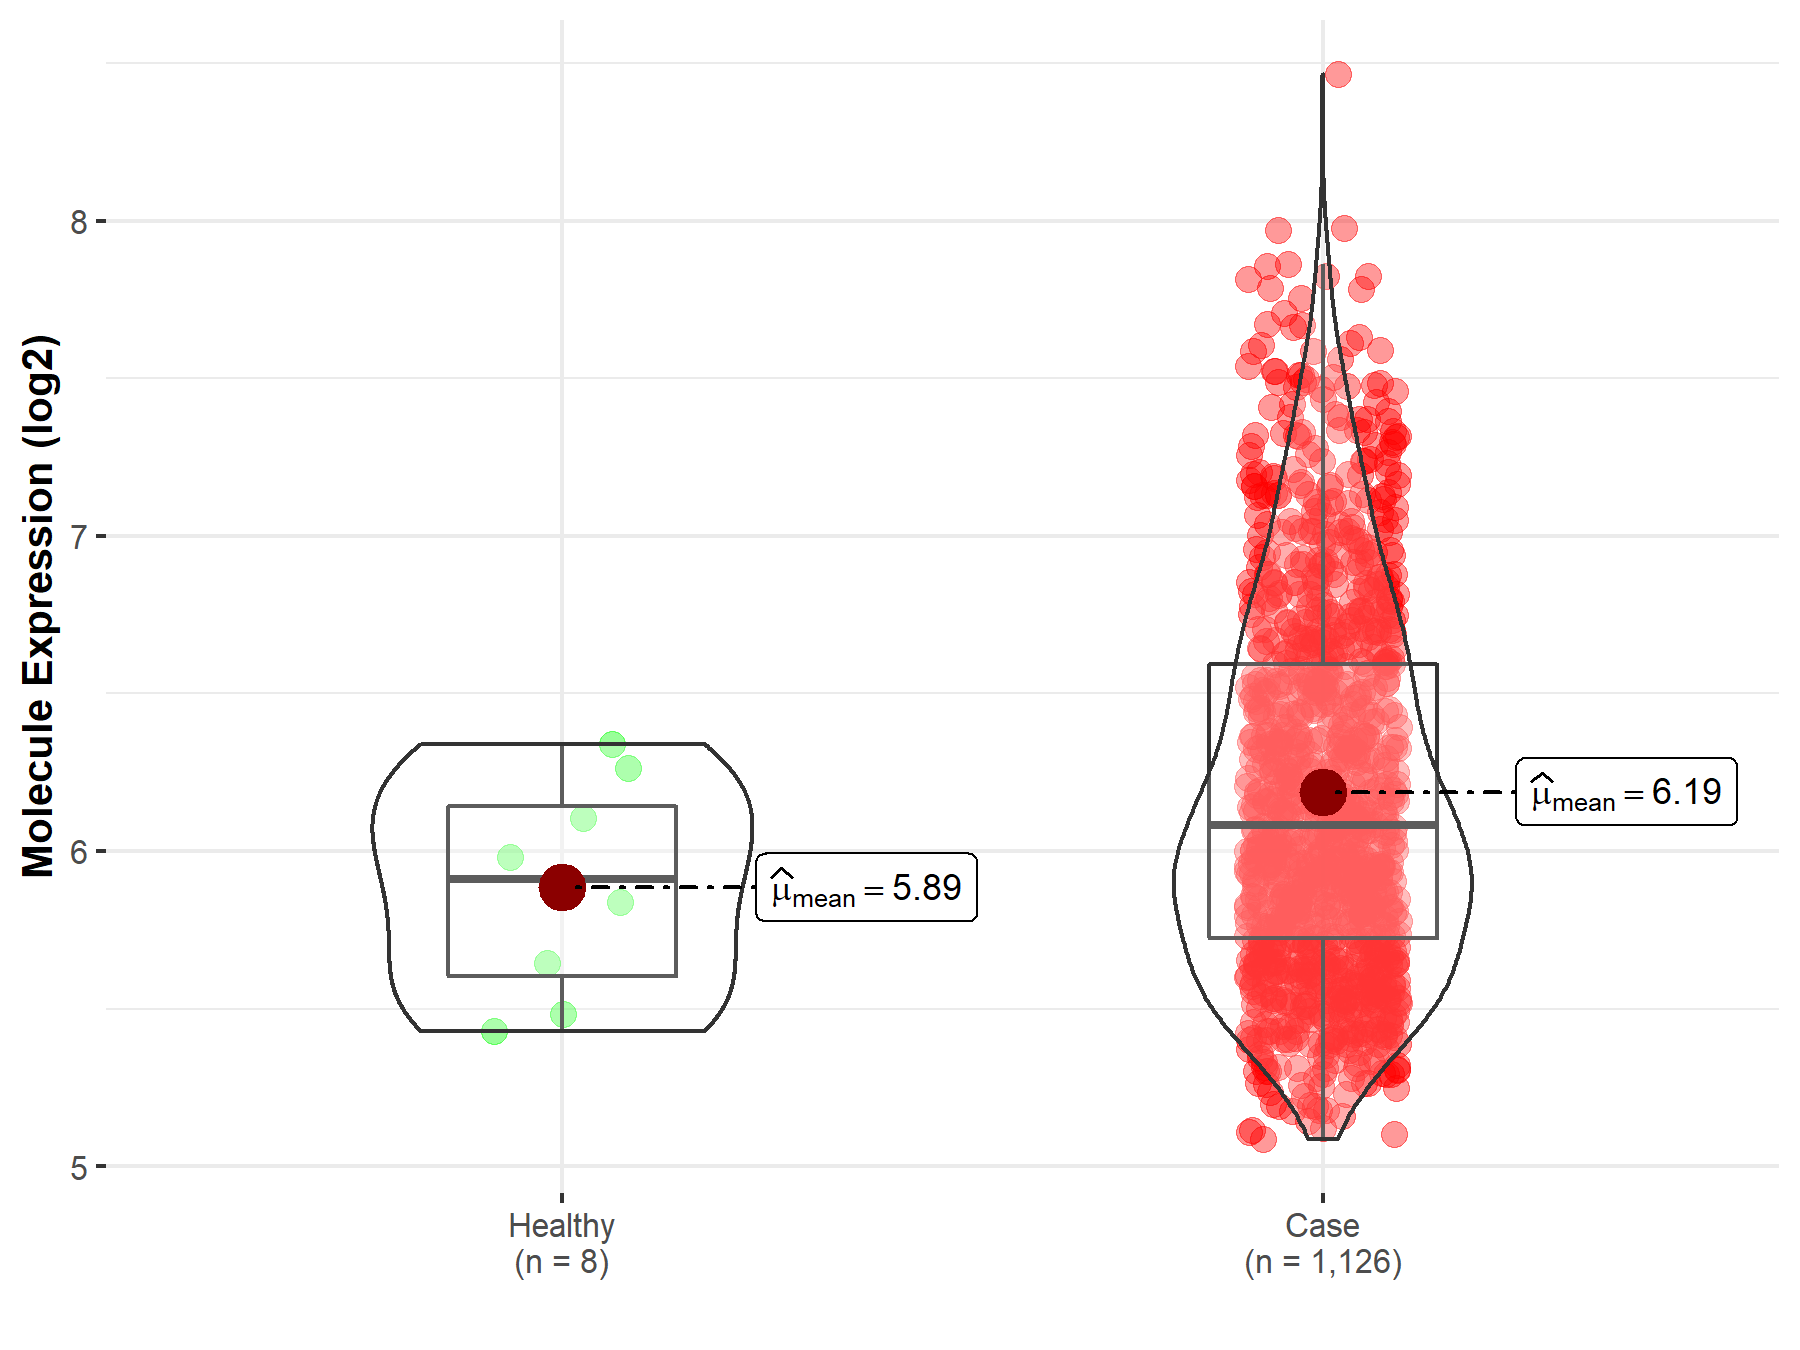
| The Studied Tissue | Bone marrow | |
| The Specified Disease | Multiple myeloma | |
| The Expression Level of Disease Section Compare with the Healthy Individual Tissue | p-value: 4.21E-02; Fold-change: 1.74E-01; Z-score: 5.04E-01 | |
|
Molecule expression in the diseased tissue of patients
Molecule expression in the normal tissue of healthy individuals
|
||
| Disease-specific Molecule Abundances |
|
Click to View the Clearer Original Diagram |
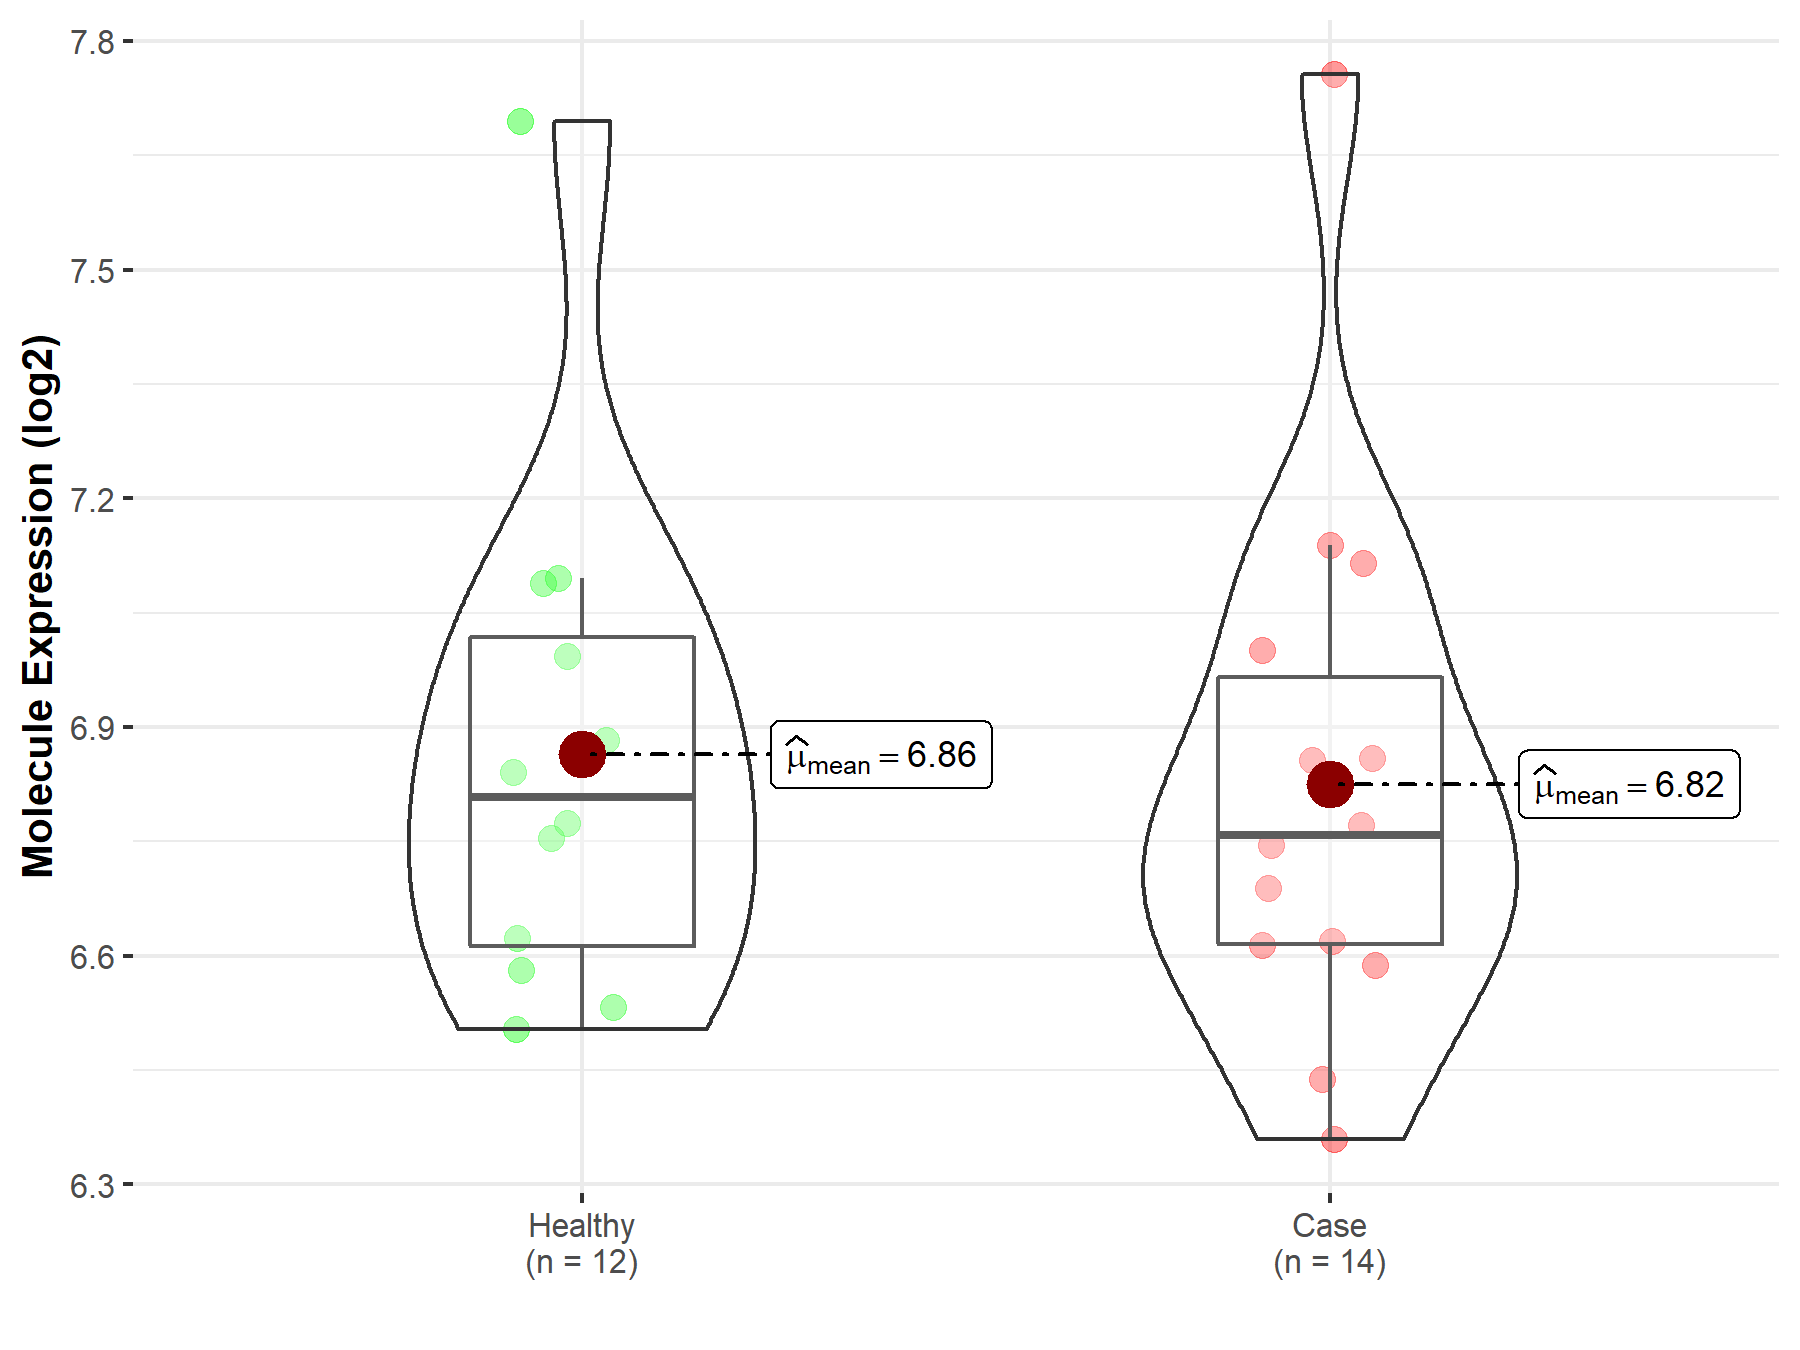
| The Studied Tissue | Peripheral blood | |
| The Specified Disease | Multiple myeloma | |
| The Expression Level of Disease Section Compare with the Healthy Individual Tissue | p-value: 7.75E-01; Fold-change: -4.95E-02; Z-score: -1.49E-01 | |
|
Molecule expression in the diseased tissue of patients
Molecule expression in the normal tissue of healthy individuals
|
||
| Disease-specific Molecule Abundances |
|
Click to View the Clearer Original Diagram |
Tissue-specific Molecule Abundances in Healthy Individuals

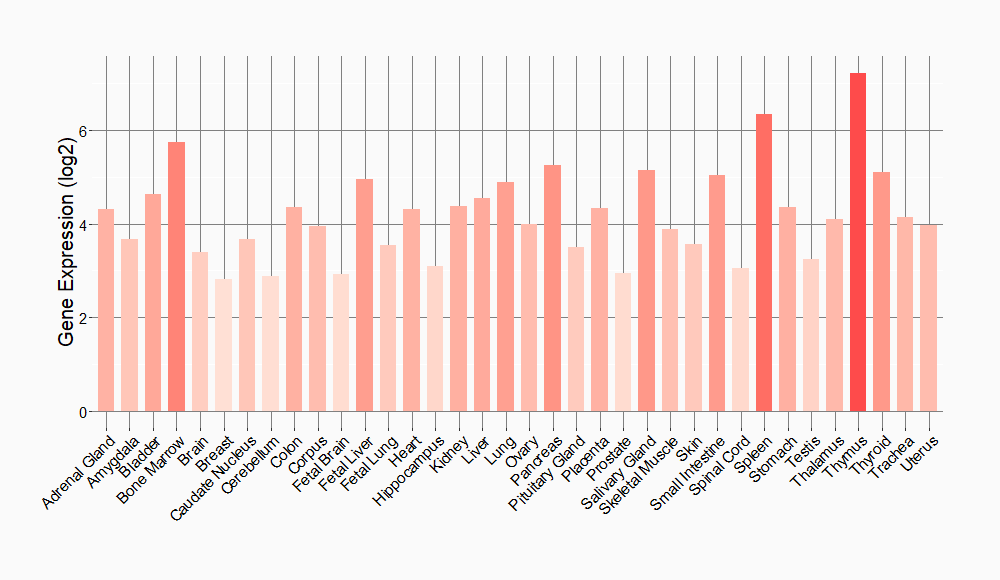
|
||
References
If you find any error in data or bug in web service, please kindly report it to Dr. Sun and Dr. Yu.