Molecule Information
General Information of the Molecule (ID: Mol00421)
| Name |
Hexokinase-1 (HK1)
,Homo sapiens
|
||||
|---|---|---|---|---|---|
| Synonyms |
Brain form hexokinase; Hexokinase type I; HK I; Hexokinase-A
Click to Show/Hide
|
||||
| Molecule Type |
Protein
|
||||
| Gene Name |
HK1
|
||||
| Gene ID | |||||
| Location |
chr10:69269984-69401884[+]
|
||||
| Sequence |
MIAAQLLAYYFTELKDDQVKKIDKYLYAMRLSDETLIDIMTRFRKEMKNGLSRDFNPTAT
VKMLPTFVRSIPDGSEKGDFIALDLGGSSFRILRVQVNHEKNQNVHMESEVYDTPENIVH GSGSQLFDHVAECLGDFMEKRKIKDKKLPVGFTFSFPCQQSKIDEAILITWTKRFKASGV EGADVVKLLNKAIKKRGDYDANIVAVVNDTVGTMMTCGYDDQHCEVGLIIGTGTNACYME ELRHIDLVEGDEGRMCINTEWGAFGDDGSLEDIRTEFDREIDRGSLNPGKQLFEKMVSGM YLGELVRLILVKMAKEGLLFEGRITPELLTRGKFNTSDVSAIEKNKEGLHNAKEILTRLG VEPSDDDCVSVQHVCTIVSFRSANLVAATLGAILNRLRDNKGTPRLRTTVGVDGSLYKTH PQYSRRFHKTLRRLVPDSDVRFLLSESGSGKGAAMVTAVAYRLAEQHRQIEETLAHFHLT KDMLLEVKKRMRAEMELGLRKQTHNNAVVKMLPSFVRRTPDGTENGDFLALDLGGTNFRV LLVKIRSGKKRTVEMHNKIYAIPIEIMQGTGEELFDHIVSCISDFLDYMGIKGPRMPLGF TFSFPCQQTSLDAGILITWTKGFKATDCVGHDVVTLLRDAIKRREEFDLDVVAVVNDTVG TMMTCAYEEPTCEVGLIVGTGSNACYMEEMKNVEMVEGDQGQMCINMEWGAFGDNGCLDD IRTHYDRLVDEYSLNAGKQRYEKMISGMYLGEIVRNILIDFTKKGFLFRGQISETLKTRG IFETKFLSQIESDRLALLQVRAILQQLGLNSTCDDSILVKTVCGVVSRRAAQLCGAGMAA VVDKIRENRGLDRLNVTVGVDGTLYKLHPHFSRIMHQTVKELSPKCNVSFLLSEDGSGKG AALITAVGVRLRTEASS Click to Show/Hide
|
||||
| 3D-structure |
|
||||
| Function |
Catalyzes the phosphorylation of various hexoses, such as D-glucose, D-glucosamine, D-fructose, D-mannose and 2-deoxy-D-glucose, to hexose 6-phosphate (D-glucose 6-phosphate, D-glucosamine 6-phosphate, D-fructose 6-phosphate, D-mannose 6-phosphate and 2-deoxy-D-glucose 6-phosphate, respectively). Does not phosphorylate N-acetyl-D-glucosamine. Mediates the initial step of glycolysis by catalyzing phosphorylation of D-glucose to D-glucose 6-phosphate. Involved in innate immunity and inflammation by acting as a pattern recognition receptor for bacterial peptidoglycan. When released in the cytosol, N-acetyl-D-glucosamine component of bacterial peptidoglycan inhibits the hexokinase activity of HK1 and causes its dissociation from mitochondrial outer membrane, thereby activating the NLRP3 inflammasome.
Click to Show/Hide
|
||||
| Uniprot ID | |||||
| Ensembl ID | |||||
| HGNC ID | |||||
| Click to Show/Hide the Complete Species Lineage | |||||
Type(s) of Resistant Mechanism of This Molecule
 UAPP: Unusual Activation of Pro-survival Pathway
Drug Resistance Data Categorized by Drug
Clinical Trial Drug(s)
1 drug(s) in total
| Drug Sensitivity Data Categorized by Their Corresponding Mechanisms | ||||
|
Unusual Activation of Pro-survival Pathway (UAPP)
|
||||
| Disease Class: Gastric cancer [ICD-11: 2B72.1] | [1] | |||
| Sensitive Disease | Gastric cancer [ICD-11: 2B72.1] | |||
| Sensitive Drug | Luteolin | |||
| Molecule Alteration | Expression | Down-regulation |
||
| Differential expression of the molecule in resistant disease | ||||
| Classification of Disease | Gastric cancer [ICD-11: 2B72] | |||
| The Specified Disease | Gastric cancer | |||
| The Studied Tissue | Gastric tissue | |||
| The Expression Level of Disease Section Compare with the Healthy Individual Tissue | p-value: 6.33E-04 Fold-change: -9.88E-02 Z-score: -1.63E+01 |
|||
| Experimental Note | Revealed Based on the Cell Line Data | |||
| Cell Pathway Regulation | Cell proliferation | Inhibition | hsa05200 | |
| p53/p21 /MAPK/ERK signaling pathway | Regulation | N.A. | ||
| In Vitro Model | SGC7901 cells | Gastric | Homo sapiens (Human) | CVCL_0520 |
| BGC823 cells | Gastric | Homo sapiens (Human) | CVCL_3360 | |
| AGS cells | Gastric | Homo sapiens (Human) | CVCL_0139 | |
| In Vivo Model | Nude mouse xenograft model | Mus musculus | ||
| Experiment for Molecule Alteration |
Western blot analysis; Dual luciferase reporter assay | |||
| Experiment for Drug Resistance |
CCK8 assay; Flow cytometric analysis | |||
| Mechanism Description | miR34a, as a suppressor, enhance the susceptibility of gastric cancer cell to luteolin by directly targeting Hk1. miR34a overexpression could inhibit GC cells and induce G1 phase arrest via p53/p21 and MAPk /ERk pathways. | |||
Disease- and Tissue-specific Abundances of This Molecule
ICD Disease Classification 02

| Differential expression of molecule in resistant diseases | ||
| The Studied Tissue | Gastric tissue | |
| The Specified Disease | Gastric cancer | |
| The Expression Level of Disease Section Compare with the Healthy Individual Tissue | p-value: 6.33E-04; Fold-change: -6.74E-01; Z-score: -9.98E+00 | |
| The Expression Level of Disease Section Compare with the Adjacent Tissue | p-value: 6.77E-03; Fold-change: -3.15E-01; Z-score: -7.62E-01 | |
|
Molecule expression in the normal tissue adjacent to the diseased tissue of patients
Molecule expression in the diseased tissue of patients
Molecule expression in the normal tissue of healthy individuals
|
||
| Disease-specific Molecule Abundances |
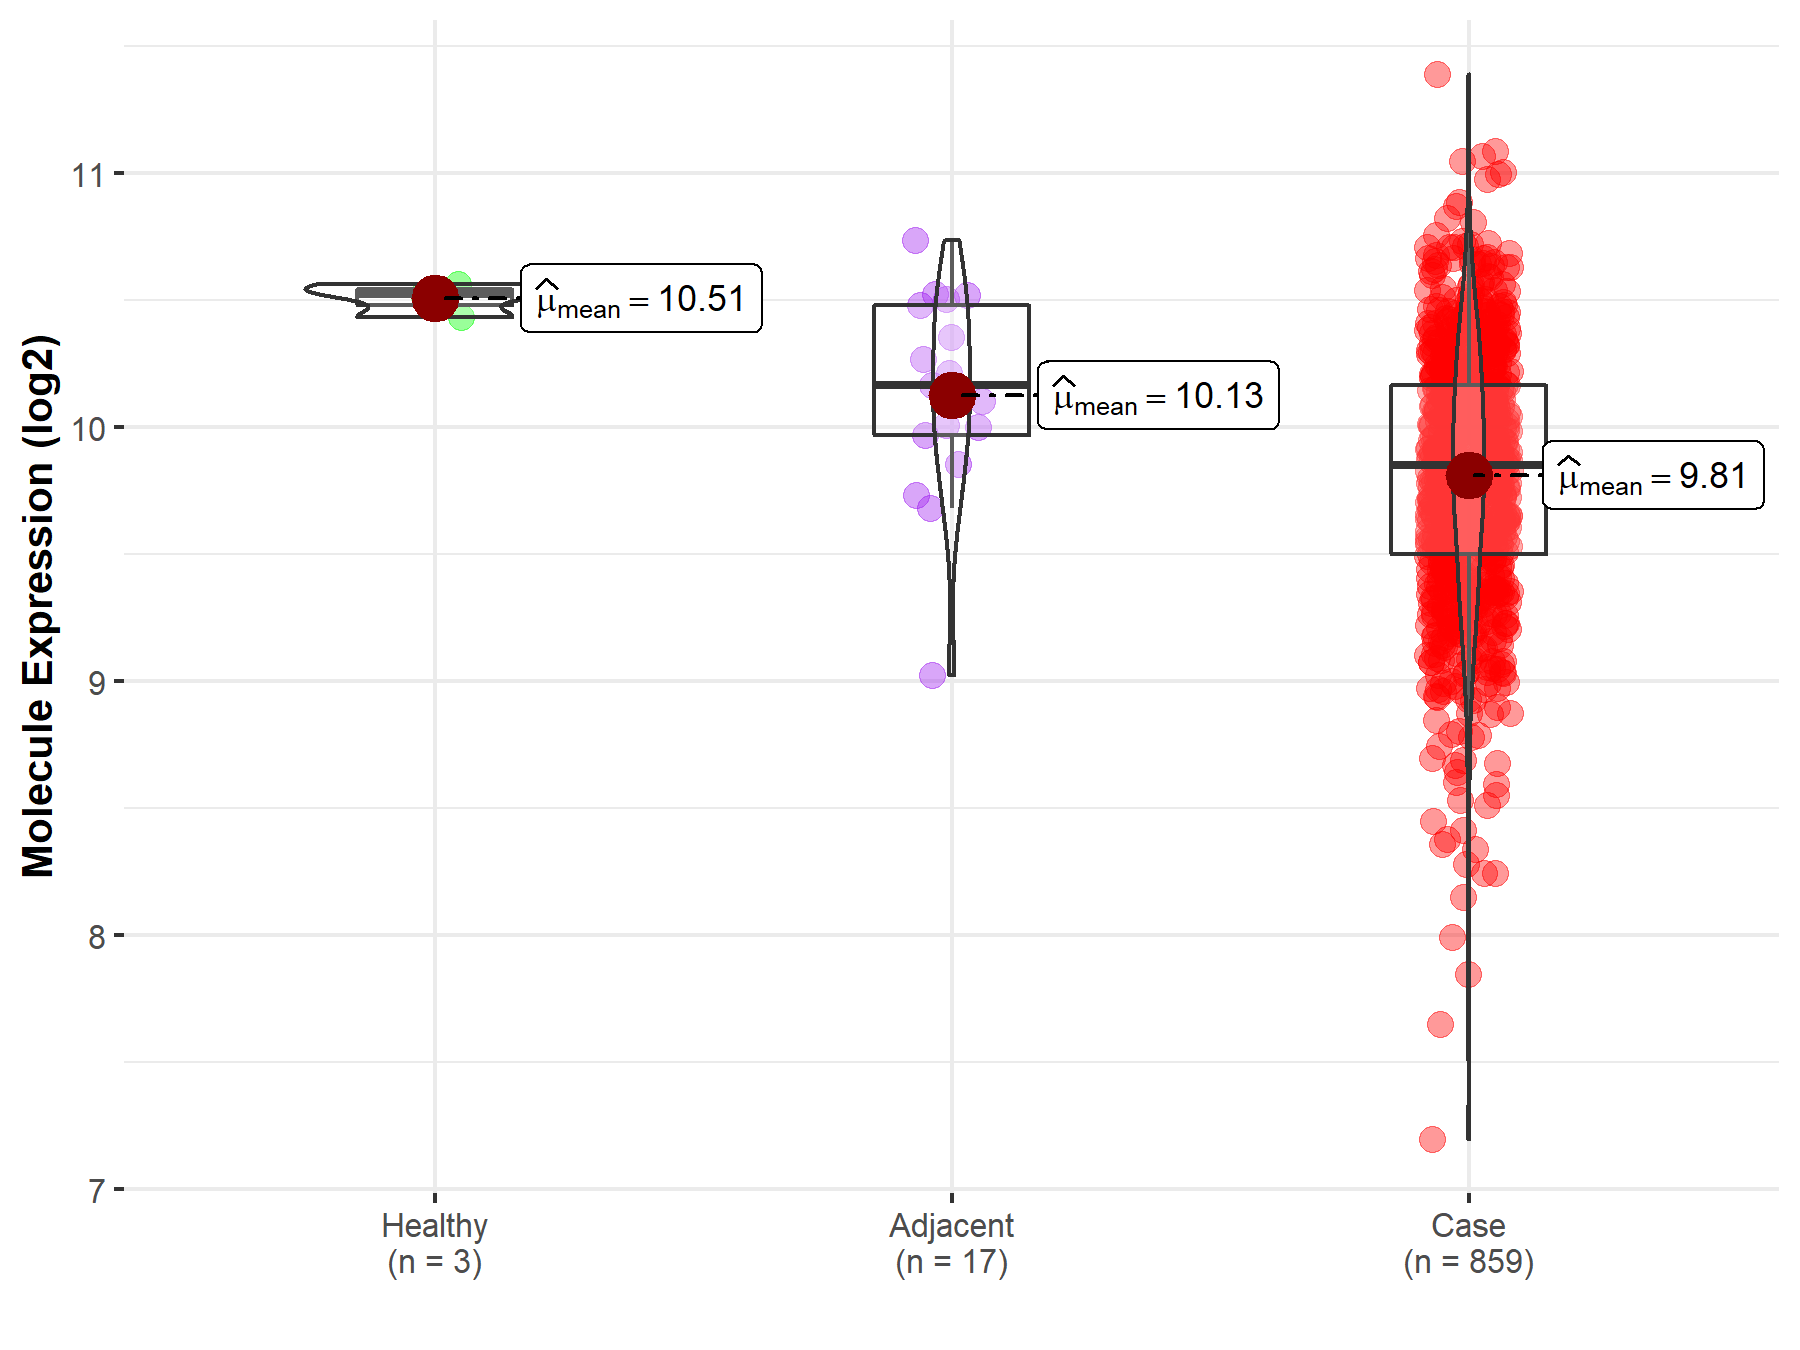
|
Click to View the Clearer Original Diagram |
Tissue-specific Molecule Abundances in Healthy Individuals

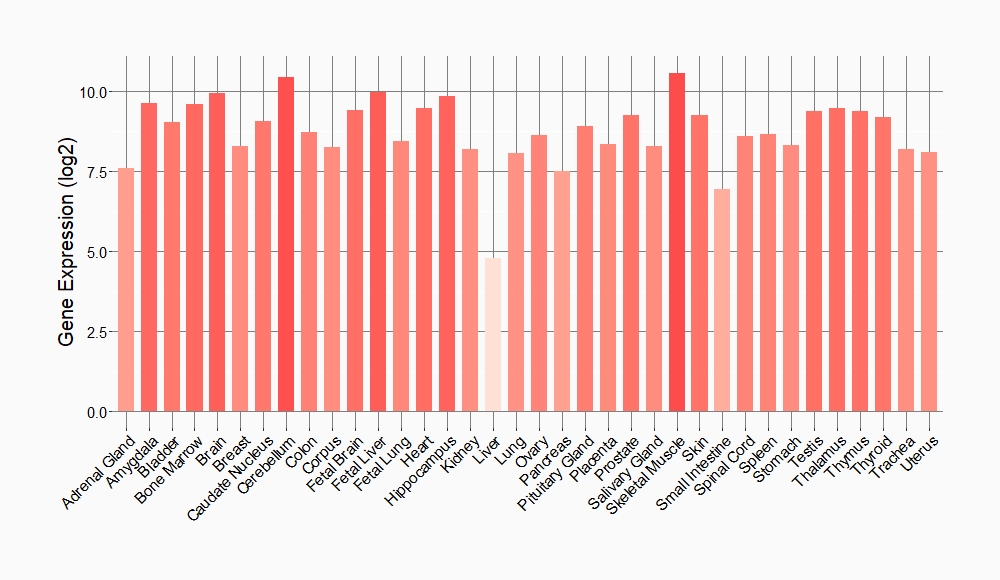
|
||
References
If you find any error in data or bug in web service, please kindly report it to Dr. Sun and Dr. Yu.