Molecule Information
General Information of the Molecule (ID: Mol00386)
| Name |
Glucose-6-phosphate dehydrogenase (G6PD)
,Homo sapiens
|
||||
|---|---|---|---|---|---|
| Synonyms |
G6PD
Click to Show/Hide
|
||||
| Molecule Type |
Protein
|
||||
| Gene Name |
G6PD
|
||||
| Gene ID | |||||
| Location |
chrX:154517825-154547572[-]
|
||||
| Sequence |
MAEQVALSRTQVCGILREELFQGDAFHQSDTHIFIIMGASGDLAKKKIYPTIWWLFRDGL
LPENTFIVGYARSRLTVADIRKQSEPFFKATPEEKLKLEDFFARNSYVAGQYDDAASYQR LNSHMNALHLGSQANRLFYLALPPTVYEAVTKNIHESCMSQIGWNRIIVEKPFGRDLQSS DRLSNHISSLFREDQIYRIDHYLGKEMVQNLMVLRFANRIFGPIWNRDNIACVILTFKEP FGTEGRGGYFDEFGIIRDVMQNHLLQMLCLVAMEKPASTNSDDVRDEKVKVLKCISEVQA NNVVLGQYVGNPDGEGEATKGYLDDPTVPRGSTTATFAAVVLYVENERWDGVPFILRCGK ALNERKAEVRLQFHDVAGDIFHQQCKRNELVIRVQPNEAVYTKMMTKKPGMFFNPEESEL DLTYGNRYKNVKLPDAYERLILDVFCGSQMHFVRSDELREAWRIFTPLLHQIELEKPKPI PYIYGSRGPTEADELMKRVGFQYEGTYKWVNPHKL Click to Show/Hide
|
||||
| 3D-structure |
|
||||
| Function |
Catalyzes the rate-limiting step of the oxidative pentose-phosphate pathway, which represents a route for the dissimilation of carbohydrates besides glycolysis. The main function of this enzyme is to provide reducing power (NADPH) and pentose phosphates for fatty acid and nucleic acid synthesis.
Click to Show/Hide
|
||||
| Uniprot ID | |||||
| Ensembl ID | |||||
| HGNC ID | |||||
| Click to Show/Hide the Complete Species Lineage | |||||
Type(s) of Resistant Mechanism of This Molecule
 MRAP: Metabolic Reprogramming via Altered Pathways
 UAPP: Unusual Activation of Pro-survival Pathway
Drug Resistance Data Categorized by Drug
Approved Drug(s)
5 drug(s) in total
| Drug Resistance Data Categorized by Their Corresponding Mechanisms | ||||
|
Metabolic Reprogramming via Altered Pathways (MRAP)
|
||||
| Disease Class: Pancreatic ductal adenocarcinoma [ICD-11: 2C10.0] | [1] | |||
| Metabolic Type | Glucose metabolism | |||
| Resistant Disease | Pancreatic ductal adenocarcinoma [ICD-11: 2C10.0] | |||
| Resistant Drug | Irinotecan | |||
| Molecule Alteration | Expression | Up-regulation |
||
| Differential expression of the molecule in resistant disease | ||||
| Classification of Disease | Pancreatic cancer [ICD-11: 2C10] | |||
| The Specified Disease | Pancreatic ductal adenocarcinoma | |||
| The Studied Tissue | Pancreas | |||
| The Expression Level of Disease Section Compare with the Healthy Individual Tissue | p-value: 3.01E-17 Fold-change: 4.09E-01 Z-score: 9.54E+00 |
|||
| Experimental Note | Revealed Based on the Cell Line Data | |||
| Cell Pathway Regulation | Adrenergic signaling in cardiomyocytes | Activation | hsa04261 | |
| In Vivo Model | Female SCID mice of 6-week-old, with fresh tissue from patient | Mice | ||
| Experiment for Molecule Alteration |
qRT-PCR; Western blot analysis | |||
| Experiment for Drug Resistance |
Tumor volume assay | |||
| Mechanism Description | Glucomet-PDACs are more resistant to chemotherapy than lipomet-PDACs, and patients with glucomet-PDAC have a worse prognosis. Integrated analyses reveal that the GLUT1/aldolase B (ALDOB)/glucose-6-phosphate dehydrogenase (G6PD) axis induces chemotherapy resistance by remodeling glucose metabolism in glucomet-PDAC. Increased glycolytic flux, G6PD activity, and pyrimidine biosynthesis are identified in glucomet-PDAC with high GLUT1 and low ALDOB expression, and these phenotypes could be reversed by inhibiting GLUT1 expression or by increasing ALDOB expression. | |||
| Disease Class: Pancreatic ductal adenocarcinoma [ICD-11: 2C10.0] | [1] | |||
| Metabolic Type | Glucose metabolism | |||
| Resistant Disease | Pancreatic ductal adenocarcinoma [ICD-11: 2C10.0] | |||
| Resistant Drug | Irinotecan | |||
| Molecule Alteration | Expression | Up-regulation |
||
| Differential expression of the molecule in resistant disease | ||||
| Classification of Disease | Pancreatic cancer [ICD-11: 2C10] | |||
| The Specified Disease | Pancreatic ductal adenocarcinoma | |||
| The Studied Tissue | Pancreas | |||
| The Expression Level of Disease Section Compare with the Healthy Individual Tissue | p-value: 3.01E-17 Fold-change: 4.09E-01 Z-score: 9.54E+00 |
|||
| Experimental Note | Identified from the Human Clinical Data | |||
| Cell Pathway Regulation | Adrenergic signaling in cardiomyocytes | Activation | hsa04261 | |
| In Vivo Model | HCC patients | Homo Sapiens | ||
| Experiment for Molecule Alteration |
qRT-PCR; Western blot analysis | |||
| Mechanism Description | Glucomet-PDACs are more resistant to chemotherapy than lipomet-PDACs, and patients with glucomet-PDAC have a worse prognosis. Integrated analyses reveal that the GLUT1/aldolase B (ALDOB)/glucose-6-phosphate dehydrogenase (G6PD) axis induces chemotherapy resistance by remodeling glucose metabolism in glucomet-PDAC. Increased glycolytic flux, G6PD activity, and pyrimidine biosynthesis are identified in glucomet-PDAC with high GLUT1 and low ALDOB expression, and these phenotypes could be reversed by inhibiting GLUT1 expression or by increasing ALDOB expression. | |||
| Drug Resistance Data Categorized by Their Corresponding Mechanisms | ||||
|
Metabolic Reprogramming via Altered Pathways (MRAP)
|
||||
| Disease Class: Pancreatic ductal adenocarcinoma [ICD-11: 2C10.0] | [1] | |||
| Metabolic Type | Glucose metabolism | |||
| Resistant Disease | Pancreatic ductal adenocarcinoma [ICD-11: 2C10.0] | |||
| Resistant Drug | Fluorouracil | |||
| Molecule Alteration | Expression | Up-regulation |
||
| Differential expression of the molecule in resistant disease | ||||
| Classification of Disease | Pancreatic cancer [ICD-11: 2C10] | |||
| The Specified Disease | Pancreatic ductal adenocarcinoma | |||
| The Studied Tissue | Pancreas | |||
| The Expression Level of Disease Section Compare with the Healthy Individual Tissue | p-value: 3.01E-17 Fold-change: 4.09E-01 Z-score: 9.54E+00 |
|||
| Experimental Note | Revealed Based on the Cell Line Data | |||
| Cell Pathway Regulation | Adrenergic signaling in cardiomyocytes | Activation | hsa04261 | |
| In Vivo Model | Female SCID mice of 6-week-old, with fresh tissue from patient | Mice | ||
| Experiment for Molecule Alteration |
qRT-PCR; Western blot analysis | |||
| Experiment for Drug Resistance |
Tumor volume assay | |||
| Mechanism Description | Glucomet-PDACs are more resistant to chemotherapy than lipomet-PDACs, and patients with glucomet-PDAC have a worse prognosis. Integrated analyses reveal that the GLUT1/aldolase B (ALDOB)/glucose-6-phosphate dehydrogenase (G6PD) axis induces chemotherapy resistance by remodeling glucose metabolism in glucomet-PDAC. Increased glycolytic flux, G6PD activity, and pyrimidine biosynthesis are identified in glucomet-PDAC with high GLUT1 and low ALDOB expression, and these phenotypes could be reversed by inhibiting GLUT1 expression or by increasing ALDOB expression. | |||
| Disease Class: Pancreatic ductal adenocarcinoma [ICD-11: 2C10.0] | [1] | |||
| Metabolic Type | Glucose metabolism | |||
| Resistant Disease | Pancreatic ductal adenocarcinoma [ICD-11: 2C10.0] | |||
| Resistant Drug | Fluorouracil | |||
| Molecule Alteration | Expression | Up-regulation |
||
| Differential expression of the molecule in resistant disease | ||||
| Classification of Disease | Pancreatic cancer [ICD-11: 2C10] | |||
| The Specified Disease | Pancreatic ductal adenocarcinoma | |||
| The Studied Tissue | Pancreas | |||
| The Expression Level of Disease Section Compare with the Healthy Individual Tissue | p-value: 3.01E-17 Fold-change: 4.09E-01 Z-score: 9.54E+00 |
|||
| Experimental Note | Identified from the Human Clinical Data | |||
| Cell Pathway Regulation | Adrenergic signaling in cardiomyocytes | Activation | hsa04261 | |
| In Vivo Model | HCC patients | Homo Sapiens | ||
| Experiment for Molecule Alteration |
qRT-PCR; Western blot analysis | |||
| Mechanism Description | Glucomet-PDACs are more resistant to chemotherapy than lipomet-PDACs, and patients with glucomet-PDAC have a worse prognosis. Integrated analyses reveal that the GLUT1/aldolase B (ALDOB)/glucose-6-phosphate dehydrogenase (G6PD) axis induces chemotherapy resistance by remodeling glucose metabolism in glucomet-PDAC. Increased glycolytic flux, G6PD activity, and pyrimidine biosynthesis are identified in glucomet-PDAC with high GLUT1 and low ALDOB expression, and these phenotypes could be reversed by inhibiting GLUT1 expression or by increasing ALDOB expression. | |||
| Drug Resistance Data Categorized by Their Corresponding Mechanisms | ||||
|
Metabolic Reprogramming via Altered Pathways (MRAP)
|
||||
| Disease Class: Pancreatic ductal adenocarcinoma [ICD-11: 2C10.0] | [1] | |||
| Metabolic Type | Glucose metabolism | |||
| Resistant Disease | Pancreatic ductal adenocarcinoma [ICD-11: 2C10.0] | |||
| Resistant Drug | Oxaliplatin | |||
| Molecule Alteration | Expression | Up-regulation |
||
| Differential expression of the molecule in resistant disease | ||||
| Classification of Disease | Pancreatic cancer [ICD-11: 2C10] | |||
| The Specified Disease | Pancreatic ductal adenocarcinoma | |||
| The Studied Tissue | Pancreas | |||
| The Expression Level of Disease Section Compare with the Healthy Individual Tissue | p-value: 3.01E-17 Fold-change: 4.09E-01 Z-score: 9.54E+00 |
|||
| Experimental Note | Identified from the Human Clinical Data | |||
| Cell Pathway Regulation | Adrenergic signaling in cardiomyocytes | Activation | hsa04261 | |
| In Vivo Model | HCC patients | Homo Sapiens | ||
| Experiment for Molecule Alteration |
qRT-PCR; Western blot analysis | |||
| Mechanism Description | Glucomet-PDACs are more resistant to chemotherapy than lipomet-PDACs, and patients with glucomet-PDAC have a worse prognosis. Integrated analyses reveal that the GLUT1/aldolase B (ALDOB)/glucose-6-phosphate dehydrogenase (G6PD) axis induces chemotherapy resistance by remodeling glucose metabolism in glucomet-PDAC. Increased glycolytic flux, G6PD activity, and pyrimidine biosynthesis are identified in glucomet-PDAC with high GLUT1 and low ALDOB expression, and these phenotypes could be reversed by inhibiting GLUT1 expression or by increasing ALDOB expression. | |||
| Disease Class: Pancreatic ductal adenocarcinoma [ICD-11: 2C10.0] | [1] | |||
| Metabolic Type | Glucose metabolism | |||
| Resistant Disease | Pancreatic ductal adenocarcinoma [ICD-11: 2C10.0] | |||
| Resistant Drug | Oxaliplatin | |||
| Molecule Alteration | Expression | Up-regulation |
||
| Differential expression of the molecule in resistant disease | ||||
| Classification of Disease | Pancreatic cancer [ICD-11: 2C10] | |||
| The Specified Disease | Pancreatic cancer | |||
| The Studied Tissue | Pancreas | |||
| The Expression Level of Disease Section Compare with the Healthy Individual Tissue | p-value: 1.65E-04 Fold-change: 2.06E-01 Z-score: 4.69E+00 |
|||
| Experimental Note | Revealed Based on the Cell Line Data | |||
| Cell Pathway Regulation | Adrenergic signaling in cardiomyocytes | Activation | hsa04261 | |
| In Vivo Model | Female SCID mice of 6-week-old, with fresh tissue from patient | Mice | ||
| Experiment for Molecule Alteration |
qRT-PCR; Western blot analysis | |||
| Experiment for Drug Resistance |
Tumor volume assay | |||
| Mechanism Description | Glucomet-PDACs are more resistant to chemotherapy than lipomet-PDACs, and patients with glucomet-PDAC have a worse prognosis. Integrated analyses reveal that the GLUT1/aldolase B (ALDOB)/glucose-6-phosphate dehydrogenase (G6PD) axis induces chemotherapy resistance by remodeling glucose metabolism in glucomet-PDAC. Increased glycolytic flux, G6PD activity, and pyrimidine biosynthesis are identified in glucomet-PDAC with high GLUT1 and low ALDOB expression, and these phenotypes could be reversed by inhibiting GLUT1 expression or by increasing ALDOB expression. | |||
| Drug Resistance Data Categorized by Their Corresponding Mechanisms | ||||
|
Unusual Activation of Pro-survival Pathway (UAPP)
|
||||
| Disease Class: Multiple myeloma [ICD-11: 2A83.0] | [2] | |||
| Resistant Disease | Multiple myeloma [ICD-11: 2A83.0] | |||
| Resistant Drug | Bortezomib | |||
| Molecule Alteration | Expression | Up-regulation |
||
| Differential expression of the molecule in resistant disease | ||||
| Classification of Disease | Multiple myeloma [ICD-11: 2A83] | |||
| The Specified Disease | Myeloma | |||
| The Studied Tissue | Bone marrow | |||
| The Expression Level of Disease Section Compare with the Healthy Individual Tissue | p-value: 1.85E-04 Fold-change: 1.21E-01 Z-score: 6.68E+00 |
|||
| Experimental Note | Revealed Based on the Cell Line Data | |||
| Cell Pathway Regulation | Cell proliferation | Activation | hsa05200 | |
| Pentose phosphate signaling pathway | Activation | hsa00030 | ||
| In Vitro Model | NCI-H929 cells | Bone marrow | Homo sapiens (Human) | CVCL_1600 |
| U266 cells | Bone marrow | Homo sapiens (Human) | CVCL_0566 | |
| MM1S cells | Peripheral blood | Homo sapiens (Human) | CVCL_8792 | |
| OPM-2 cells | Peripheral blood | Homo sapiens (Human) | CVCL_1625 | |
| RPMI-8226/BTZ cells | Pancreas | Homo sapiens (Human) | CVCL_XK17 | |
| Experiment for Molecule Alteration |
Western blot analysis | |||
| Experiment for Drug Resistance |
CCK8 assay | |||
| Mechanism Description | PDIA3P interacts with c-Myc to enhance its transactivation activity and binding to G6PD promoter, leading to increase of G6PD expression and PPP flux, promoting cell proliferation and drug resistance. | |||
| Drug Resistance Data Categorized by Their Corresponding Mechanisms | ||||
|
Unusual Activation of Pro-survival Pathway (UAPP)
|
||||
| Disease Class: Ovarian cancer [ICD-11: 2C73.0] | [3] | |||
| Resistant Disease | Ovarian cancer [ICD-11: 2C73.0] | |||
| Resistant Drug | Cisplatin | |||
| Molecule Alteration | Expression | Up-regulation |
||
| Experimental Note | Revealed Based on the Cell Line Data | |||
| Cell Pathway Regulation | Cell proliferation | Activation | hsa05200 | |
| In Vitro Model | A2780-DR cells | Ovary | Homo sapiens (Human) | CVCL_EG64 |
| Experiment for Molecule Alteration |
Western blot analysis | |||
| Experiment for Drug Resistance |
Clonogenic assay | |||
| Mechanism Description | The Essential Role of H19 Contributing to Cisplatin Resistance by Regulating Glutathione Metabolism in High-Grade Serous Ovarian Cancer.Additionally, we verified that different H19 expression levels in HGSC tissues showed strong correlation with cancer recurrence. H19 knockdown in A2780-DR cells resulted in recovery of cisplatin sensitivity in vitro and in vivo. Quantitative proteomics analysis indicated that six NRF2-targeted proteins, including NQO1, GSR, G6PD, GCLC, GCLM and GSTP1 involved in the glutathione metabolism pathway, were reduced in H19-knockdown cells. Furthermore, H19-knockdown cells were markedly more sensitive to hydrogen-peroxide treatment and exhibited lower glutathione levels. Our results reveal a previously unknown link between H19 and glutathione metabolism in the regulation of cancer-drug resistance. | |||
Disease- and Tissue-specific Abundances of This Molecule
ICD Disease Classification 02

| Differential expression of molecule in resistant diseases | ||
| The Studied Tissue | Bone marrow | |
| The Specified Disease | Multiple myeloma | |
| The Expression Level of Disease Section Compare with the Healthy Individual Tissue | p-value: 1.85E-04; Fold-change: 4.82E-01; Z-score: 2.02E+00 | |
|
Molecule expression in the diseased tissue of patients
Molecule expression in the normal tissue of healthy individuals
|
||
| Disease-specific Molecule Abundances |

|
Click to View the Clearer Original Diagram |
| The Studied Tissue | Peripheral blood | |
| The Specified Disease | Multiple myeloma | |
| The Expression Level of Disease Section Compare with the Healthy Individual Tissue | p-value: 4.49E-01; Fold-change: -2.14E-01; Z-score: -7.78E-01 | |
|
Molecule expression in the diseased tissue of patients
Molecule expression in the normal tissue of healthy individuals
|
||
| Disease-specific Molecule Abundances |

|
Click to View the Clearer Original Diagram |
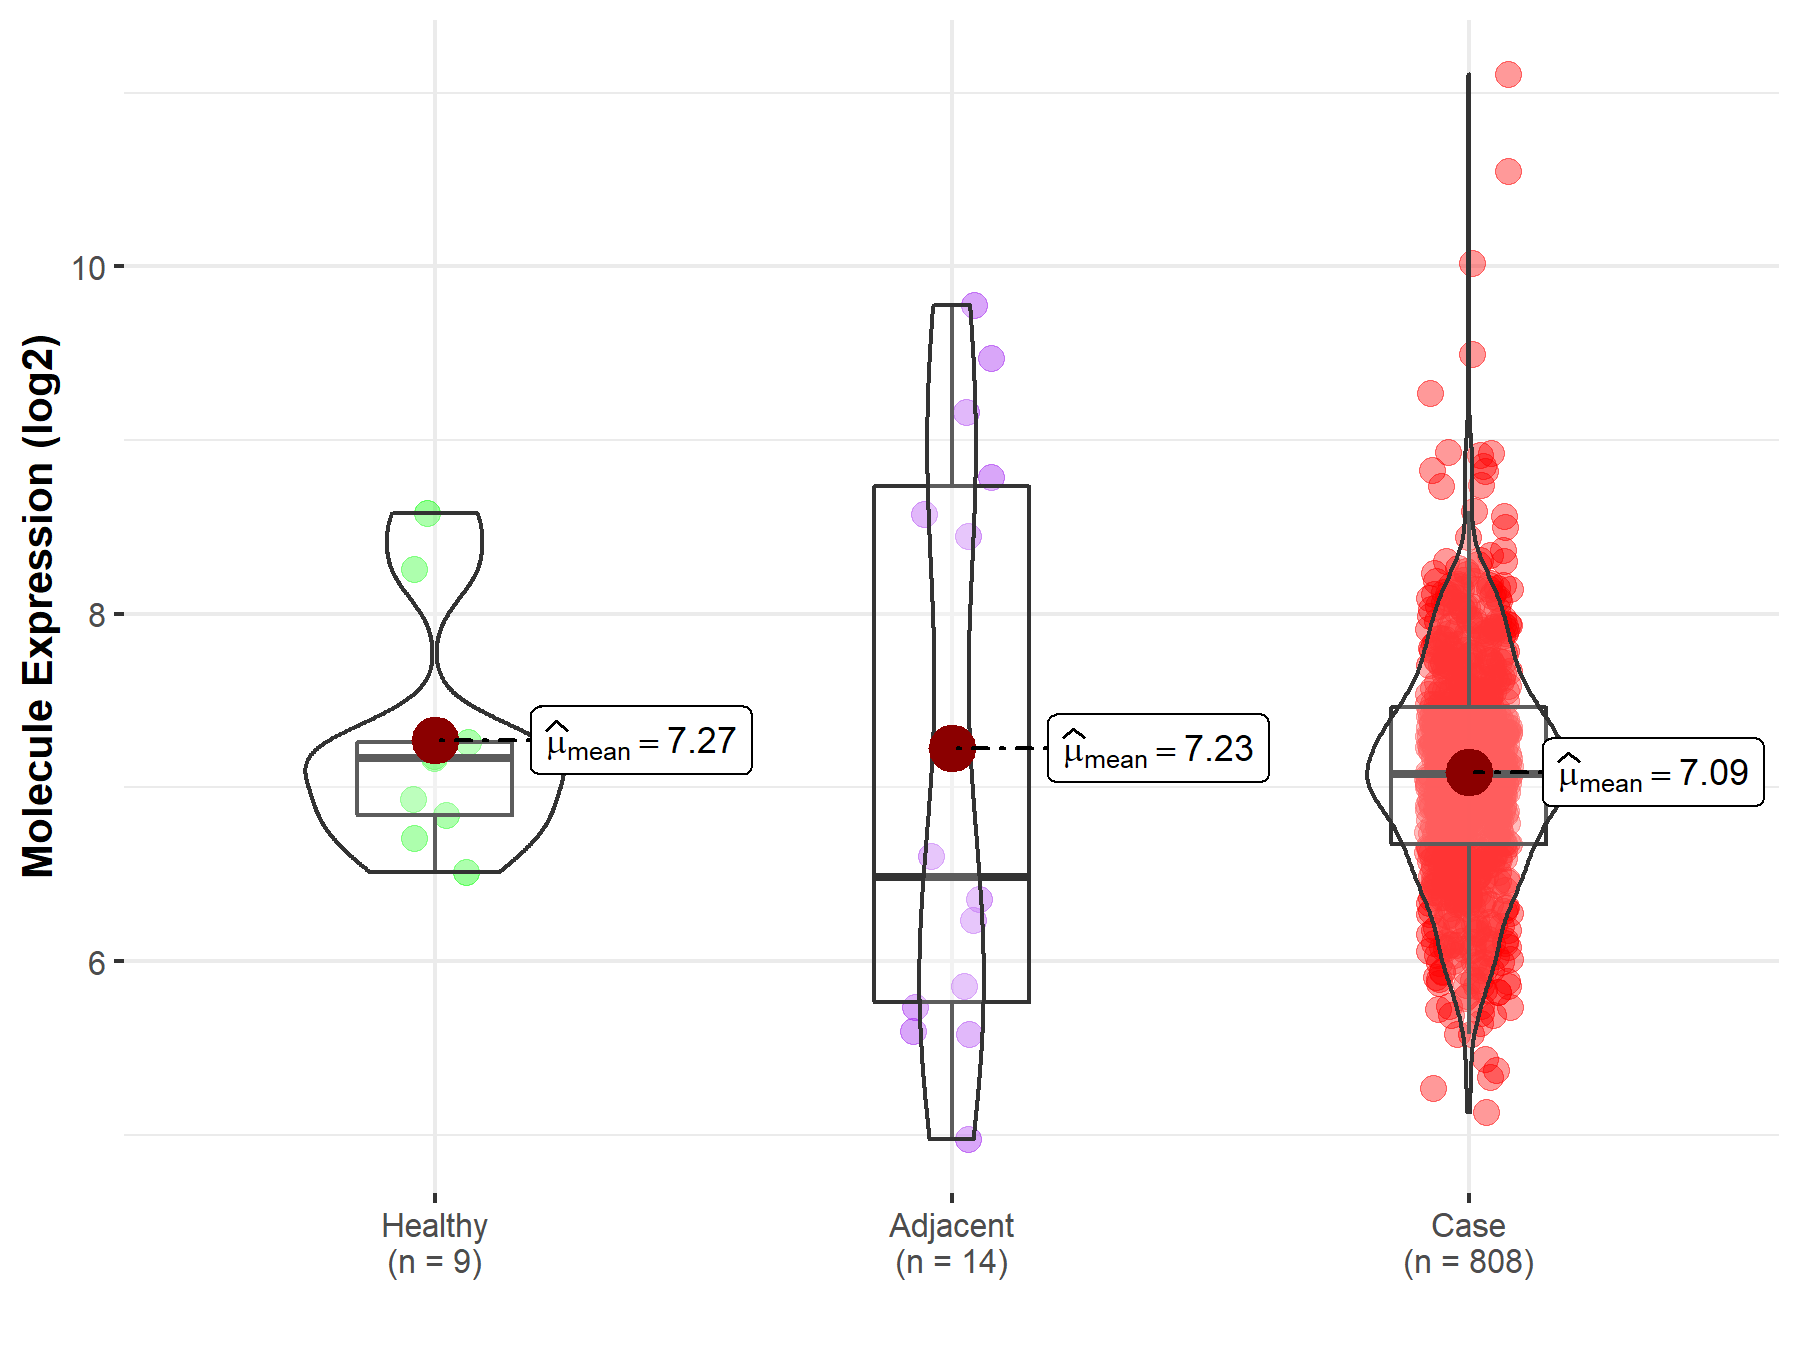
| Differential expression of molecule in resistant diseases | ||
| The Studied Tissue | Ovary | |
| The Specified Disease | Ovarian cancer | |
| The Expression Level of Disease Section Compare with the Healthy Individual Tissue | p-value: 4.54E-01; Fold-change: -8.98E-02; Z-score: -1.29E-01 | |
| The Expression Level of Disease Section Compare with the Adjacent Tissue | p-value: 7.67E-01; Fold-change: 5.94E-01; Z-score: 3.49E-01 | |
|
Molecule expression in the normal tissue adjacent to the diseased tissue of patients
Molecule expression in the diseased tissue of patients
Molecule expression in the normal tissue of healthy individuals
|
||
| Disease-specific Molecule Abundances |
|
Click to View the Clearer Original Diagram |
Tissue-specific Molecule Abundances in Healthy Individuals

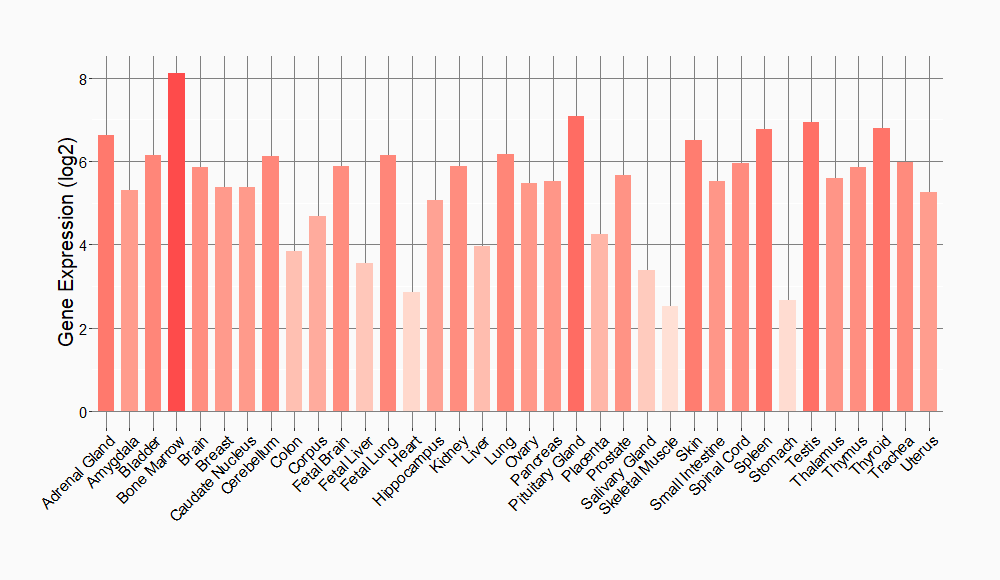
|
||
References
If you find any error in data or bug in web service, please kindly report it to Dr. Sun and Dr. Yu.