Molecule Information
General Information of the Molecule (ID: Mol00347)
| Name |
Endoplasmin (HSP90B1)
,Homo sapiens
|
||||
|---|---|---|---|---|---|
| Synonyms |
94 kDa glucose-regulated protein; GRP-94; Heat shock protein 90 kDa beta member 1; Tumor rejection antigen 1; gp96 homolog; GRP94; TRA1
Click to Show/Hide
|
||||
| Molecule Type |
Protein
|
||||
| Gene Name |
HSP90B1
|
||||
| Gene ID | |||||
| Location |
chr12:103930107-103953931[+]
|
||||
| Sequence |
MRALWVLGLCCVLLTFGSVRADDEVDVDGTVEEDLGKSREGSRTDDEVVQREEEAIQLDG
LNASQIRELREKSEKFAFQAEVNRMMKLIINSLYKNKEIFLRELISNASDALDKIRLISL TDENALSGNEELTVKIKCDKEKNLLHVTDTGVGMTREELVKNLGTIAKSGTSEFLNKMTE AQEDGQSTSELIGQFGVGFYSAFLVADKVIVTSKHNNDTQHIWESDSNEFSVIADPRGNT LGRGTTITLVLKEEASDYLELDTIKNLVKKYSQFINFPIYVWSSKTETVEEPMEEEEAAK EEKEESDDEAAVEEEEEEKKPKTKKVEKTVWDWELMNDIKPIWQRPSKEVEEDEYKAFYK SFSKESDDPMAYIHFTAEGEVTFKSILFVPTSAPRGLFDEYGSKKSDYIKLYVRRVFITD DFHDMMPKYLNFVKGVVDSDDLPLNVSRETLQQHKLLKVIRKKLVRKTLDMIKKIADDKY NDTFWKEFGTNIKLGVIEDHSNRTRLAKLLRFQSSHHPTDITSLDQYVERMKEKQDKIYF MAGSSRKEAESSPFVERLLKKGYEVIYLTEPVDEYCIQALPEFDGKRFQNVAKEGVKFDE SEKTKESREAVEKEFEPLLNWMKDKALKDKIEKAVVSQRLTESPCALVASQYGWSGNMER IMKAQAYQTGKDISTNYYASQKKTFEINPRHPLIRDMLRRIKEDEDDKTVLDLAVVLFET ATLRSGYLLPDTKAYGDRIERMLRLSLNIDPDAKVEEEPEEEPEETAEDTTEDTEQDEDE EMDVGTDEEEETAKESTAEKDEL Click to Show/Hide
|
||||
| 3D-structure |
|
||||
| Function |
Molecular chaperone that functions in the processing and transport of secreted proteins. When associated with CNPY3, required for proper folding of Toll-like receptors. Functions in endoplasmic reticulum associated degradation (ERAD). Has ATPase activity. May participate in the unfolding of cytosolic leaderless cargos (lacking the secretion signal sequence) such as the interleukin 1/IL-1 to facilitate their translocation into the ERGIC (endoplasmic reticulum-Golgi intermediate compartment) and secretion; the translocation process is mediated by the cargo receptor TMED10.
Click to Show/Hide
|
||||
| Uniprot ID | |||||
| Ensembl ID | |||||
| HGNC ID | |||||
| Click to Show/Hide the Complete Species Lineage | |||||
Type(s) of Resistant Mechanism of This Molecule
 UAPP: Unusual Activation of Pro-survival Pathway
Drug Resistance Data Categorized by Drug
Approved Drug(s)
1 drug(s) in total
| Drug Resistance Data Categorized by Their Corresponding Mechanisms | ||||
|
Unusual Activation of Pro-survival Pathway (UAPP)
|
||||
| Disease Class: Glioma [ICD-11: 2A00.1] | [1] | |||
| Resistant Disease | Glioma [ICD-11: 2A00.1] | |||
| Resistant Drug | Temozolomide | |||
| Molecule Alteration | Expression | Up-regulation |
||
| Differential expression of the molecule in resistant disease | ||||
| Classification of Disease | Brain cancer [ICD-11: 2A00] | |||
| The Specified Disease | Neuroectodermal tumor | |||
| The Studied Tissue | Brainstem tissue | |||
| The Expression Level of Disease Section Compare with the Healthy Individual Tissue | p-value: 3.64E-05 Fold-change: 1.87E-01 Z-score: 6.85E+00 |
|||
| Experimental Note | Identified from the Human Clinical Data | |||
| Cell Pathway Regulation | UPR signaling pathway | Activation | hsa0414) | |
| In Vitro Model | U87MG cells | Brain | Homo sapiens (Human) | CVCL_GP63 |
| In Vivo Model | BALB/c nu/nu athymic mice xenografts model | Mus musculus | ||
| Experiment for Molecule Alteration |
Northern blot analysis | |||
| Experiment for Drug Resistance |
Clonogenic assay | |||
| Mechanism Description | Transcripts for the ER chaperones GRP94 and GRP78 were upregulated in the U87MG and U87+EGFR gliomas, relative to normal mouse brain from healthy animals. Elevated levels of UPR transcription factors and ER chaperones correlated with poor patient prognosis; western blots of high grade gliomas and tissue microarray immunohistochemistry verified high expression of UPR players, especially GRP94, in high grade gliomas. Activation of the UPR signaling pathways is a prominent feature of glioma biology that leads to metabolic shifts and enhances chemoresistant features of gliomas. | |||
Clinical Trial Drug(s)
1 drug(s) in total
| Drug Sensitivity Data Categorized by Their Corresponding Mechanisms | ||||
|
Unusual Activation of Pro-survival Pathway (UAPP)
|
||||
| Disease Class: Clear cell renal cell carcinoma [ICD-11: 2C90.Y] | [2] | |||
| Sensitive Disease | Clear cell renal cell carcinoma [ICD-11: 2C90.Y] | |||
| Sensitive Drug | AUY922 | |||
| Molecule Alteration | Expression | Down-regulation |
||
| Experimental Note | Revealed Based on the Cell Line Data | |||
| Cell Pathway Regulation | HIF-1alpha/VEGFA/VEGFR signalling pathway | Regulation | N.A. | |
| In Vitro Model | ACHN cells | Pleural effusion | Homo sapiens (Human) | CVCL_1067 |
| Experiment for Molecule Alteration |
Western blot assay | |||
| Experiment for Drug Resistance |
CCK8 assay | |||
| Mechanism Description | Our study is the first to identify that AUY922 can enhance the sensitivity of ccRCC to sunitinib. AUY922 not only has an inhibitory effect on ccRCC cells, but also enhances the inhibitory effect of sunitinib on ccRCC cells. Additionally, our research is the first to explore the mechanism of AUY922 in ccRCC, demonstrating that it targets the HIF-1/VEGFA/VEGFR pathway by inhibiting HSP90B1. | |||
Disease- and Tissue-specific Abundances of This Molecule
ICD Disease Classification 02

| Differential expression of molecule in resistant diseases | ||
| The Studied Tissue | Nervous tissue | |
| The Specified Disease | Brain cancer | |
| The Expression Level of Disease Section Compare with the Healthy Individual Tissue | p-value: 8.50E-01; Fold-change: -7.58E-02; Z-score: -1.64E-01 | |
|
Molecule expression in the diseased tissue of patients
Molecule expression in the normal tissue of healthy individuals
|
||
| Disease-specific Molecule Abundances |

|
Click to View the Clearer Original Diagram |
| The Studied Tissue | Brainstem tissue | |
| The Specified Disease | Glioma | |
| The Expression Level of Disease Section Compare with the Healthy Individual Tissue | p-value: 9.42E-01; Fold-change: -5.41E-02; Z-score: -5.43E-02 | |
|
Molecule expression in the diseased tissue of patients
Molecule expression in the normal tissue of healthy individuals
|
||
| Disease-specific Molecule Abundances |

|
Click to View the Clearer Original Diagram |
| The Studied Tissue | White matter | |
| The Specified Disease | Glioma | |
| The Expression Level of Disease Section Compare with the Healthy Individual Tissue | p-value: 6.00E-03; Fold-change: 3.39E-01; Z-score: 1.35E+00 | |
|
Molecule expression in the diseased tissue of patients
Molecule expression in the normal tissue of healthy individuals
|
||
| Disease-specific Molecule Abundances |
|
Click to View the Clearer Original Diagram |
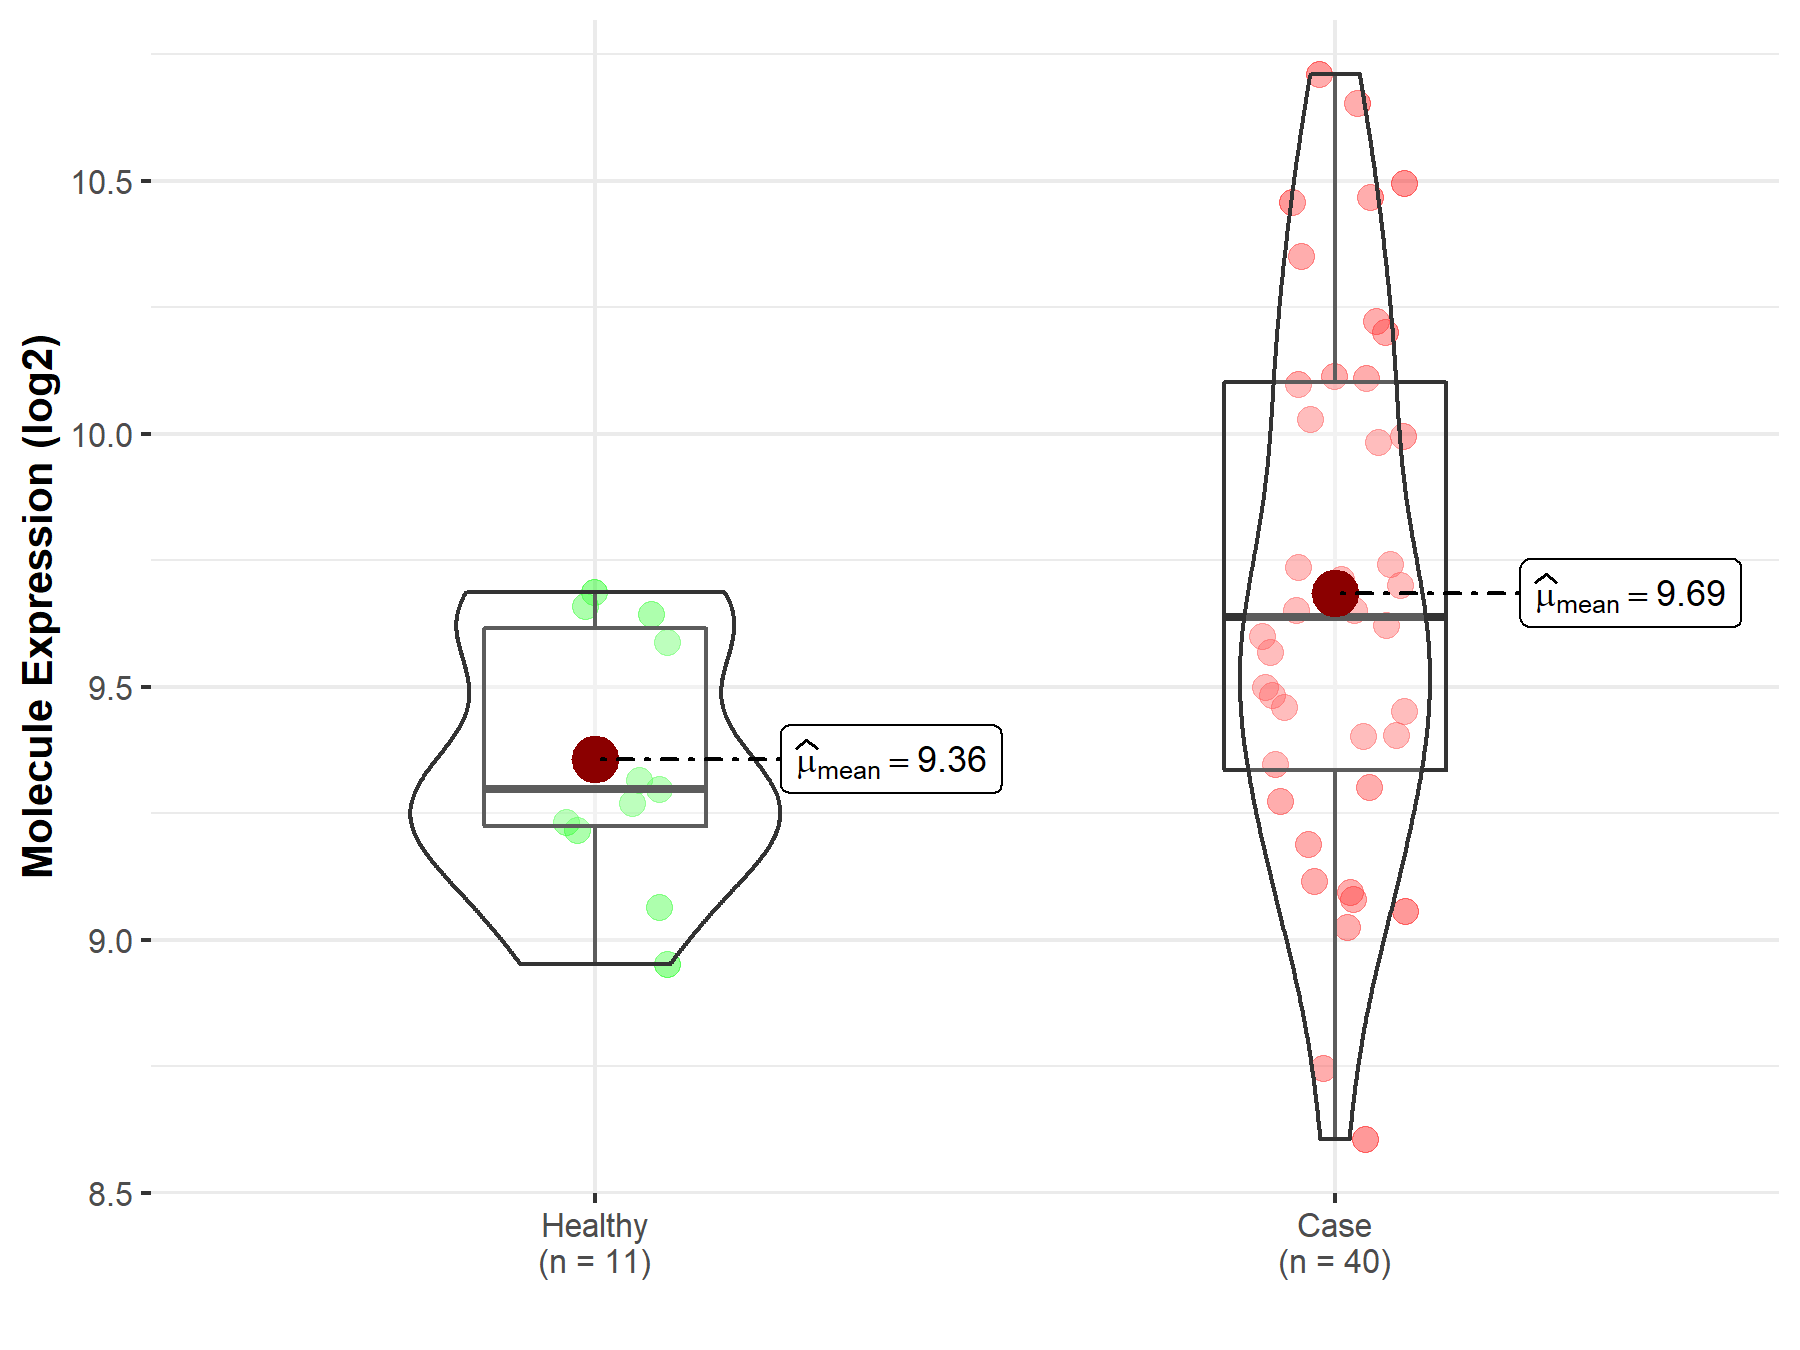
| The Studied Tissue | Brainstem tissue | |
| The Specified Disease | Neuroectodermal tumor | |
| The Expression Level of Disease Section Compare with the Healthy Individual Tissue | p-value: 3.64E-05; Fold-change: 1.02E+00; Z-score: 2.26E+00 | |
|
Molecule expression in the diseased tissue of patients
Molecule expression in the normal tissue of healthy individuals
|
||
| Disease-specific Molecule Abundances |

|
Click to View the Clearer Original Diagram |
Tissue-specific Molecule Abundances in Healthy Individuals

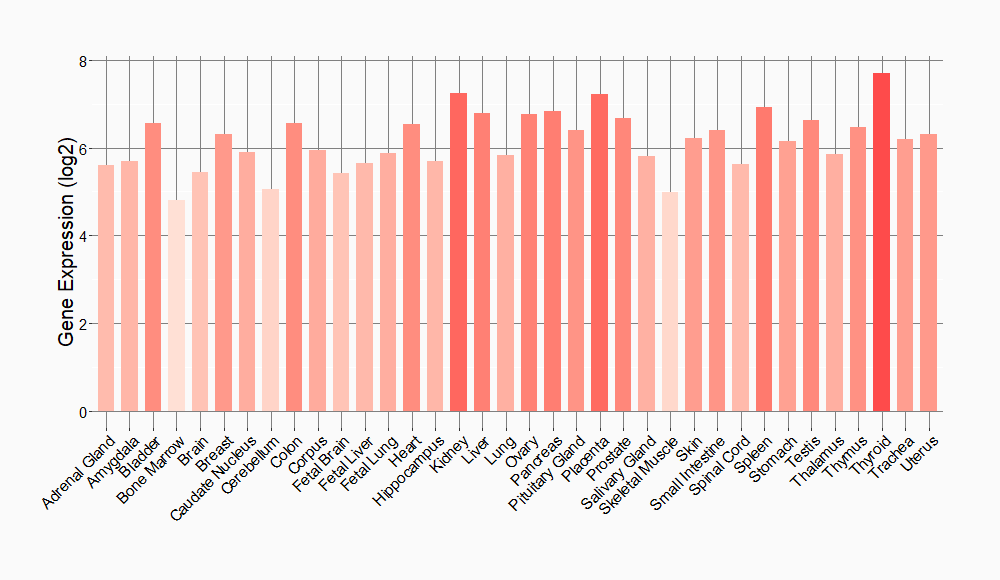
|
||
References
If you find any error in data or bug in web service, please kindly report it to Dr. Sun and Dr. Yu.