Molecule Information
General Information of the Molecule (ID: Mol00322)
| Name |
DNA damage-inducible transcript 3 (DDIT3)
,Homo sapiens
|
||||
|---|---|---|---|---|---|
| Synonyms |
DDIT-3; C/EBP zeta; C/EBP-homologous protein; CHOP; C/EBP-homologous protein 10; CHOP-10; CCAAT/enhancer-binding protein homologous protein; Growth arrest and DNA damage-inducible protein GADD153; CHOP; CHOP10; GADD153
Click to Show/Hide
|
||||
| Molecule Type |
Protein
|
||||
| Gene Name |
DDIT3
|
||||
| Gene ID | |||||
| Location |
chr12:57516588-57521737[-]
|
||||
| Sequence |
MAAESLPFSFGTLSSWELEAWYEDLQEVLSSDENGGTYVSPPGNEEEESKIFTTLDPASL
AWLTEEEPEPAEVTSTSQSPHSPDSSQSSLAQEEEEEDQGRTRKRKQSGHSPARAGKQRM KEKEQENERKVAQLAEENERLKQEIERLTREVEATRRALIDRMVNLHQA Click to Show/Hide
|
||||
| Function |
Multifunctional transcription factor in endoplasmic reticulum (ER) stress response. Plays an essential role in the response to a wide variety of cell stresses and induces cell cycle arrest and apoptosis in response to ER stress. Plays a dual role both as an inhibitor of CCAAT/enhancer-binding protein (C/EBP) function and as an activator of other genes. Acts as a dominant-negative regulator of C/EBP-induced transcription: dimerizes with members of the C/EBP family, impairs their association with C/EBP binding sites in the promoter regions, and inhibits the expression of C/EBP regulated genes. Positively regulates the transcription of TRIB3, IL6, IL8, IL23, TNFRSF10B/DR5, PPP1R15A/GADD34, BBC3/PUMA, BCL2L11/BIM and ERO1L. Negatively regulates; expression of BCL2 and MYOD1, ATF4-dependent transcriptional activation of asparagine synthetase (ASNS), CEBPA-dependent transcriptional activation of hepcidin (HAMP) and CEBPB-mediated expression of peroxisome proliferator-activated receptor gamma (PPARG). Together with ATF4, mediates ER-mediated cell death by promoting expression of genes involved in cellular amino acid metabolic processes, mRNA translation and the unfolded protein response (UPR) in response to ER stress. Inhibits the canonical Wnt signaling pathway by binding to TCF7L2/TCF4, impairing its DNA-binding properties and repressing its transcriptional activity. Plays a regulatory role in the inflammatory response through the induction of caspase-11 (CASP4/CASP11) which induces the activation of caspase-1 (CASP1) and both these caspases increase the activation of pro-IL1B to mature IL1B which is involved in the inflammatory response. Acts as a major regulator of postnatal neovascularization through regulation of endothelial nitric oxide synthase (NOS3)-related signaling.
Click to Show/Hide
|
||||
| Uniprot ID | |||||
| Ensembl ID | |||||
| HGNC ID | |||||
| Click to Show/Hide the Complete Species Lineage | |||||
Type(s) of Resistant Mechanism of This Molecule
 UAPP: Unusual Activation of Pro-survival Pathway
Drug Resistance Data Categorized by Drug
Approved Drug(s)
1 drug(s) in total
| Drug Resistance Data Categorized by Their Corresponding Mechanisms | ||||
|
Unusual Activation of Pro-survival Pathway (UAPP)
|
||||
| Disease Class: Lung cancer [ICD-11: 2C25.5] | [1] | |||
| Resistant Disease | Lung cancer [ICD-11: 2C25.5] | |||
| Resistant Drug | Cisplatin | |||
| Molecule Alteration | Expression | Down-regulation |
||
| Experimental Note | Revealed Based on the Cell Line Data | |||
| Cell Pathway Regulation | Cell viability | Activation | hsa05200 | |
| In Vitro Model | A549 cells | Lung | Homo sapiens (Human) | CVCL_0023 |
| H446 cells | Lung | Homo sapiens (Human) | CVCL_1562 | |
| In Vivo Model | Nude mouse xenograft model | Mus musculus | ||
| Experiment for Molecule Alteration |
Western blot analysis | |||
| Experiment for Drug Resistance |
MTT assay | |||
| Mechanism Description | miRNA 146a promotes chemotherapy resistance in lung cancer cells by targeting DNA damage inducible transcript 3 (CHOP). | |||
Investigative Drug(s)
1 drug(s) in total
| Drug Sensitivity Data Categorized by Their Corresponding Mechanisms | ||||
|
Unusual Activation of Pro-survival Pathway (UAPP)
|
||||
| Disease Class: Type 2 diabetes mellitus [ICD-11: 5A11.0] | [2] | |||
| Sensitive Disease | Type 2 diabetes mellitus [ICD-11: 5A11.0] | |||
| Sensitive Drug | Apigenin | |||
| Molecule Alteration | Expression | Down-regulation |
||
| Experimental Note | Revealed Based on the Cell Line Data | |||
| Cell Pathway Regulation | ER stress signalling pathway | Regulation | N.A. | |
| In Vitro Model | HepG2 cells | Liver | Homo sapiens (Human) | CVCL_0027 |
| Experiment for Molecule Alteration |
Western blot assay | |||
| Experiment for Drug Resistance |
Glucose uptake assay | |||
| Mechanism Description | In the present study, we identified apigenin as an effective compound for ameliorating ER stress and insulin resistance. It attenuated ER stress-induced cell death and hepatic insulin resistance and improved abnormal glucose tolerance in a db/db diabetic model. The molecular mechanism of apigenin involved direct binding to beta-tubulin and improving tubulin stability, thereby recovering insulin resistance and developing diabetes. | |||
Disease- and Tissue-specific Abundances of This Molecule
ICD Disease Classification 02

| Differential expression of molecule in resistant diseases | ||
| The Studied Tissue | Lung | |
| The Specified Disease | Lung cancer | |
| The Expression Level of Disease Section Compare with the Healthy Individual Tissue | p-value: 2.09E-11; Fold-change: 1.76E-01; Z-score: 4.87E-01 | |
| The Expression Level of Disease Section Compare with the Adjacent Tissue | p-value: 9.16E-03; Fold-change: 4.76E-02; Z-score: 1.17E-01 | |
|
Molecule expression in the normal tissue adjacent to the diseased tissue of patients
Molecule expression in the diseased tissue of patients
Molecule expression in the normal tissue of healthy individuals
|
||
| Disease-specific Molecule Abundances |
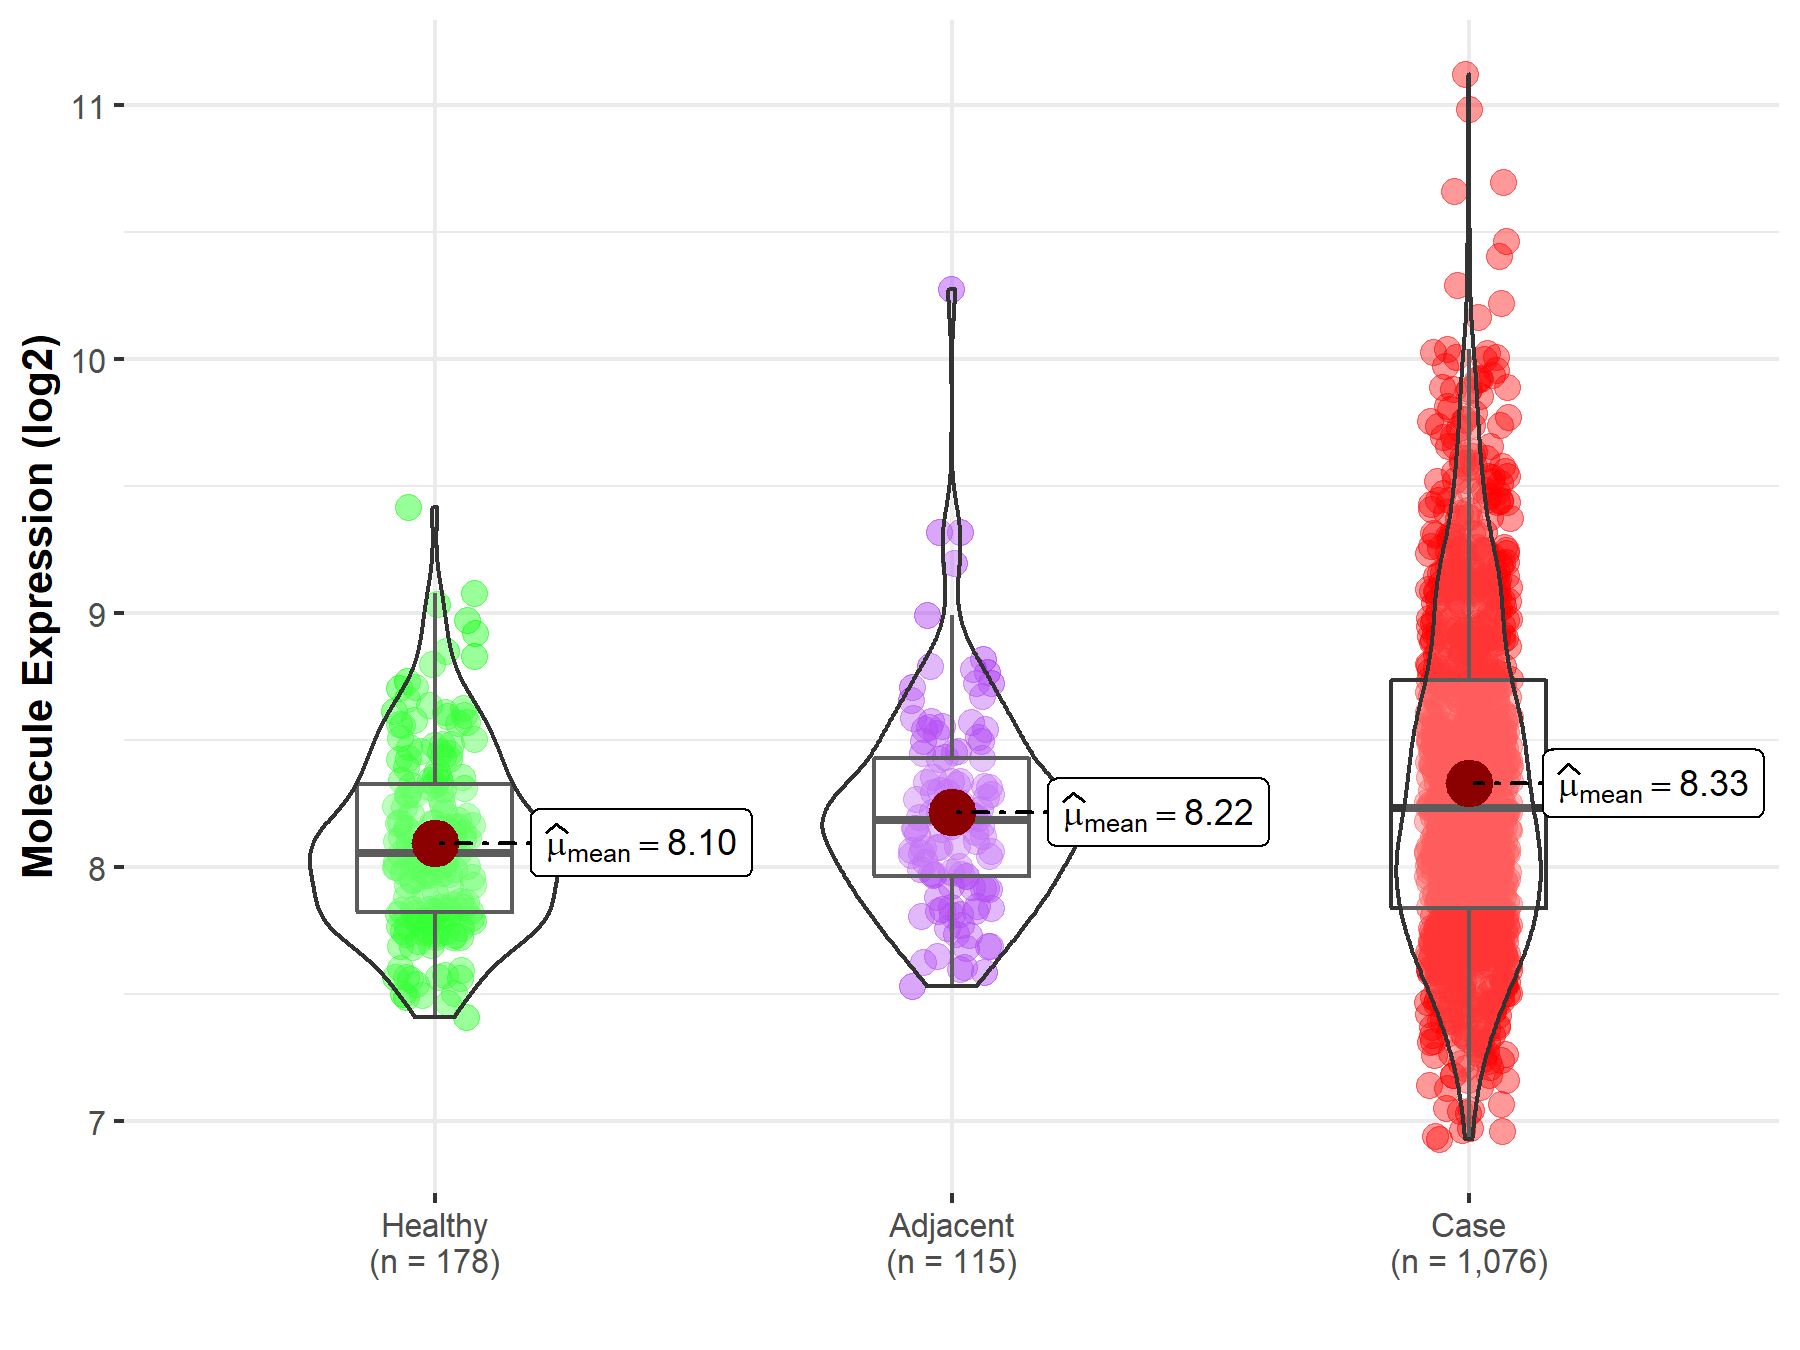
|
Click to View the Clearer Original Diagram |
Tissue-specific Molecule Abundances in Healthy Individuals

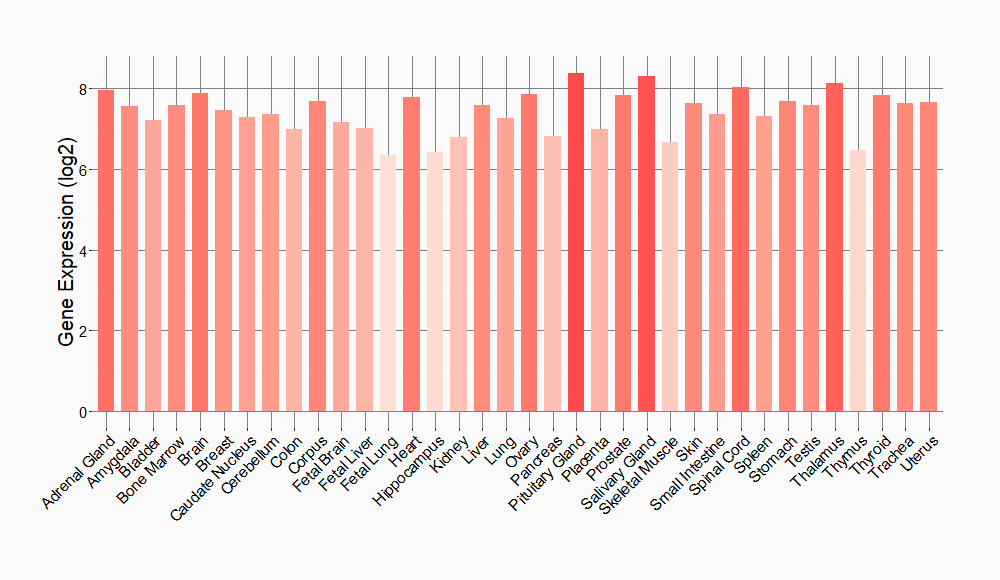
|
||
References
If you find any error in data or bug in web service, please kindly report it to Dr. Sun and Dr. Yu.