Molecule Information
General Information of the Molecule (ID: Mol00286)
| Name |
Cell division cycle protein 27 homolog (CDC27)
,Homo sapiens
|
||||
|---|---|---|---|---|---|
| Synonyms |
Anaphase-promoting complex subunit 3; APC3; CDC27 homolog; CDC27Hs; H-NUC; ANAPC3; D0S1430E; D17S978E
Click to Show/Hide
|
||||
| Molecule Type |
Protein
|
||||
| Gene Name |
CDC27
|
||||
| Gene ID | |||||
| Location |
chr17:47117703-47189422[-]
|
||||
| Sequence |
MTVLQEPVQAAIWQALNHYAYRDAVFLAERLYAEVHSEEALFLLATCYYRSGKAYKAYRL
LKGHSCTTPQCKYLLAKCCVDLSKLAEGEQILSGGVFNKQKSHDDIVTEFGDSACFTLSL LGHVYCKTDRLAKGSECYQKSLSLNPFLWSPFESLCEIGEKPDPDQTFKFTSLQNFSNCL PNSCTTQVPNHSLSHRQPETVLTETPQDTIELNRLNLESSNSKYSLNTDSSVSYIDSAVI SPDTVPLGTGTSILSKQVQNKPKTGRSLLGGPAALSPLTPSFGILPLETPSPGDGSYLQN YTNTPPVIDVPSTGAPSKKSVARIGQTGTKSVFSQSGNSREVTPILAQTQSSGPQTSTTP QVLSPTITSPPNALPRRSSRLFTSDSSTTKENSKKLKMKFPPKIPNRKTKSKTNKGGITQ PNINDSLEITKLDSSIISEGKISTITPQIQAFNLQKAAAEGLMSLLREMGKGYLALCSYN CKEAINILSHLPSHHYNTGWVLCQIGRAYFELSEYMQAERIFSEVRRIENYRVEGMEIYS TTLWHLQKDVALSVLSKDLTDMDKNSPEAWCAAGNCFSLQREHDIAIKFFQRAIQVDPNY AYAYTLLGHEFVLTEELDKALACFRNAIRVNPRHYNAWYGLGMIYYKQEKFSLAEMHFQK ALDINPQSSVLLCHIGVVQHALKKSEKALDTLNKAIVIDPKNPLCKFHRASVLFANEKYK SALQELEELKQIVPKESLVYFLIGKVYKKLGQTHLALMNFSWAMDLDPKGANNQIKEAID KRYLPDDEEPITQEEQIMGTDESQESSMTDADDTQLHAAESDEF Click to Show/Hide
|
||||
| 3D-structure |
|
||||
| Function |
Component of the anaphase promoting complex/cyclosome (APC/C), a cell cycle-regulated E3 ubiquitin ligase that controls progression through mitosis and the G1 phase of the cell cycle. The APC/C complex acts by mediating ubiquitination and subsequent degradation of target proteins: it mainly mediates the formation of 'Lys-11'-linked polyubiquitin chains and, to a lower extent, the formation of 'Lys-48'- and 'Lys-63'-linked polyubiquitin chains.
Click to Show/Hide
|
||||
| Uniprot ID | |||||
| Ensembl ID | |||||
| HGNC ID | |||||
| Click to Show/Hide the Complete Species Lineage | |||||
Type(s) of Resistant Mechanism of This Molecule
 UAPP: Unusual Activation of Pro-survival Pathway
Drug Resistance Data Categorized by Drug
Clinical Trial Drug(s)
1 drug(s) in total
| Drug Resistance Data Categorized by Their Corresponding Mechanisms | ||||
|
Unusual Activation of Pro-survival Pathway (UAPP)
|
||||
| Disease Class: Glioblastoma [ICD-11: 2A00.02] | [1] | |||
| Resistant Disease | Glioblastoma [ICD-11: 2A00.02] | |||
| Resistant Drug | Beta-lapachone | |||
| Molecule Alteration | Expression | Down-regulation |
||
| Differential expression of the molecule in resistant disease | ||||
| Classification of Disease | Brain cancer [ICD-11: 2A00] | |||
| The Specified Disease | Glioma | |||
| The Studied Tissue | Brainstem tissue | |||
| The Expression Level of Disease Section Compare with the Healthy Individual Tissue | p-value: 2.09E-01 Fold-change: -4.80E-02 Z-score: -2.00E+00 |
|||
| Experimental Note | Revealed Based on the Cell Line Data | |||
| Cell Pathway Regulation | AKT signaling pathway | Inhibition | hsa04151 | |
| In Vitro Model | U251 cells | Brain | Homo sapiens (Human) | CVCL_0021 |
| U87 cells | Brain | Homo sapiens (Human) | CVCL_0022 | |
| U118 cells | Brain | Homo sapiens (Human) | CVCL_0633 | |
| HA-1800 cells | Brain | Homo sapiens (Human) | N.A. | |
| In Vivo Model | Nude mouse xenograft model | Mus musculus | ||
| Experiment for Molecule Alteration |
Dual luciferase assay; Western blot analysis; Immunohistochemistry (IHC) assay | |||
| Experiment for Drug Resistance |
CCK8 assay; Soft agar colony formation assay; Wound-healing analysis | |||
| Mechanism Description | miR218-2 promotes glioblastomas growth, invasion and drug resistance by targeting CDC27, and the overexpression of CDC27 counteracted the function of miR218-2 in glioma cells. miR218-2 induces glioma malig.ncy by targeting CDC27, which leads to a decrease in the activation of the APC/C biquitin-proteosome pathway, probably downstream of the TGFbeta signaling pathways. | |||
Disease- and Tissue-specific Abundances of This Molecule
ICD Disease Classification 02

| Differential expression of molecule in resistant diseases | ||
| The Studied Tissue | Nervous tissue | |
| The Specified Disease | Brain cancer | |
| The Expression Level of Disease Section Compare with the Healthy Individual Tissue | p-value: 4.40E-07; Fold-change: 1.48E-01; Z-score: 3.16E-01 | |
|
Molecule expression in the diseased tissue of patients
Molecule expression in the normal tissue of healthy individuals
|
||
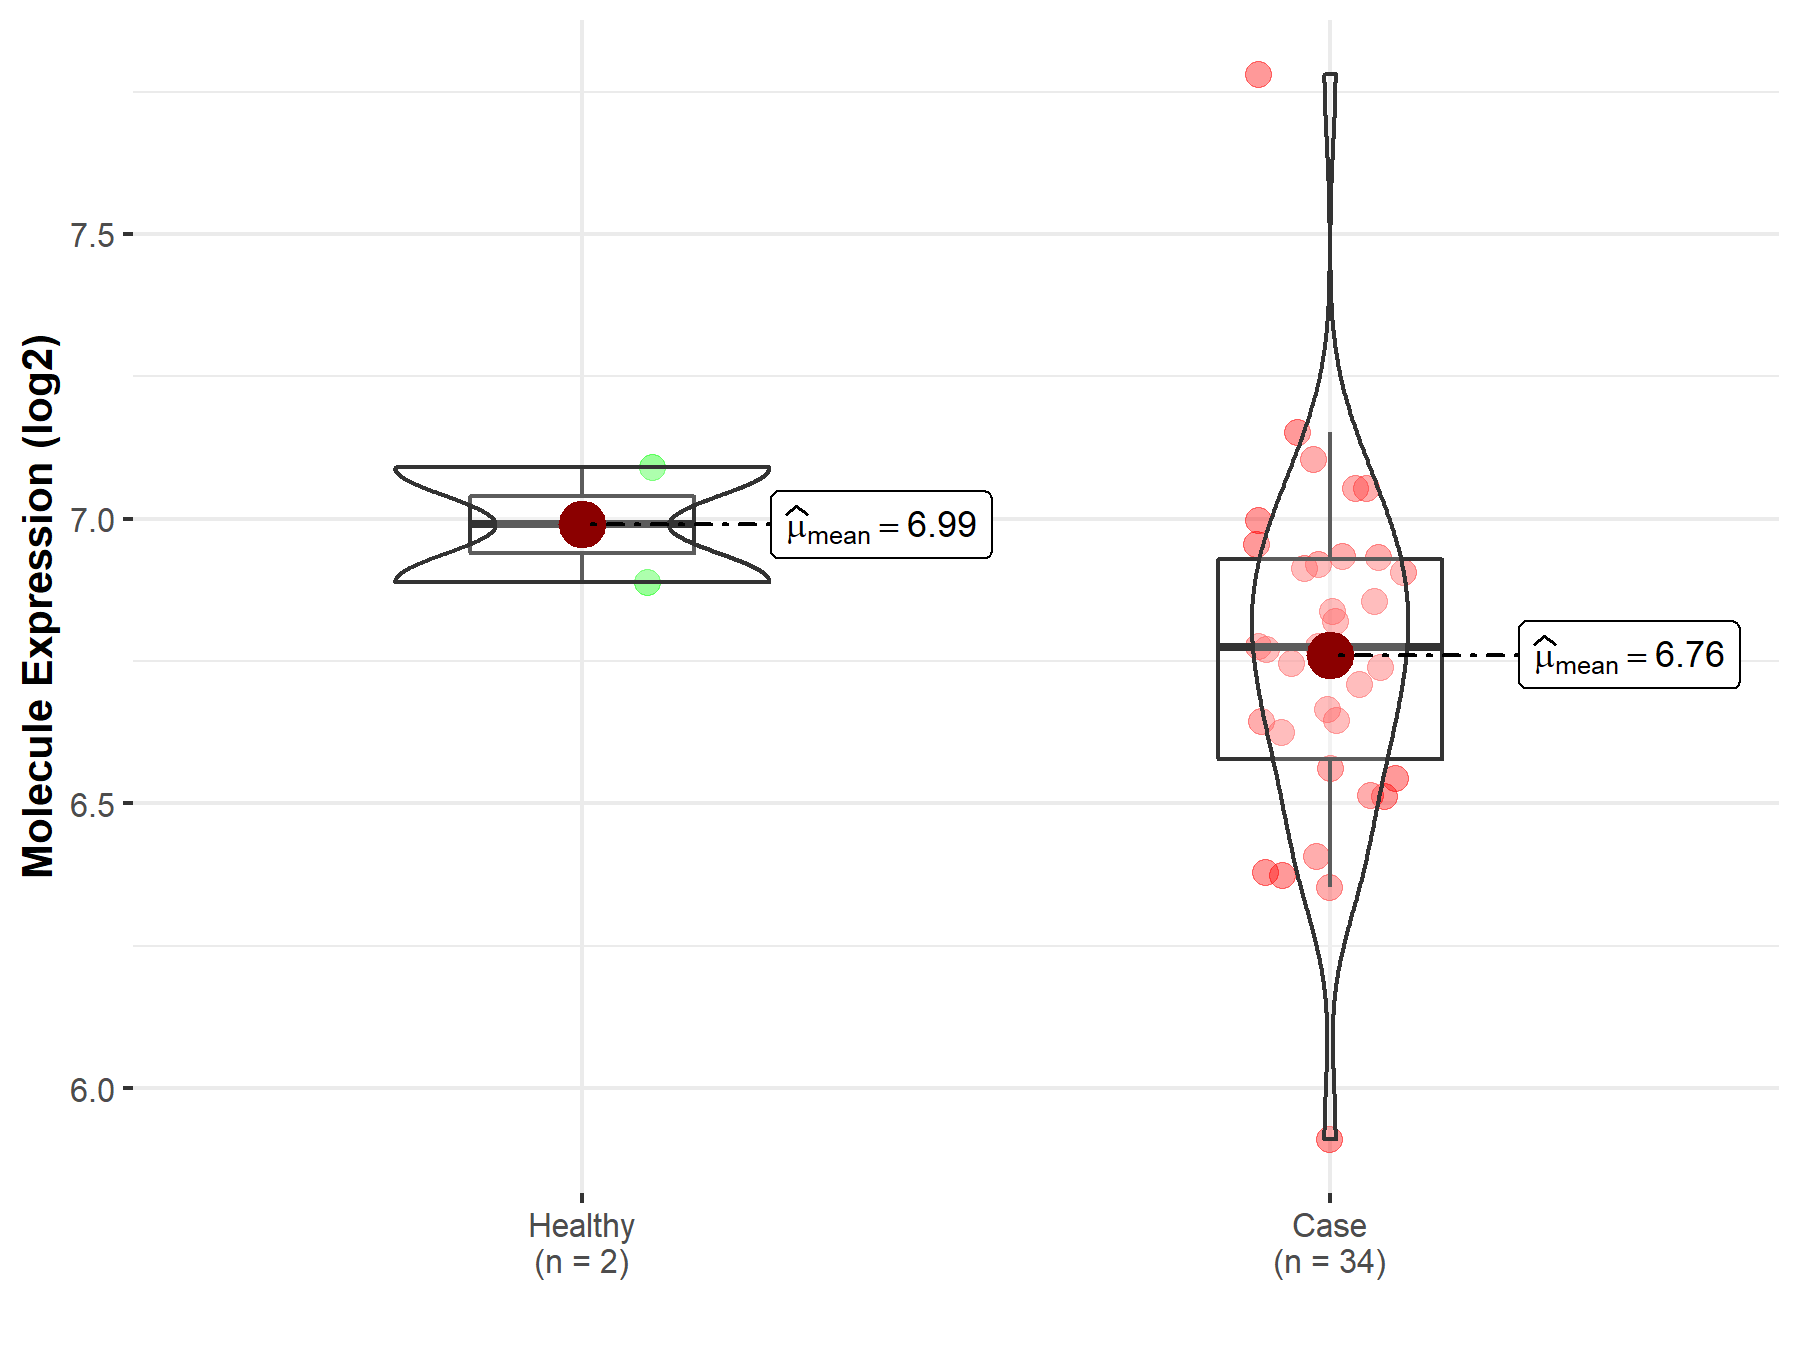
| Disease-specific Molecule Abundances |

|
Click to View the Clearer Original Diagram |
| The Studied Tissue | Brainstem tissue | |
| The Specified Disease | Glioma | |
| The Expression Level of Disease Section Compare with the Healthy Individual Tissue | p-value: 2.09E-01; Fold-change: -2.16E-01; Z-score: -1.52E+00 | |
|
Molecule expression in the diseased tissue of patients
Molecule expression in the normal tissue of healthy individuals
|
||
| Disease-specific Molecule Abundances |
|
Click to View the Clearer Original Diagram |
| The Studied Tissue | White matter | |
| The Specified Disease | Glioma | |
| The Expression Level of Disease Section Compare with the Healthy Individual Tissue | p-value: 1.39E-04; Fold-change: 1.28E+00; Z-score: 1.97E+00 | |
|
Molecule expression in the diseased tissue of patients
Molecule expression in the normal tissue of healthy individuals
|
||
| Disease-specific Molecule Abundances |

|
Click to View the Clearer Original Diagram |
| The Studied Tissue | Brainstem tissue | |
| The Specified Disease | Neuroectodermal tumor | |
| The Expression Level of Disease Section Compare with the Healthy Individual Tissue | p-value: 4.87E-07; Fold-change: 1.78E+00; Z-score: 3.99E+00 | |
|
Molecule expression in the diseased tissue of patients
Molecule expression in the normal tissue of healthy individuals
|
||
| Disease-specific Molecule Abundances |

|
Click to View the Clearer Original Diagram |
Tissue-specific Molecule Abundances in Healthy Individuals

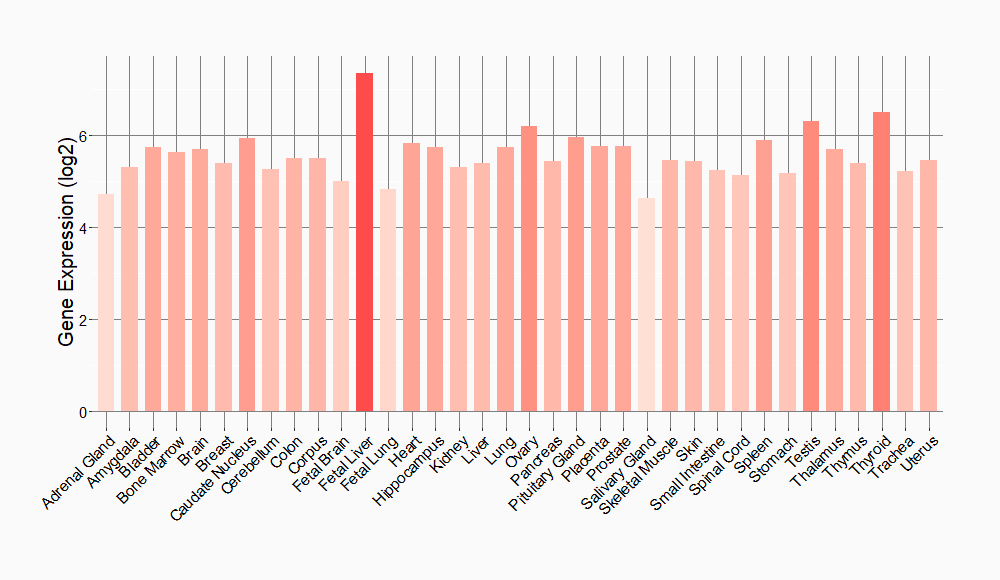
|
||
References
If you find any error in data or bug in web service, please kindly report it to Dr. Sun and Dr. Yu.