Molecule Information
General Information of the Molecule (ID: Mol00260)
| Name |
Bromodomain-containing protein 7 (BRD7)
,Homo sapiens
|
||||
|---|---|---|---|---|---|
| Synonyms |
75 kDa bromodomain protein; Protein CELTIX-1; BP75; CELTIX1
Click to Show/Hide
|
||||
| Molecule Type |
Protein
|
||||
| Gene Name |
BRD7
|
||||
| Gene ID | |||||
| Location |
chr16:50313487-50368988[-]
|
||||
| Sequence |
MGKKHKKHKSDKHLYEEYVEKPLKLVLKVGGNEVTELSTGSSGHDSSLFEDKNDHDKHKD
RKRKKRKKGEKQIPGEEKGRKRRRVKEDKKKRDRDRVENEAEKDLQCHAPVRLDLPPEKP LTSSLAKQEEVEQTPLQEALNQLMRQLQRKDPSAFFSFPVTDFIAPGYSMIIKHPMDFST MKEKIKNNDYQSIEELKDNFKLMCTNAMIYNKPETIYYKAAKKLLHSGMKILSQERIQSL KQSIDFMADLQKTRKQKDGTDTSQSGEDGGCWQREREDSGDAEAHAFKSPSKENKKKDKD MLEDKFKSNNLEREQEQLDRIVKESGGKLTRRLVNSQCEFERRKPDGTTTLGLLHPVDPI VGEPGYCPVRLGMTTGRLQSGVNTLQGFKEDKRNKVTPVLYLNYGPYSSYAPHYDSTFAN ISKDDSDLIYSTYGEDSDLPSDFSIHEFLATCQDYPYVMADSLLDVLTKGGHSRTLQEME MSLPEDEGHTRTLDTAKEMEITEVEPPGRLDSSTQDRLIALKAVTNFGVPVEVFDSEEAE IFQKKLDETTRLLRELQEAQNERLSTRPPPNMICLLGPSYREMHLAEQVTNNLKELAQQV TPGDIVSTYGVRKAMGISIPSPVMENNFVDLTEDTEEPKKTDVAECGPGGS Click to Show/Hide
|
||||
| 3D-structure |
|
||||
| Function |
Acts both as coactivator and as corepressor. May play a role in chromatin remodeling. Activator of the Wnt signaling pathway in a DVL1-dependent manner by negatively regulating the GSK3B phosphotransferase activity. Induces dephosphorylation of GSK3B at 'Tyr-216'. Down-regulates TRIM24-mediated activation of transcriptional activation by AR (By similarity). Transcriptional corepressor that down-regulates the expression of target genes. Binds to target promoters, leading to increased histone H3 acetylation at 'Lys-9' (H3K9ac). Binds to the ESR1 promoter. Recruits BRCA1 and POU2F1 to the ESR1 promoter. Coactivator for TP53-mediated activation of transcription of a set of target genes. Required for TP53-mediated cell-cycle arrest in response to oncogene activation. Promotes acetylation of TP53 at 'Lys-382', and thereby promotes efficient recruitment of TP53 to target promoters. Inhibits cell cycle progression from G1 to S phase.
Click to Show/Hide
|
||||
| Uniprot ID | |||||
| Ensembl ID | |||||
| HGNC ID | |||||
| Click to Show/Hide the Complete Species Lineage | |||||
Type(s) of Resistant Mechanism of This Molecule
 UAPP: Unusual Activation of Pro-survival Pathway
Drug Resistance Data Categorized by Drug
Approved Drug(s)
1 drug(s) in total
| Drug Resistance Data Categorized by Their Corresponding Mechanisms | ||||
|
Unusual Activation of Pro-survival Pathway (UAPP)
|
||||
| Disease Class: Esophageal adenocarcinoma [ICD-11: 2B70.2] | [1] | |||
| Resistant Disease | Esophageal adenocarcinoma [ICD-11: 2B70.2] | |||
| Resistant Drug | Cisplatin | |||
| Molecule Alteration | Expression | Down-regulation |
||
| Experimental Note | Identified from the Human Clinical Data | |||
| Cell Pathway Regulation | Beta-catenin signaling pathway | Activation | hsa04520 | |
| Cell apoptosis | Inhibition | hsa04210 | ||
| Cell proliferation | Activation | hsa05200 | ||
| In Vitro Model | Ishikawa cells | Endometrium | Homo sapiens (Human) | CVCL_2529 |
| HEC-1A cells | Uterus | Homo sapiens (Human) | CVCL_0293 | |
| 2774 cells | Ovary | Homo sapiens (Human) | CVCL_0420 | |
| AN3CA cells | Ovary | Homo sapiens (Human) | CVCL_0028 | |
| KLE cells | Ovary | Homo sapiens (Human) | CVCL_1329 | |
| Experiment for Molecule Alteration |
Western blot analysis | |||
| Experiment for Drug Resistance |
MTT assay | |||
| Mechanism Description | BRD7 is known to mediate tumor suppression by down-regulation of the beta-catenin pathway through accumulation of beta-catenin in the cytoplasm. miR-200c regulated the translocation of beta-catenin from the cytoplasm to the nucleus via inhibition of BRD7, resulting in increased expression of its transcriptional target genes, cyclinD1 and c-myc, miR-200c induces additive effect on the cisplatin cytotoxicity of endometrial carcinoma cells. | |||
Disease- and Tissue-specific Abundances of This Molecule
ICD Disease Classification 02

| Differential expression of molecule in resistant diseases | ||
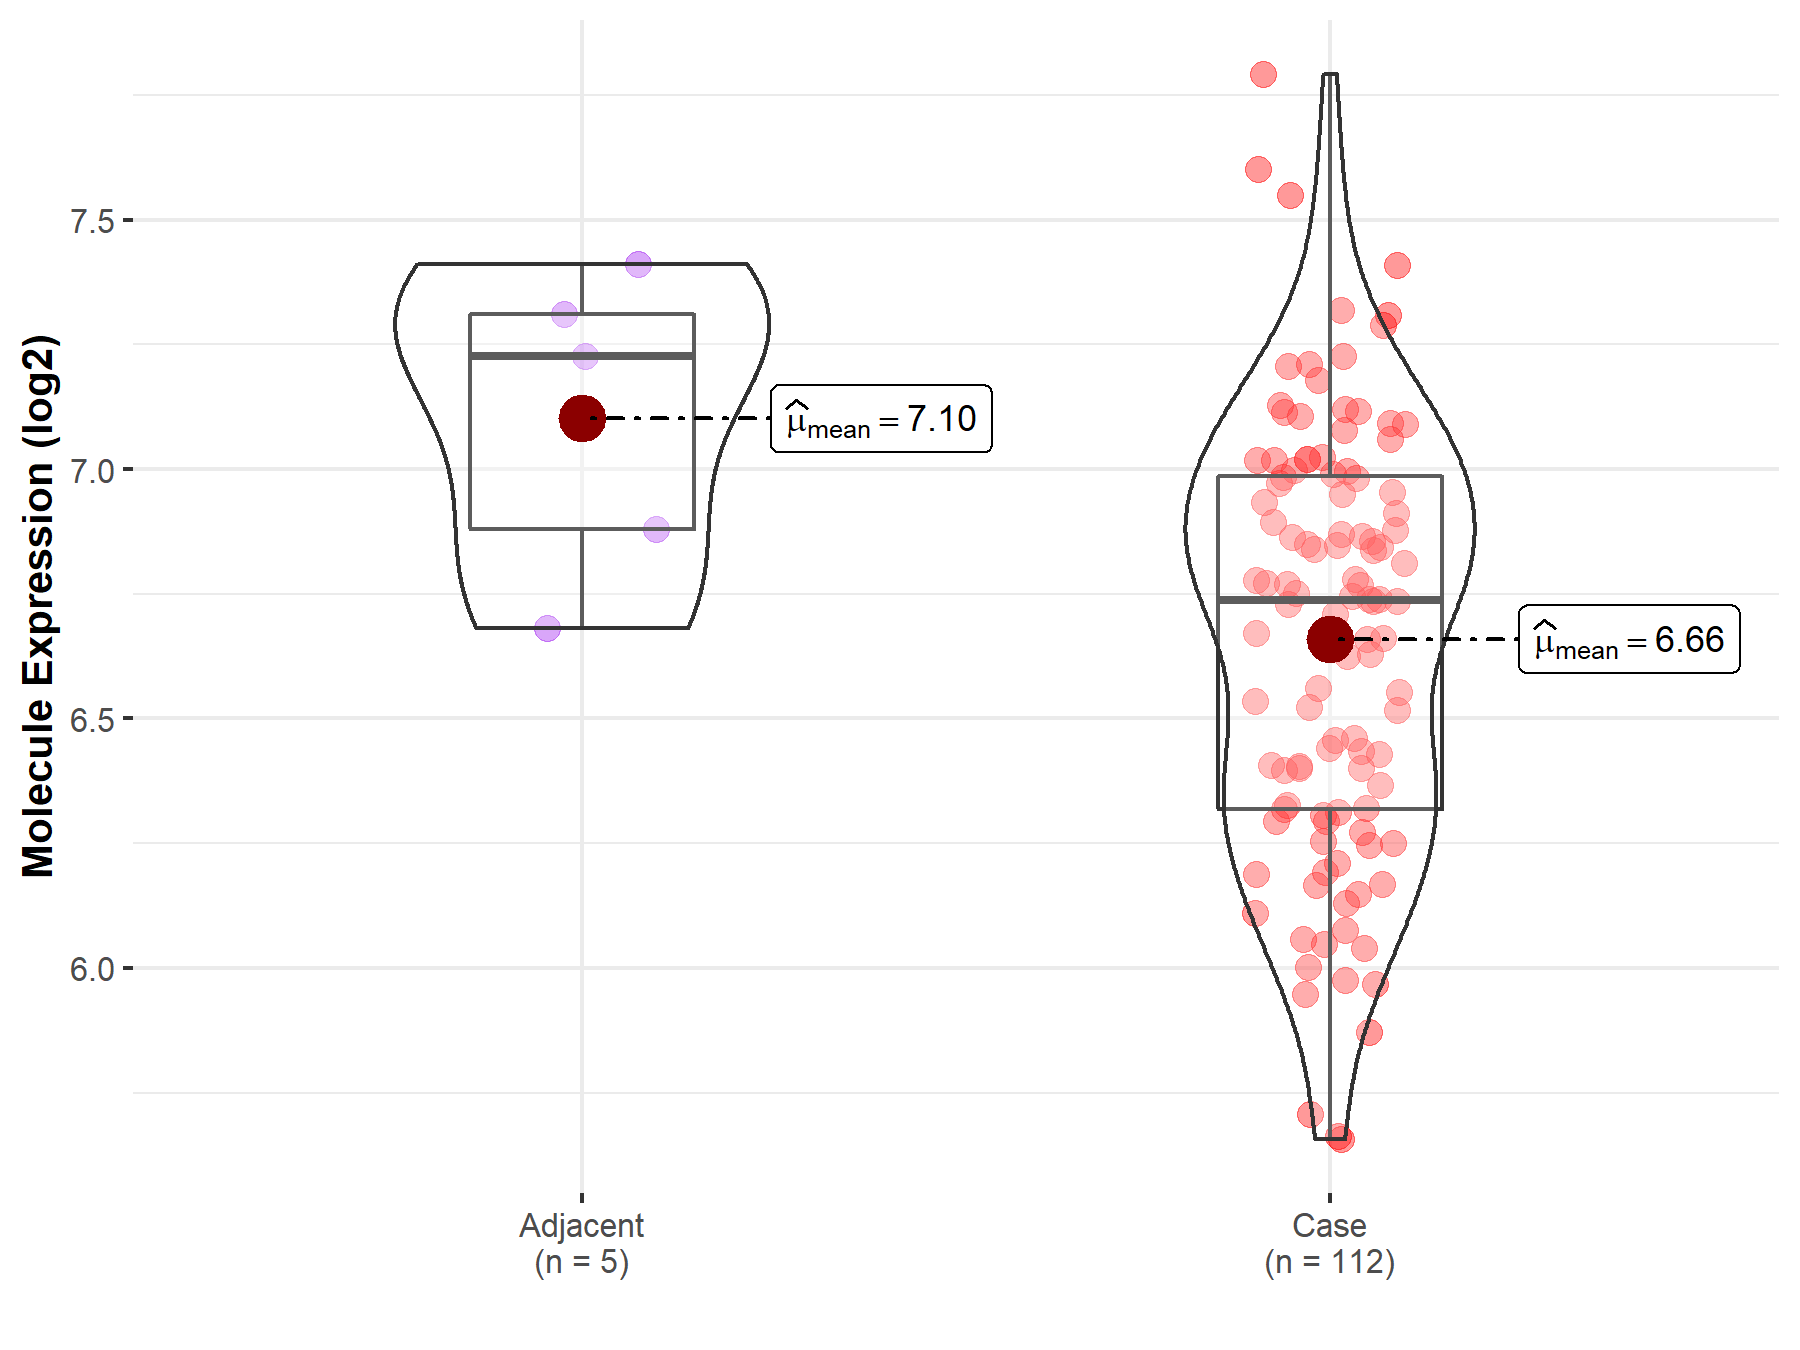
| The Studied Tissue | Esophagus | |
| The Specified Disease | Esophageal cancer | |
| The Expression Level of Disease Section Compare with the Adjacent Tissue | p-value: 2.97E-02; Fold-change: -4.89E-01; Z-score: -1.59E+00 | |
|
Molecule expression in the normal tissue adjacent to the diseased tissue of patients
Molecule expression in the diseased tissue of patients
|
||
| Disease-specific Molecule Abundances |
|
Click to View the Clearer Original Diagram |
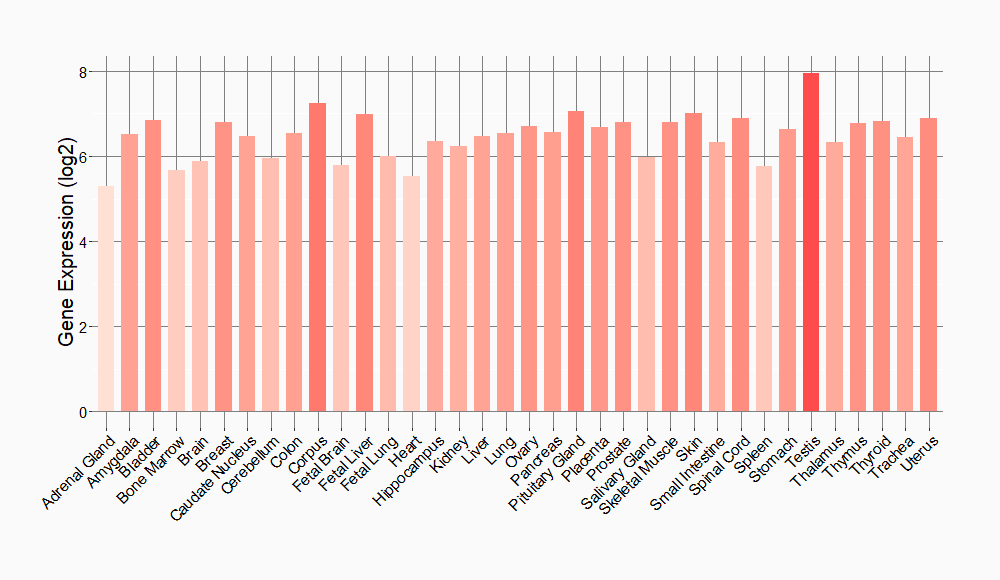
Tissue-specific Molecule Abundances in Healthy Individuals

|
||
References
If you find any error in data or bug in web service, please kindly report it to Dr. Sun and Dr. Yu.