Molecule Information
General Information of the Molecule (ID: Mol00010)
| Name |
A-kinase anchor protein 1 (AKAP1)
,Homo sapiens
|
||||
|---|---|---|---|---|---|
| Synonyms |
A-kinase anchor protein 149 kDa; AKAP 149; Dual specificity A-kinase-anchoring protein 1; D-AKAP-1; Protein kinase A-anchoring protein 1; PRKA1; Spermatid A-kinase anchor protein 84; S-AKAP84; AKAP149; PRKA1
Click to Show/Hide
|
||||
| Molecule Type |
Protein
|
||||
| Gene Name |
AKAP1
|
||||
| Gene ID | |||||
| Location |
chr17:57085092-57121346[+]
|
||||
| Sequence |
MAIQFRSLFPLALPGMLALLGWWWFFSRKKGHVSSHDEQQVEAGAVQLRADPAIKEPLPV
EDVCPKVVSTPPSVTEPPEKELSTVSKLPAEPPALLQTHPPCRRSESSGILPNTTDMRLR PGTRRDDSTKLELALTGGEAKSIPLECPLSSPKGVLFSSKSAEVCKQDSPFSRVPRKVQP GYPVVPAEKRSSGERARETGGAEGTGDAVLGEKVLEEALLSREHVLELENSKGPSLASLE GEEDKGKSSSSQVVGPVQEEEYVAEKLPSRFIESAHTELAKDDAAPAPPVADAKAQDRGV EGELGNEESLDRNEEGLDRNEEGLDRNEESLDRNEEGLDRNEEIKRAAFQIISQVISEAT EQVLATTVGKVAGRVCQASQLQGQKEESCVPVHQKTVLGPDTAEPATAEAAVAPPDAGLP LPGLPAEGSPPPKTYVSCLKSLLSSPTKDSKPNISAHHISLASCLALTTPSEELPDRAGI LVEDATCVTCMSDSSQSVPLVASPGHCSDSFSTSGLEDSCTETSSSPRDKAITPPLPEST VPFSNGVLKGELSDLGAEDGWTMDAEADHSGGSDRNSMDSVDSCCSLKKTESFQNAQAGS NPKKVDLIIWEIEVPKHLVGRLIGKQGRYVSFLKQTSGAKIYISTLPYTQSVQICHIEGS QHHVDKALNLIGKKFKELNLTNIYAPPLPSLALPSLPMTSWLMLPDGITVEVIVVNQVNA GHLFVQQHTHPTFHALRSLDQQMYLCYSQPGIPTLPTPVEITVICAAPGADGAWWRAQVV ASYEETNEVEIRYVDYGGYKRVKVDVLRQIRSDFVTLPFQGAEVLLDSVMPLSDDDQFSP EADAAMSEMTGNTALLAQVTSYSPTGLPLIQLWSVVGDEVVLINRSLVERGLAQWVDSYY TSL Click to Show/Hide
|
||||
| Function |
Binds to type I and II regulatory subunits of protein kinase A and anchors them to the cytoplasmic face of the mitochondrial outer membrane. Involved in mitochondrial-mediated antiviral innate immunity. Promotes translocation of NDUFS1 into mitochondria to regulate mitochondrial membrane respiratory chain NADH dehydrogenase (Complex I) activity.
Click to Show/Hide
|
||||
| Uniprot ID | |||||
| Ensembl ID | |||||
| HGNC ID | |||||
| Click to Show/Hide the Complete Species Lineage | |||||
Type(s) of Resistant Mechanism of This Molecule
 UAPP: Unusual Activation of Pro-survival Pathway
Drug Resistance Data Categorized by Drug
Approved Drug(s)
1 drug(s) in total
| Drug Resistance Data Categorized by Their Corresponding Mechanisms | ||||
|
Unusual Activation of Pro-survival Pathway (UAPP)
|
||||
| Disease Class: Gastric cancer [ICD-11: 2B72.1] | [1] | |||
| Resistant Disease | Gastric cancer [ICD-11: 2B72.1] | |||
| Resistant Drug | Cisplatin | |||
| Molecule Alteration | Expression | Up-regulation |
||
| Experimental Note | Identified from the Human Clinical Data | |||
| In Vitro Model | SGC7901 cells | Gastric | Homo sapiens (Human) | CVCL_0520 |
| BGC823 cells | Gastric | Homo sapiens (Human) | CVCL_3360 | |
| BGC823CDDP cells | Gastric | Homo sapiens (Human) | CVCL_3360 | |
| SGC7901CDDP cells | Gastric | Homo sapiens (Human) | CVCL_0520 | |
| In Vivo Model | Nude mouse xenograft model | Mus musculus | ||
| Experiment for Molecule Alteration |
Luciferase reporter assay; Western blot analysis | |||
| Experiment for Drug Resistance |
CCK8 assay; PI/Annexin V-FITC Apoptosis Detection kit assay | |||
| Mechanism Description | miR148a-3p reconstitution sensitized CDDP-resistant cells to CDDP treatment through promoting mitochondrial fission and decreasing AkAP1 expression level; miR148a-3p reconstitution in CDDP-resistant cells inhibits the cyto-protective autophagy by suppressing RAB12 expression and mTOR1 activation. miR148a-3p sensitization of GC cells to CDDP in vivo includes suppression of AkAP1 and RAB12 expression levels. | |||
Disease- and Tissue-specific Abundances of This Molecule
ICD Disease Classification 02

| Differential expression of molecule in resistant diseases | ||
| The Studied Tissue | Gastric tissue | |
| The Specified Disease | Gastric cancer | |
| The Expression Level of Disease Section Compare with the Healthy Individual Tissue | p-value: 1.56E-01; Fold-change: -4.96E-01; Z-score: -1.47E+00 | |
| The Expression Level of Disease Section Compare with the Adjacent Tissue | p-value: 2.34E-01; Fold-change: 3.79E-01; Z-score: 6.99E-01 | |
|
Molecule expression in the normal tissue adjacent to the diseased tissue of patients
Molecule expression in the diseased tissue of patients
Molecule expression in the normal tissue of healthy individuals
|
||
| Disease-specific Molecule Abundances |
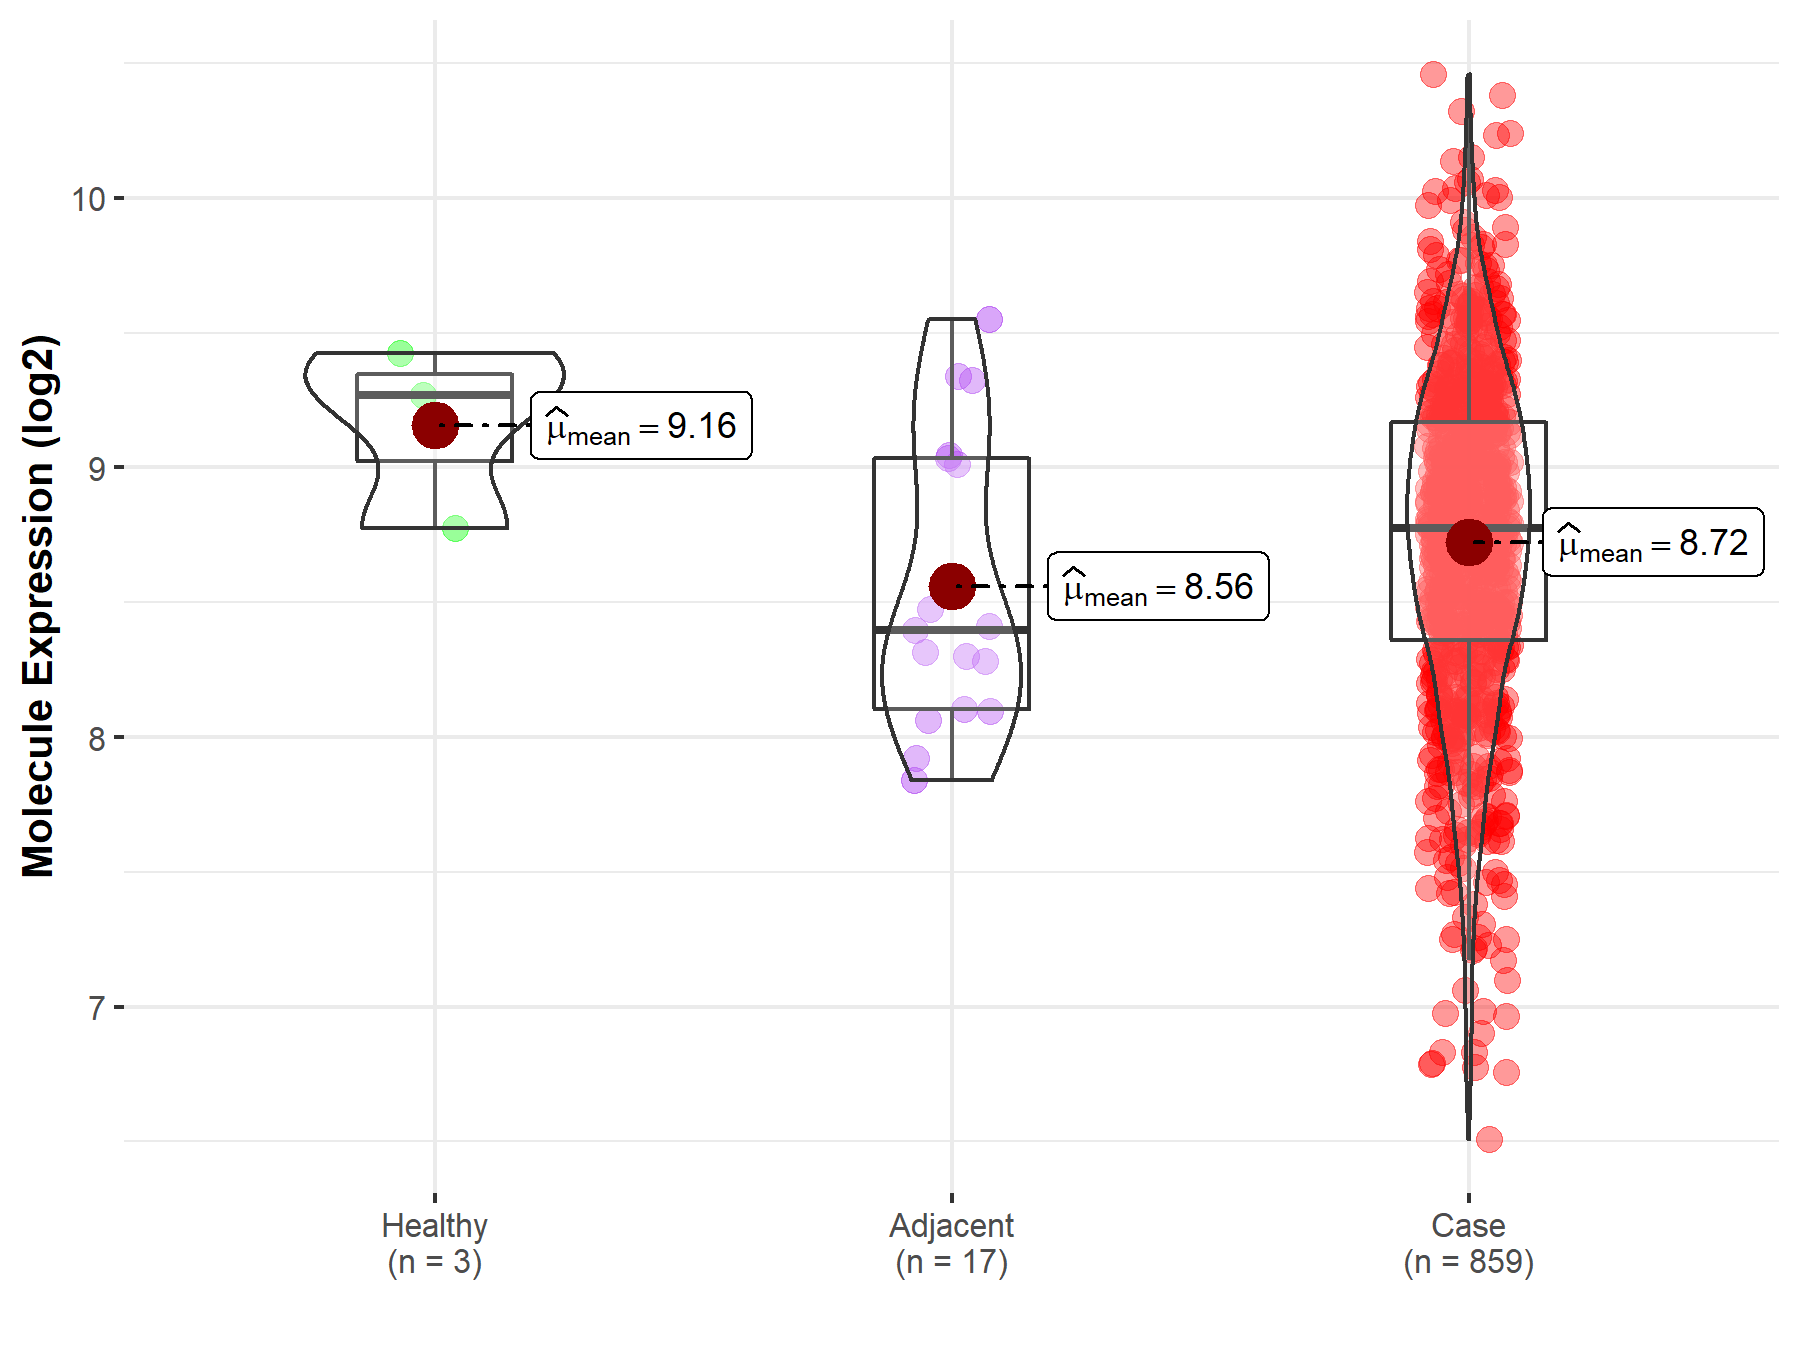
|
Click to View the Clearer Original Diagram |
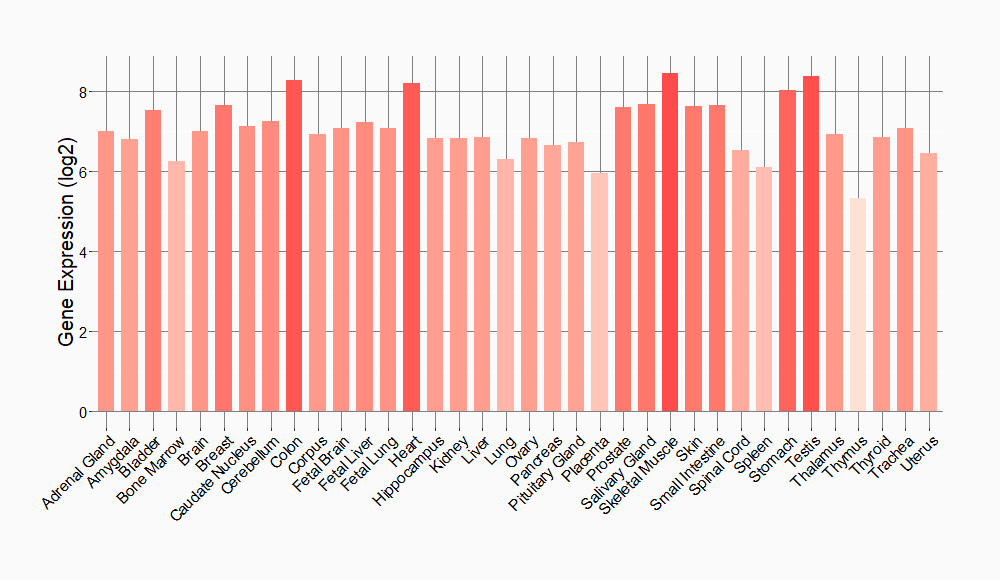
Tissue-specific Molecule Abundances in Healthy Individuals

|
||
References
If you find any error in data or bug in web service, please kindly report it to Dr. Sun and Dr. Yu.