Molecule Information
General Information of the Molecule (ID: Mol00007)
| Name |
Mammalian disintegrin-metalloprotease (ADAM10)
,Homo sapiens
|
||||
|---|---|---|---|---|---|
| Molecule Type |
Protein
|
||||
| Gene Name |
ADAM10
|
||||
| Gene ID | |||||
| Location |
chr15:58588809-58749791[-]
|
||||
| Sequence |
MVLLRVLILLLSWAAGMGGQYGNPLNKYIRHYEGLSYNVDSLHQKHQRAKRAVSHEDQFL
RLDFHAHGRHFNLRMKRDTSLFSDEFKVETSNKVLDYDTSHIYTGHIYGEEGSFSHGSVI DGRFEGFIQTRGGTFYVEPAERYIKDRTLPFHSVIYHEDDINYPHKYGPQGGCADHSVFE RMRKYQMTGVEEVTQIPQEEHAANGPELLRKKRTTSAEKNTCQLYIQTDHLFFKYYGTRE AVIAQISSHVKAIDTIYQTTDFSGIRNISFMVKRIRINTTADEKDPTNPFRFPNIGVEKF LELNSEQNHDDYCLAYVFTDRDFDDGVLGLAWVGAPSGSSGGICEKSKLYSDGKKKSLNT GIITVQNYGSHVPPKVSHITFAHEVGHNFGSPHDSGTECTPGESKNLGQKENGNYIMYAR ATSGDKLNNNKFSLCSIRNISQVLEKKRNNCFVESGQPICGNGMVEQGEECDCGYSDQCK DECCFDANQPEGRKCKLKPGKQCSPSQGPCCTAQCAFKSKSEKCRDDSDCAREGICNGFT ALCPASDPKPNFTDCNRHTQVCINGQCAGSICEKYGLEECTCASSDGKDDKELCHVCCMK KMDPSTCASTGSVQWSRHFSGRTITLQPGSPCNDFRGYCDVFMRCRLVDADGPLARLKKA IFSPELYENIAEWIVAHWWAVLLMGIALIMLMAGFIKICSVHTPSSNPKLPPPKPLPGTL KRRRPPQPIQQPQRQRPRESYQMGHMRR Click to Show/Hide
|
||||
| 3D-structure |
|
||||
| Function |
Cleaves the membrane-bound precursor of TNF-alpha at '76-Ala-|-Val-77' to its mature soluble form. Responsible for the proteolytical release of soluble JAM3 from endothelial cells surface. Responsible for the proteolytic release of several other cell-surface proteins, including heparin-binding epidermal growth-like factor, ephrin-A2, CD44, CDH2 and for constitutive and regulated alpha-secretase cleavage of amyloid precursor protein (APP). Contributes to the normal cleavage of the cellular prion protein. Involved in the cleavage of the adhesion molecule L1 at the cell surface and in released membrane vesicles, suggesting a vesicle-based protease activity. Controls also the proteolytic processing of Notch and mediates lateral inhibition during neurogenesis. Responsible for the FasL ectodomain shedding and for the generation of the remnant ADAM10-processed FasL (FasL APL) transmembrane form. Also cleaves the ectodomain of the integral membrane proteins CORIN and ITM2B. Mediates the proteolytic cleavage of LAG3, leading to release the secreted form of LAG3. Mediates the proteolytic cleavage of IL6R and IL11RA, leading to the release of secreted forms of IL6R and IL11RA. Enhances the cleavage of CHL1 by BACE1. Cleaves NRCAM. Cleaves TREM2, resulting in shedding of the TREM2 ectodomain. Involved in the development and maturation of glomerular and coronary vasculature. During development of the cochlear organ of Corti, promotes pillar cell separation by forming a ternary complex with CADH1 and EPHA4 and cleaving CADH1 at adherens junctions. May regulate the EFNA5-EPHA3 signaling.
Click to Show/Hide
|
||||
| Uniprot ID | |||||
| Ensembl ID | |||||
| HGNC ID | |||||
| Click to Show/Hide the Complete Species Lineage | |||||
Type(s) of Resistant Mechanism of This Molecule
 UAPP: Unusual Activation of Pro-survival Pathway
Drug Resistance Data Categorized by Drug
Approved Drug(s)
1 drug(s) in total
| Drug Sensitivity Data Categorized by Their Corresponding Mechanisms | ||||
|
Unusual Activation of Pro-survival Pathway (UAPP)
|
||||
| Disease Class: Gastric cancer [ICD-11: 2B72.1] | [1] | |||
| Sensitive Disease | Gastric cancer [ICD-11: 2B72.1] | |||
| Sensitive Drug | Cisplatin | |||
| Molecule Alteration | Expression | Down-regulation |
||
| Experimental Note | Revealed Based on the Cell Line Data | |||
| Cell Pathway Regulation | Cell growth | Inhibition | hsa05200 | |
| In Vitro Model | BGC-823 cells | Gastric | Homo sapiens (Human) | CVCL_3360 |
| MGC-803 cells | Gastric | Homo sapiens (Human) | CVCL_5334 | |
| SGC7901 cells | Gastric | Homo sapiens (Human) | CVCL_0520 | |
| AGS cells | Gastric | Homo sapiens (Human) | CVCL_0139 | |
| In Vivo Model | Nude mouse xenograft model | Mus musculus | ||
| Experiment for Molecule Alteration |
Western blot analysis; Luciferase reporter activity assay | |||
| Experiment for Drug Resistance |
MTS assay | |||
| Mechanism Description | Overexpression of miR320a inhibited tumor growth in vitro and in vivo and increased the sensitivity of GC cells to cisplatin by targeting ADAM10. | |||
Disease- and Tissue-specific Abundances of This Molecule
ICD Disease Classification 02

| Differential expression of molecule in resistant diseases | ||
| The Studied Tissue | Gastric tissue | |
| The Specified Disease | Gastric cancer | |
| The Expression Level of Disease Section Compare with the Healthy Individual Tissue | p-value: 1.38E-01; Fold-change: 1.29E+00; Z-score: 1.71E+00 | |
| The Expression Level of Disease Section Compare with the Adjacent Tissue | p-value: 3.12E-06; Fold-change: 6.90E-01; Z-score: 1.41E+00 | |
|
Molecule expression in the normal tissue adjacent to the diseased tissue of patients
Molecule expression in the diseased tissue of patients
Molecule expression in the normal tissue of healthy individuals
|
||
| Disease-specific Molecule Abundances |
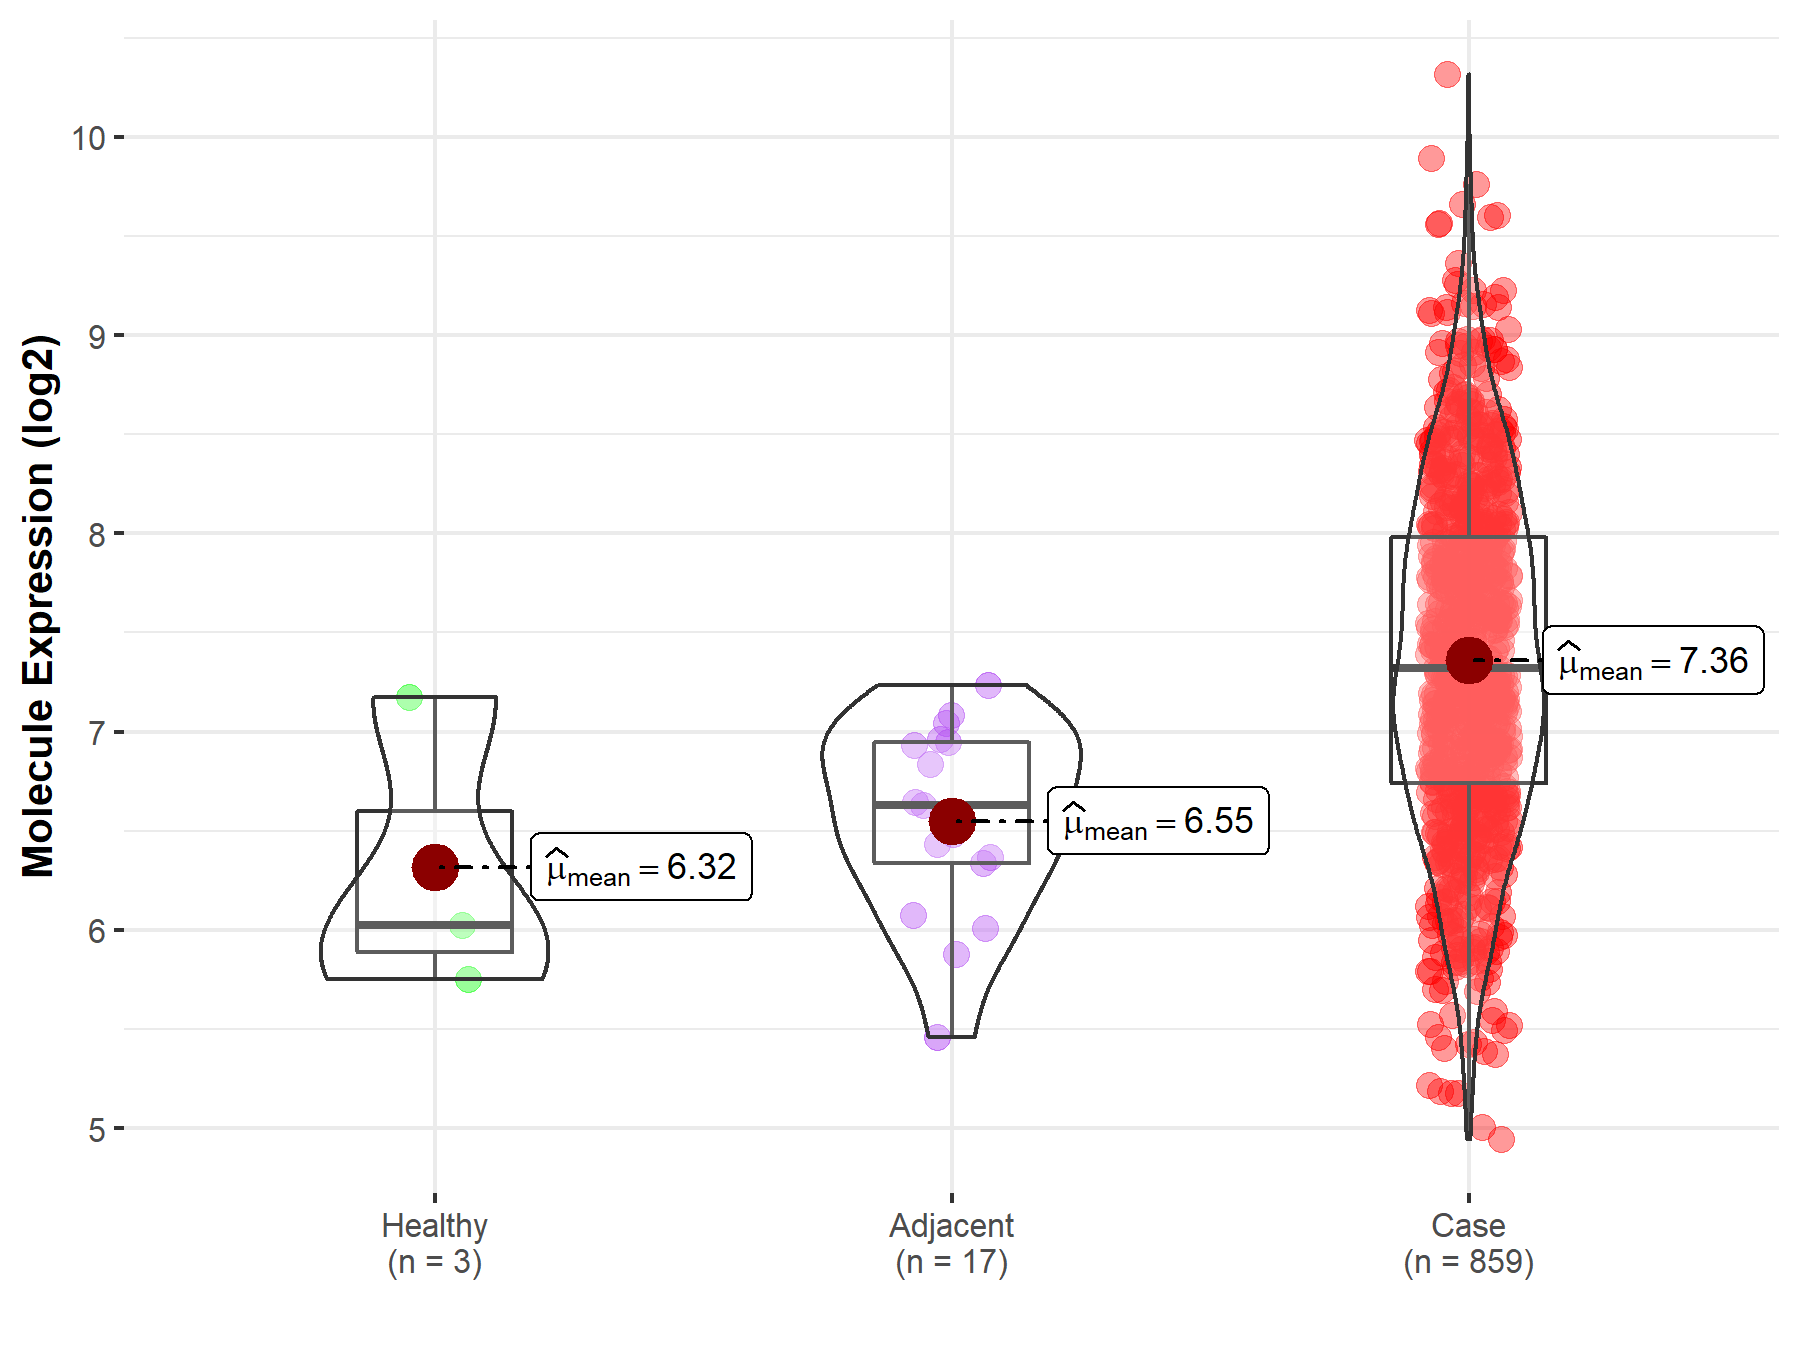
|
Click to View the Clearer Original Diagram |
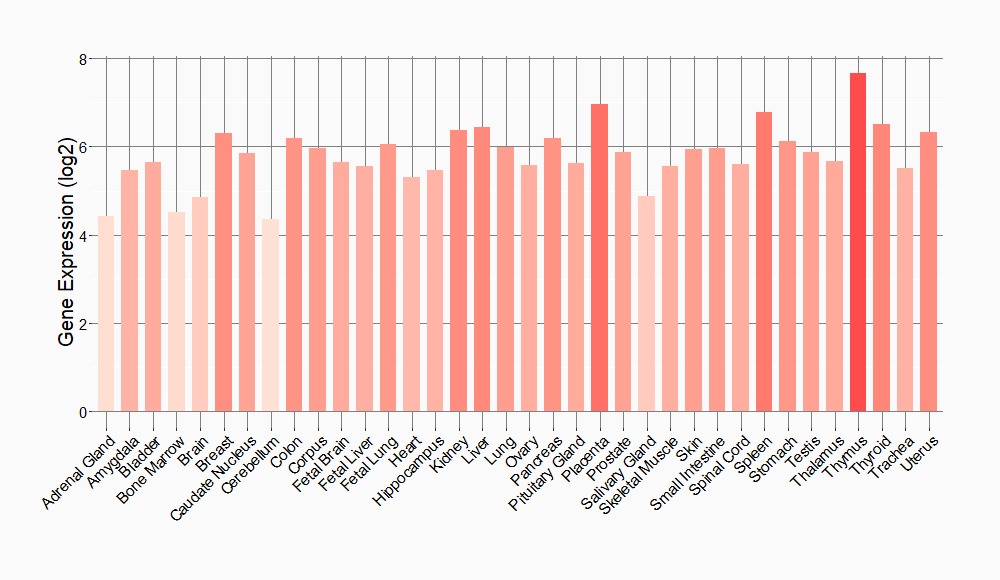
Tissue-specific Molecule Abundances in Healthy Individuals

|
||
References
If you find any error in data or bug in web service, please kindly report it to Dr. Sun and Dr. Yu.