Molecule Information
General Information of the Molecule (ID: Mol01890)
| Name |
L1 cell adhesion molecule (L1CAM)
,Homo sapiens
|
||||
|---|---|---|---|---|---|
| Synonyms |
L1CAM; CAML1; MIC5
Click to Show/Hide
|
||||
| Molecule Type |
Protein
|
||||
| Gene Name |
L1CAM
|
||||
| Gene ID | |||||
| Location |
chrX:153,861,514-153,886,173[-]
|
||||
| Sequence |
MVVALRYVWPLLLCSPCLLIQIPEEYEGHHVMEPPVITEQSPRRLVVFPTDDISLKCEAS
GKPEVQFRWTRDGVHFKPKEELGVTVYQSPHSGSFTITGNNSNFAQRFQGIYRCFASNKL GTAMSHEIRLMAEGAPKWPKETVKPVEVEEGESVVLPCNPPPSAEPLRIYWMNSKILHIK QDERVTMGQNGNLYFANVLTSDNHSDYICHAHFPGTRTIIQKEPIDLRVKATNSMIDRKP RLLFPTNSSSHLVALQGQPLVLECIAEGFPTPTIKWLRPSGPMPADRVTYQNHNKTLQLL KVGEEDDGEYRCLAENSLGSARHAYYVTVEAAPYWLHKPQSHLYGPGETARLDCQVQGRP QPEVTWRINGIPVEELAKDQKYRIQRGALILSNVQPSDTMVTQCEARNRHGLLLANAYIY VVQLPAKILTADNQTYMAVQGSTAYLLCKAFGAPVPSVQWLDEDGTTVLQDERFFPYANG TLGIRDLQANDTGRYFCLAANDQNNVTIMANLKVKDATQITQGPRSTIEKKGSRVTFTCQ ASFDPSLQPSITWRGDGRDLQELGDSDKYFIEDGRLVIHSLDYSDQGNYSCVASTELDVV ESRAQLLVVGSPGPVPRLVLSDLHLLTQSQVRVSWSPAEDHNAPIEKYDIEFEDKEMAPE KWYSLGKVPGNQTSTTLKLSPYVHYTFRVTAINKYGPGEPSPVSETVVTPEAAPEKNPVD VKGEGNETTNMVITWKPLRWMDWNAPQVQYRVQWRPQGTRGPWQEQIVSDPFLVVSNTST FVPYEIKVQAVNSQGKGPEPQVTIGYSGEDYPQAIPELEGIEILNSSAVLVKWRPVDLAQ VKGHLRGYNVTYWREGSQRKHSKRHIHKDHVVVPANTTSVILSGLRPYSSYHLEVQAFNG RGSGPASEFTFSTPEGVPGHPEALHLECQSNTSLLLRWQPPLSHNGVLTGYVLSYHPLDE GGKGQLSFNLRDPELRTHNLTDLSPHLRYRFQLQATTKEGPGEAIVREGGTMALSGISDF GNISATAGENYSVVSWVPKEGQCNFRFHILFKALGEEKGGASLSPQYVSYNQSSYTQWDL QPDTDYEIHLFKERMFRHQMAVKTNGTGRVRLPPAGFATEGWFIGFVSAIILLLLVLLIL CFIKRSKGGKYSVKDKEDTQVDSEARPMKDETFGEYRSLESDNEEKAFGSSQPSLNGDIK PLGSDDSLADYGGSVDVQFNEDGSFIGQYSGKKEKEAAGGNDSSGATSPINPAVALE Click to Show/Hide
|
||||
| 3D-structure |
|
||||
| Function |
Neural cell adhesion molecule involved in the dynamics of cell adhesion and in the generation of transmembrane signals at tyrosine kinase receptors. During brain development, critical in multiple processes, including neuronal migration, axonal growth and fasciculation, and synaptogenesis. In the mature brain, plays a role in the dynamics of neuronal structure and function, including synaptic plasticity.
Click to Show/Hide
|
||||
| Uniprot ID | |||||
| Ensembl ID | |||||
| HGNC ID | |||||
| Click to Show/Hide the Complete Species Lineage | |||||
Type(s) of Resistant Mechanism of This Molecule
Drug Resistance Data Categorized by Drug
Approved Drug(s)
2 drug(s) in total
| Drug Resistance Data Categorized by Their Corresponding Mechanisms | ||||
|
|
||||
| Disease Class: Ovarian cancer [ICD-11: 2C73.0] | [1] | |||
| Resistant Disease | Ovarian cancer [ICD-11: 2C73.0] | |||
| Resistant Drug | Anagrelide | |||
| Molecule Alteration | Expression | Down-regulation |
||
| Differential expression of the molecule in resistant disease | ||||
| Classification of Disease | Ovarian cancer [ICD-11: 2C73] | |||
| The Specified Disease | Ovarian cancer | |||
| The Studied Tissue | Blood | |||
| The Expression Level of Disease Section Compare with the Healthy Individual Tissue | p-value: 2.31E-10 Fold-change: -2.89E-01 Z-score: -6.73E+00 |
|||
| Experimental Note | Revealed Based on the Cell Line Data | |||
| Cell Pathway Regulation | Cell migration | Activation | hsa04670 | |
| In Vitro Model | 22RV1 cells | Prostate | Homo sapiens (Human) | CVCL_1045 |
| Experiment for Molecule Alteration |
Puromycin selection and monitored regularly for the maintenance of L1 silencing assay | |||
| Experiment for Drug Resistance |
Migration assay | |||
| Mechanism Description | With OVCAR3 cells treated with anagrelide, 2-hydroxy-5-fluoropyrimidine and mestranol , the gap width closure was seen from 48 h onward at all concentrations tested. Similar results were obtained with U251 cells, and L1's metastatic potential is further evidenced by its promotion of epithelial-mesenchymal transition, endothelial cell transcytosis and resistance to chemo- and radiotherapy. | |||
| Disease Class: Glioblastoma [ICD-11: 2A00.02] | [1] | |||
| Resistant Disease | Glioblastoma [ICD-11: 2A00.02] | |||
| Resistant Drug | Anagrelide | |||
| Molecule Alteration | Expression | Down-regulation |
||
| Differential expression of the molecule in resistant disease | ||||
| Classification of Disease | Brain cancer [ICD-11: 2A00] | |||
| The Specified Disease | Brain cancer | |||
| The Studied Tissue | Nervous tissue | |||
| The Expression Level of Disease Section Compare with the Healthy Individual Tissue | p-value: 5.83E-128 Fold-change: -2.68E-01 Z-score: -2.75E+01 |
|||
| Experimental Note | Revealed Based on the Cell Line Data | |||
| Cell Pathway Regulation | Cell migration | Activation | hsa04670 | |
| In Vitro Model | MDCK cells | Kidney | Canis lupus familiaris (Dog) (Canis familiaris) | CVCL_0422 |
| Experiment for Molecule Alteration |
Puromycin selection and monitored regularly for the maintenance of L1 silencing assay | |||
| Experiment for Drug Resistance |
Migration assay | |||
| Mechanism Description | With OVCAR3 cells treated with anagrelide, 2-hydroxy-5-fluoropyrimidine and mestranol , the gap width closure was seen from 48 h onward at all concentrations tested. Similar results were obtained with U251 cells, and L1's metastatic potential is further evidenced by its promotion of epithelial-mesenchymal transition, endothelial cell transcytosis and resistance to chemo- and radiotherapy. | |||
| Drug Resistance Data Categorized by Their Corresponding Mechanisms | ||||
|
|
||||
| Disease Class: Ovarian cancer [ICD-11: 2C73.0] | [1] | |||
| Resistant Disease | Ovarian cancer [ICD-11: 2C73.0] | |||
| Resistant Drug | Mestranol | |||
| Molecule Alteration | Expression | Down-regulation |
||
| Differential expression of the molecule in resistant disease | ||||
| Classification of Disease | Ovarian cancer [ICD-11: 2C73] | |||
| The Specified Disease | Ovarian cancer | |||
| The Studied Tissue | Blood | |||
| The Expression Level of Disease Section Compare with the Healthy Individual Tissue | p-value: 2.31E-10 Fold-change: -2.89E-01 Z-score: -6.73E+00 |
|||
| Experimental Note | Revealed Based on the Cell Line Data | |||
| Cell Pathway Regulation | Cell migration | Activation | hsa04670 | |
| In Vitro Model | 22RV1 cells | Prostate | Homo sapiens (Human) | CVCL_1045 |
| Experiment for Molecule Alteration |
Puromycin selection and monitored regularly for the maintenance of L1 silencing assay | |||
| Experiment for Drug Resistance |
Migration assay | |||
| Mechanism Description | With OVCAR3 cells treated with anagrelide, 2-hydroxy-5-fluoropyrimidine and mestranol , the gap width closure was seen from 48 h onward at all concentrations tested. Similar results were obtained with U251 cells, and L1's metastatic potential is further evidenced by its promotion of epithelial-mesenchymal transition, endothelial cell transcytosis and resistance to chemo- and radiotherapy. | |||
| Disease Class: Glioblastoma [ICD-11: 2A00.02] | [1] | |||
| Resistant Disease | Glioblastoma [ICD-11: 2A00.02] | |||
| Resistant Drug | Mestranol | |||
| Molecule Alteration | Expression | Down-regulation |
||
| Differential expression of the molecule in resistant disease | ||||
| Classification of Disease | Brain cancer [ICD-11: 2A00] | |||
| The Specified Disease | Glioblastoma | |||
| The Studied Tissue | Nervous tissue | |||
| The Expression Level of Disease Section Compare with the Healthy Individual Tissue | p-value: 5.40E-46 Fold-change: -3.38E+00 Z-score: -3.41E+01 |
|||
| Experimental Note | Revealed Based on the Cell Line Data | |||
| Cell Pathway Regulation | Cell migration | Activation | hsa04670 | |
| In Vitro Model | MDCK cells | Kidney | Canis lupus familiaris (Dog) (Canis familiaris) | CVCL_0422 |
| Experiment for Molecule Alteration |
Puromycin selection and monitored regularly for the maintenance of L1 silencing assay | |||
| Experiment for Drug Resistance |
Migration assay | |||
| Mechanism Description | With OVCAR3 cells treated with anagrelide, 2-hydroxy-5-fluoropyrimidine and mestranol , the gap width closure was seen from 48 h onward at all concentrations tested. Similar results were obtained with U251 cells, and L1's metastatic potential is further evidenced by its promotion of epithelial-mesenchymal transition, endothelial cell transcytosis and resistance to chemo- and radiotherapy. | |||
Investigative Drug(s)
1 drug(s) in total
| Drug Resistance Data Categorized by Their Corresponding Mechanisms | ||||
|
|
||||
| Disease Class: Ovarian cancer [ICD-11: 2C73.0] | [1] | |||
| Resistant Disease | Ovarian cancer [ICD-11: 2C73.0] | |||
| Resistant Drug | 2-hydroxy-5-fluoropyrimidine | |||
| Molecule Alteration | Expression | Down-regulation |
||
| Differential expression of the molecule in resistant disease | ||||
| Classification of Disease | Ovarian cancer [ICD-11: 2C73] | |||
| The Specified Disease | Ovarian cancer | |||
| The Studied Tissue | Blood | |||
| The Expression Level of Disease Section Compare with the Healthy Individual Tissue | p-value: 2.31E-10 Fold-change: -2.89E-01 Z-score: -6.73E+00 |
|||
| Experimental Note | Revealed Based on the Cell Line Data | |||
| Cell Pathway Regulation | Cell migration | Activation | hsa04670 | |
| In Vitro Model | 22RV1 cells | Prostate | Homo sapiens (Human) | CVCL_1045 |
| Experiment for Molecule Alteration |
Puromycin selection and monitored regularly for the maintenance of L1 silencing assay | |||
| Experiment for Drug Resistance |
Migration assay | |||
| Mechanism Description | With OVCAR3 cells treated with anagrelide, 2-hydroxy-5-fluoropyrimidine and mestranol , the gap width closure was seen from 48 h onward at all concentrations tested. Similar results were obtained with U251 cells, and L1's metastatic potential is further evidenced by its promotion of epithelial-mesenchymal transition, endothelial cell transcytosis and resistance to chemo- and radiotherapy. | |||
| Disease Class: Glioblastoma [ICD-11: 2A00.02] | [1] | |||
| Resistant Disease | Glioblastoma [ICD-11: 2A00.02] | |||
| Resistant Drug | 2-hydroxy-5-fluoropyrimidine | |||
| Molecule Alteration | Expression | Down-regulation |
||
| Differential expression of the molecule in resistant disease | ||||
| Classification of Disease | Brain cancer [ICD-11: 2A00] | |||
| The Specified Disease | Glioblastoma | |||
| The Studied Tissue | Nervous tissue | |||
| The Expression Level of Disease Section Compare with the Healthy Individual Tissue | p-value: 5.40E-46 Fold-change: -3.38E+00 Z-score: -3.41E+01 |
|||
| Experimental Note | Revealed Based on the Cell Line Data | |||
| Cell Pathway Regulation | Cell migration | Activation | hsa04670 | |
| In Vitro Model | MDCK cells | Kidney | Canis lupus familiaris (Dog) (Canis familiaris) | CVCL_0422 |
| Experiment for Molecule Alteration |
Puromycin selection and monitored regularly for the maintenance of L1 silencing assay | |||
| Experiment for Drug Resistance |
Migration assay | |||
| Mechanism Description | With OVCAR3 cells treated with anagrelide, 2-hydroxy-5-fluoropyrimidine and mestranol , the gap width closure was seen from 48 h onward at all concentrations tested. Similar results were obtained with U251 cells, and L1's metastatic potential is further evidenced by its promotion of epithelial-mesenchymal transition, endothelial cell transcytosis and resistance to chemo- and radiotherapy. | |||
Disease- and Tissue-specific Abundances of This Molecule
ICD Disease Classification 02

| Differential expression of molecule in resistant diseases | ||
| The Studied Tissue | Nervous tissue | |
| The Specified Disease | Brain cancer | |
| The Expression Level of Disease Section Compare with the Healthy Individual Tissue | p-value: 5.83E-128; Fold-change: -1.78E+00; Z-score: -2.43E+00 | |
|
Molecule expression in the diseased tissue of patients
Molecule expression in the normal tissue of healthy individuals
|
||
| Disease-specific Molecule Abundances |
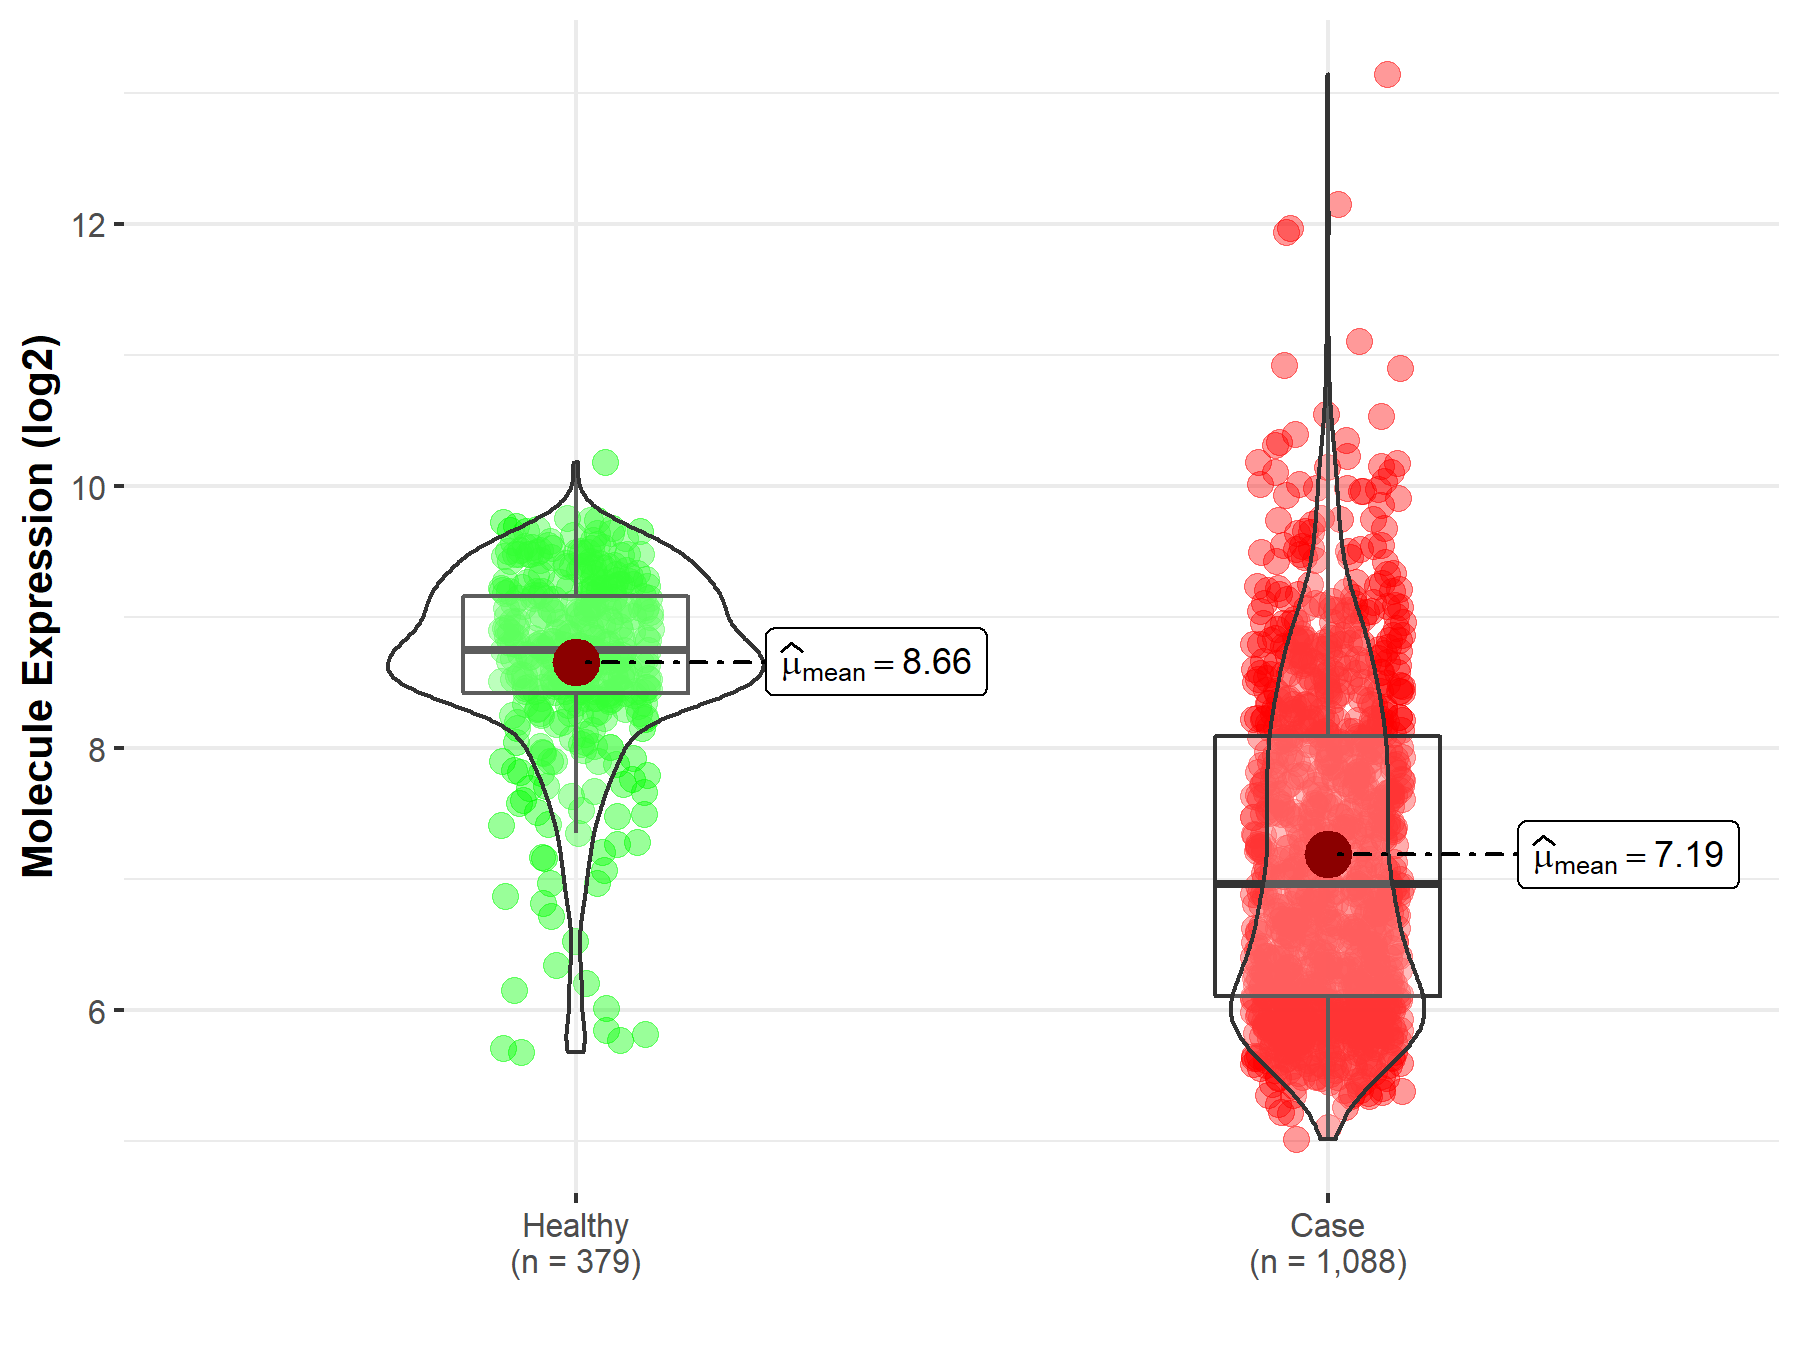
|
Click to View the Clearer Original Diagram |
| The Studied Tissue | Brainstem tissue | |
| The Specified Disease | Glioma | |
| The Expression Level of Disease Section Compare with the Healthy Individual Tissue | p-value: 2.79E-01; Fold-change: -5.20E-01; Z-score: -1.16E+00 | |
|
Molecule expression in the diseased tissue of patients
Molecule expression in the normal tissue of healthy individuals
|
||
| Disease-specific Molecule Abundances |
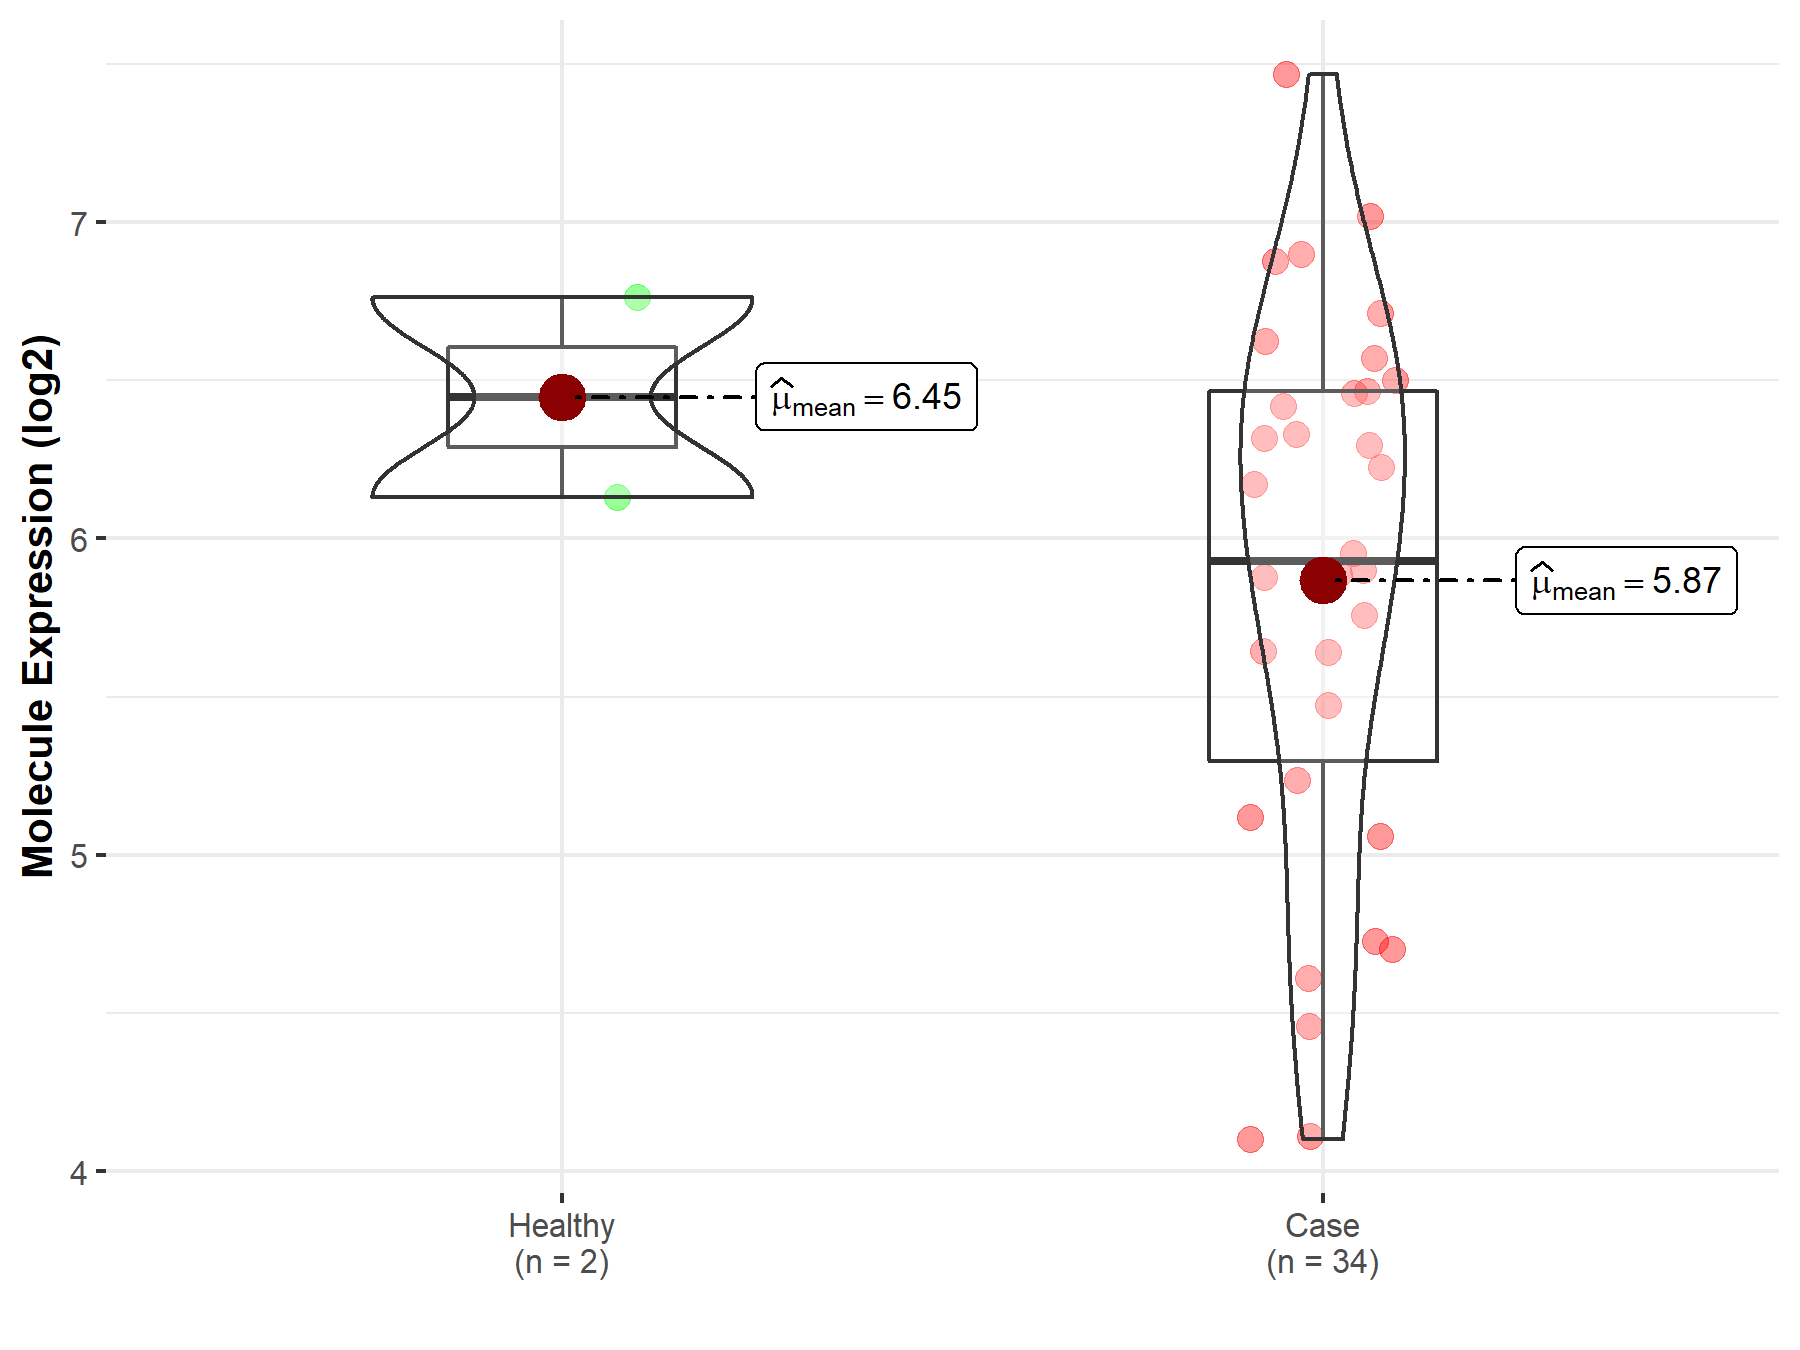
|
Click to View the Clearer Original Diagram |
| The Studied Tissue | White matter | |
| The Specified Disease | Glioma | |
| The Expression Level of Disease Section Compare with the Healthy Individual Tissue | p-value: 1.74E-03; Fold-change: 2.38E-01; Z-score: 9.47E-01 | |
|
Molecule expression in the diseased tissue of patients
Molecule expression in the normal tissue of healthy individuals
|
||
| Disease-specific Molecule Abundances |
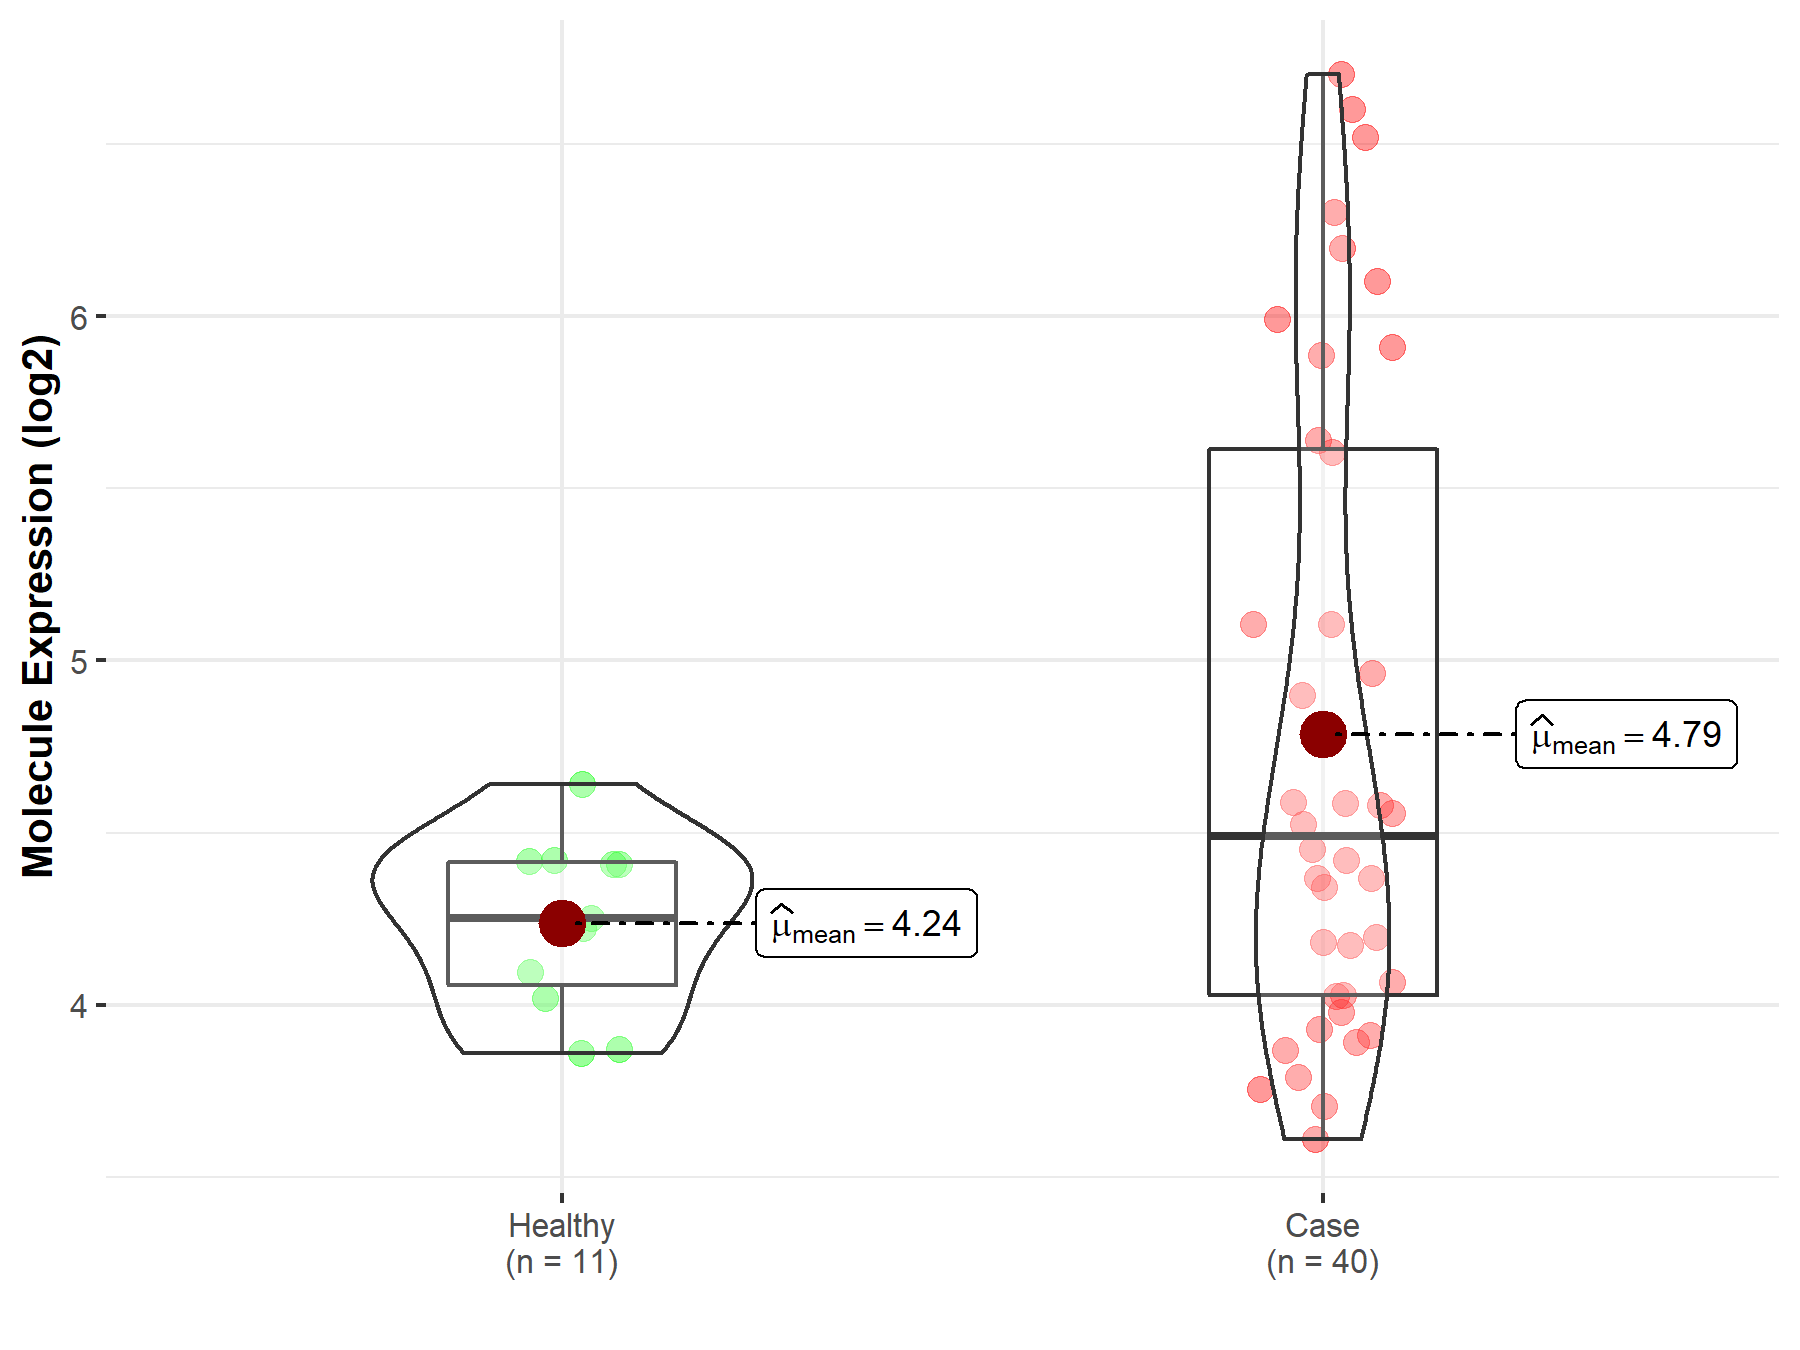
|
Click to View the Clearer Original Diagram |
| The Studied Tissue | Brainstem tissue | |
| The Specified Disease | Neuroectodermal tumor | |
| The Expression Level of Disease Section Compare with the Healthy Individual Tissue | p-value: 1.88E-01; Fold-change: 3.88E-01; Z-score: 9.57E-01 | |
|
Molecule expression in the diseased tissue of patients
Molecule expression in the normal tissue of healthy individuals
|
||
| Disease-specific Molecule Abundances |
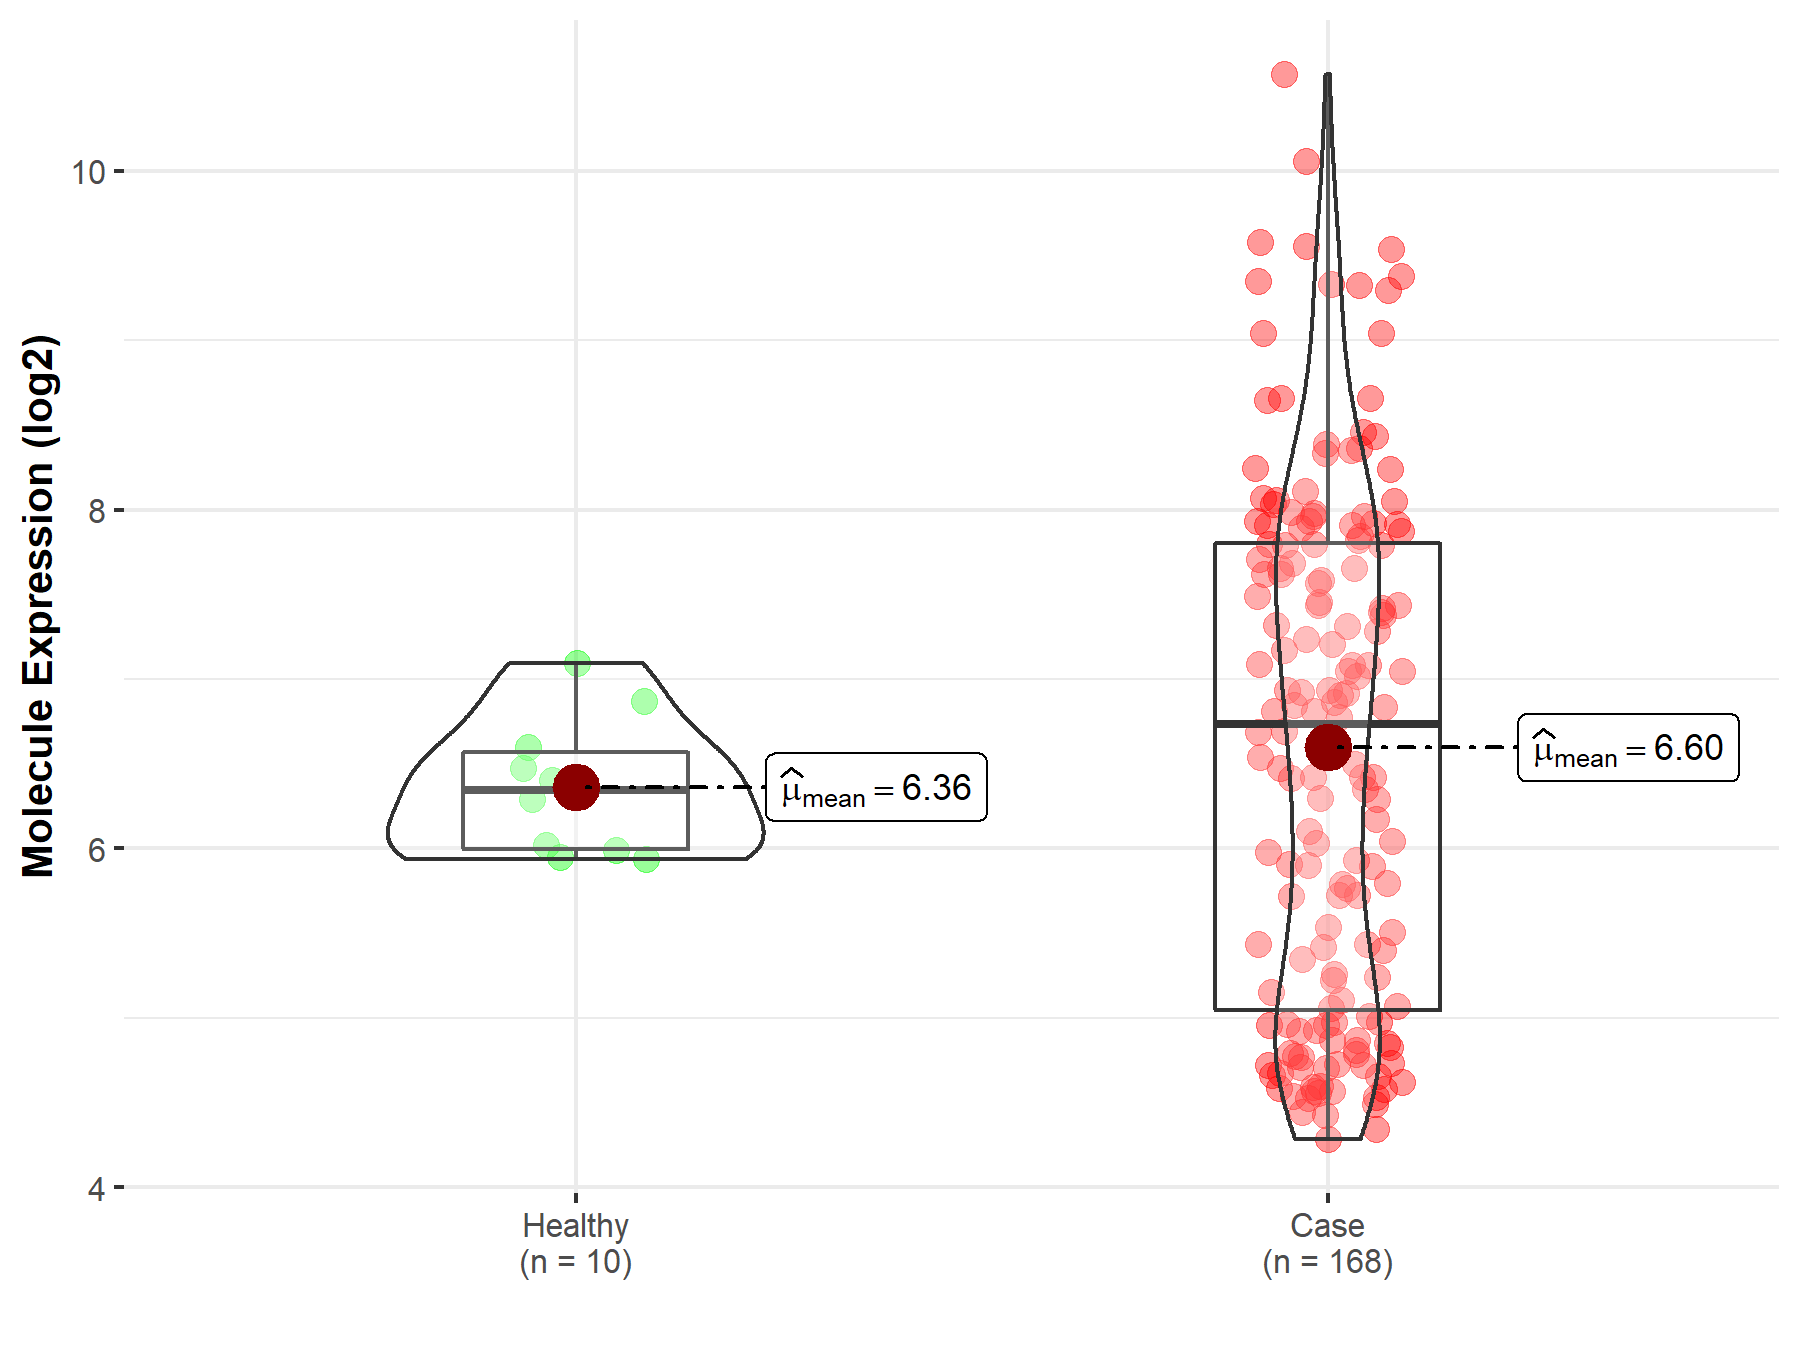
|
Click to View the Clearer Original Diagram |
| Differential expression of molecule in resistant diseases | ||
| The Studied Tissue | Ovary | |
| The Specified Disease | Ovarian cancer | |
| The Expression Level of Disease Section Compare with the Healthy Individual Tissue | p-value: 2.13E-08; Fold-change: 7.92E-01; Z-score: 3.74E+00 | |
| The Expression Level of Disease Section Compare with the Adjacent Tissue | p-value: 2.12E-06; Fold-change: 7.54E-01; Z-score: 1.76E+00 | |
|
Molecule expression in the normal tissue adjacent to the diseased tissue of patients
Molecule expression in the diseased tissue of patients
Molecule expression in the normal tissue of healthy individuals
|
||
| Disease-specific Molecule Abundances |

|
Click to View the Clearer Original Diagram |
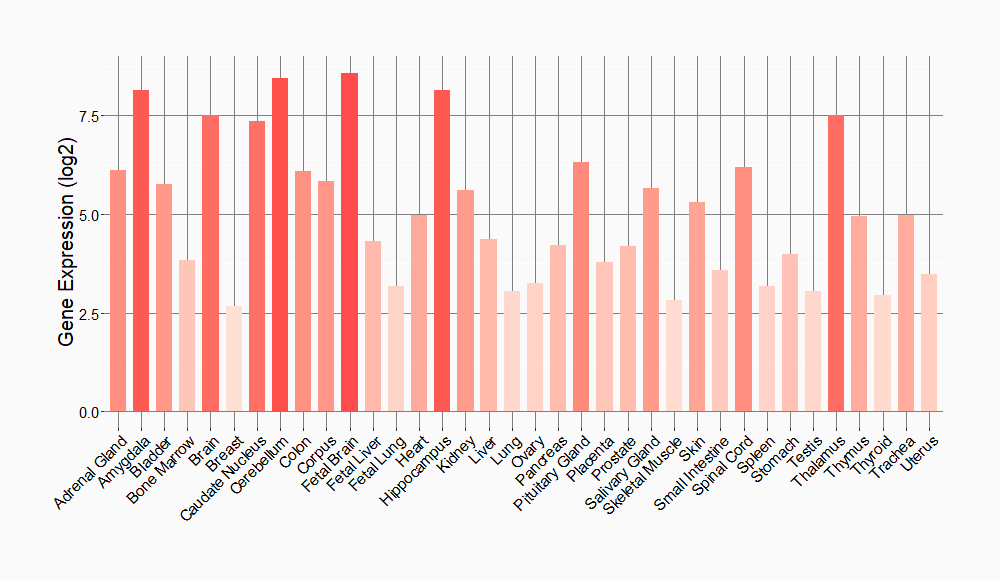
Tissue-specific Molecule Abundances in Healthy Individuals

|
||
References
If you find any error in data or bug in web service, please kindly report it to Dr. Sun and Dr. Yu.
