Molecule Information
General Information of the Molecule (ID: Mol00700)
| Name |
Vimentin (VIM)
,Homo sapiens
|
||||
|---|---|---|---|---|---|
| Molecule Type |
Protein
|
||||
| Gene Name |
VIM
|
||||
| Gene ID | |||||
| Location |
chr10:17228241-17237593[+]
|
||||
| Sequence |
MSTRSVSSSSYRRMFGGPGTASRPSSSRSYVTTSTRTYSLGSALRPSTSRSLYASSPGGV
YATRSSAVRLRSSVPGVRLLQDSVDFSLADAINTEFKNTRTNEKVELQELNDRFANYIDK VRFLEQQNKILLAELEQLKGQGKSRLGDLYEEEMRELRRQVDQLTNDKARVEVERDNLAE DIMRLREKLQEEMLQREEAENTLQSFRQDVDNASLARLDLERKVESLQEEIAFLKKLHEE EIQELQAQIQEQHVQIDVDVSKPDLTAALRDVRQQYESVAAKNLQEAEEWYKSKFADLSE AANRNNDALRQAKQESTEYRRQVQSLTCEVDALKGTNESLERQMREMEENFAVEAANYQD TIGRLQDEIQNMKEEMARHLREYQDLLNVKMALDIEIATYRKLLEGEESRISLPLPNFSS LNLRETNLDSLPLVDTHSKRTLLIKTVETRDGQVINETSQHHDDLE Click to Show/Hide
|
||||
| 3D-structure |
|
||||
| Function |
Vimentins are class-III intermediate filaments found in various non-epithelial cells, especially mesenchymal cells. Vimentin is attached to the nucleus, endoplasmic reticulum, and mitochondria, either laterally or terminally.
Click to Show/Hide
|
||||
| Uniprot ID | |||||
| Ensembl ID | |||||
| HGNC ID | |||||
| Click to Show/Hide the Complete Species Lineage | |||||
Type(s) of Resistant Mechanism of This Molecule
Drug Resistance Data Categorized by Drug
Approved Drug(s)
3 drug(s) in total
| Drug Sensitivity Data Categorized by Their Corresponding Mechanisms | ||||
|
|
||||
| Disease Class: Glioma [ICD-11: 2A00.1] | [1] | |||
| Sensitive Disease | Glioma [ICD-11: 2A00.1] | |||
| Sensitive Drug | Rabeprazole | |||
| Molecule Alteration | Expression | Up-regulation |
||
| Differential expression of the molecule in resistant disease | ||||
| Classification of Disease | Brain cancer [ICD-11: 2A00] | |||
| The Specified Disease | Glioma | |||
| The Studied Tissue | Nervous tissue | |||
| The Expression Level of Disease Section Compare with the Healthy Individual Tissue | p-value: 3.32E-25 Fold-change: 1.45E+00 Z-score: 2.27E+01 |
|||
| Experimental Note | Discovered Using In-vivo Testing Model | |||
| Cell Pathway Regulation | AKT/GSK3beta signaling pathway | Inhibition | hsa04931 | |
| NF-KappaB signaling pathway | Inhibition | hsa04064 | ||
| In Vitro Model | MDA-231 cells | Pleural effusion | Homo sapiens (Human) | CVCL_0062 |
| MJ cells | Peripheral blood | Homo sapiens (Human) | CVCL_1414 | |
| MMQ cells | Pituitary gland | Rattus norvegicus (Rat) | CVCL_2117 | |
| MOLM-13 cells | Peripheral blood | Homo sapiens (Human) | CVCL_2119 | |
| In Vivo Model | Male Wistar rats-Stereotaxic glioma model | Mus musculus | ||
| Experiment for Molecule Alteration |
Western blot analysis; Gene expression analysis | |||
| Experiment for Drug Resistance |
MTT assay; Scratch wound healing migration assay; Transwell invasion assay | |||
| Mechanism Description | Epithelial to mesenchymal transition (EMT) is pivotal in embryonic development and wound healing, whereas in cancer it inflicts malignancy and drug resistance. Rabeprazole has efficacy per se and reduces resistance to temozolomide in glioma via EMT inhibition. Rabeprazole suppressed EMT by impeding AKT/GSK3beta phosphorylation and/or NF-kappaB signaling and sensitized temozolomide resistance. | |||
| Drug Resistance Data Categorized by Their Corresponding Mechanisms | ||||
|
|
||||
| Disease Class: Malignant glioma [ICD-11: 2A00.2] | [2] | |||
| Resistant Disease | Malignant glioma [ICD-11: 2A00.2] | |||
| Resistant Drug | Temozolomide | |||
| Molecule Alteration | Expression | Up-regulation |
||
| Differential expression of the molecule in resistant disease | ||||
| Classification of Disease | Brain cancer [ICD-11: 2A00] | |||
| The Specified Disease | Brain cancer | |||
| The Studied Tissue | Nervous tissue | |||
| The Expression Level of Disease Section Compare with the Healthy Individual Tissue | p-value: 2.64E-132 Fold-change: 2.85E-01 Z-score: 2.89E+01 |
|||
| Experimental Note | Revealed Based on the Cell Line Data | |||
| Cell Pathway Regulation | Cell apoptosis | Inhibition | hsa04210 | |
| Cell viability | Activation | hsa05200 | ||
| Wnt/beta-catenin signaling pathway | Activation | hsa04310 | ||
| In Vitro Model | U251 cells | Brain | Homo sapiens (Human) | CVCL_0021 |
| M059J cells | Brain | Homo sapiens (Human) | CVCL_0400 | |
| Experiment for Molecule Alteration |
Western blot analysis; RNAi assay | |||
| Experiment for Drug Resistance |
MTT assay; Flow cytometry assay | |||
| Mechanism Description | Silencing of H19 decreases chemoresistance through suppressing EMT via the Wnt/beta-Catenin pathway. | |||
| Drug Sensitivity Data Categorized by Their Corresponding Mechanisms | ||||
|
|
||||
| Disease Class: Breast cancer [ICD-11: 2C60.3] | [3] | |||
| Sensitive Disease | Breast cancer [ICD-11: 2C60.3] | |||
| Sensitive Drug | Doxorubicin | |||
| Molecule Alteration | Expression | Down-regulation |
||
| Differential expression of the molecule in resistant disease | ||||
| Classification of Disease | Breast cancer [ICD-11: 2C60] | |||
| The Specified Disease | Breast cancer | |||
| The Studied Tissue | Breast tissue | |||
| The Expression Level of Disease Section Compare with the Healthy Individual Tissue | p-value: 2.24E-19 Fold-change: -8.01E-02 Z-score: -9.46E+00 |
|||
| Experimental Note | Revealed Based on the Cell Line Data | |||
| Cell Pathway Regulation | Cell apoptosis | Activation | hsa04210 | |
| Cell viability | Inhibition | hsa05200 | ||
| In Vitro Model | MCF-7 cells | Breast | Homo sapiens (Human) | CVCL_0031 |
| MDA-MB-231 cells | Breast | Homo sapiens (Human) | CVCL_0062 | |
| MDA-MB-468 cells | Breast | Homo sapiens (Human) | CVCL_0419 | |
| MCF10A cells | Breast | Homo sapiens (Human) | CVCL_0598 | |
| In Vivo Model | Nude mouse xenograft model | Mus musculus | ||
| Experiment for Molecule Alteration |
Western blot analysis | |||
| Experiment for Drug Resistance |
MTT assay | |||
| Mechanism Description | Overexpression of miR-708-3p dramatically inhibits breast cancer cell lung metastasis and the expression of ZEB1, CDH2 and vimentin was significantly decreased in miR-708-3p-overexpressing cells at both the mRNA and protein levels compared to that in vector control cells. | |||
Disease- and Tissue-specific Abundances of This Molecule
ICD Disease Classification 02

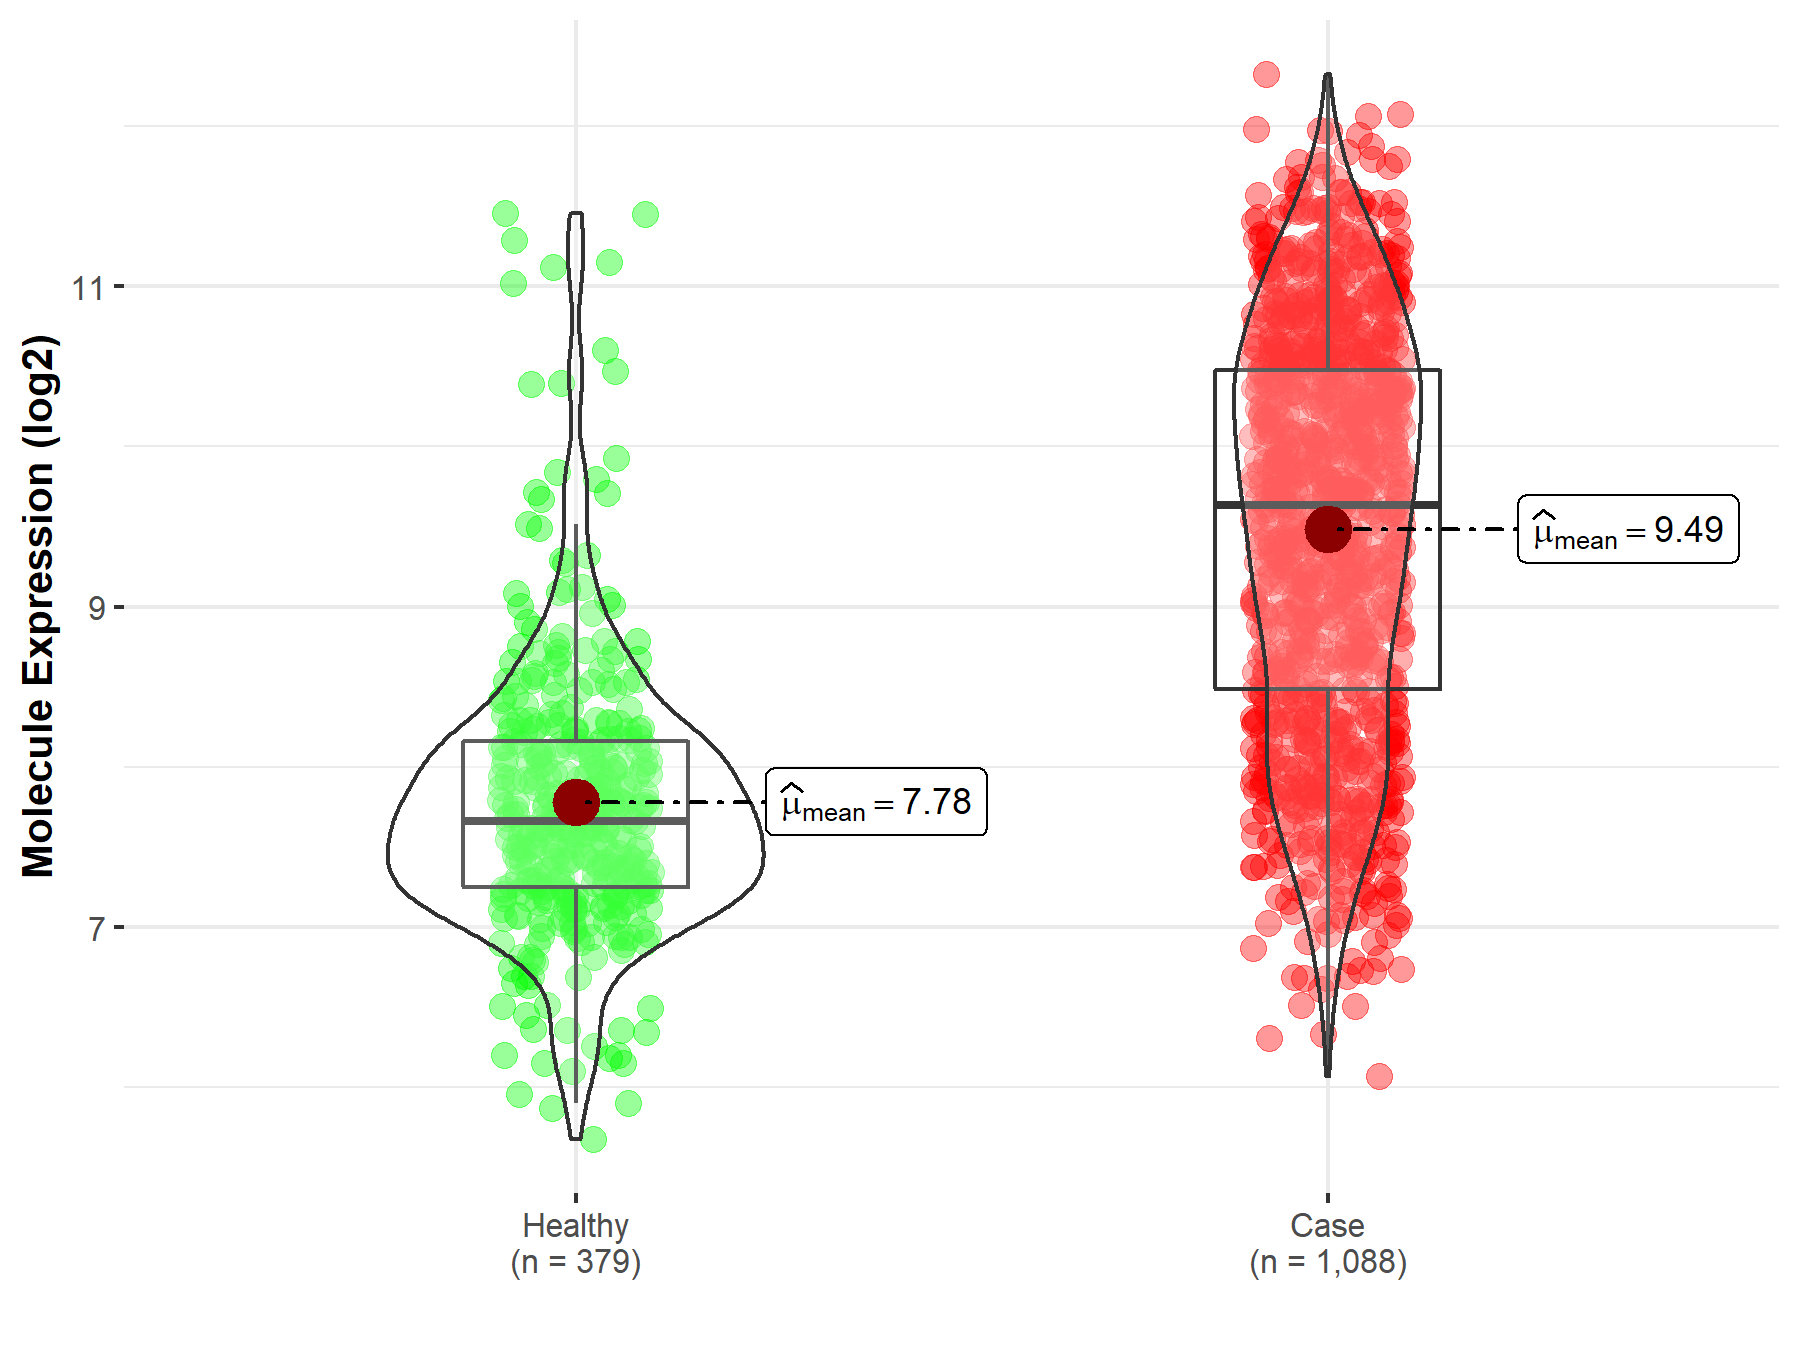
| Differential expression of molecule in resistant diseases | ||
| The Studied Tissue | Nervous tissue | |
| The Specified Disease | Brain cancer | |
| The Expression Level of Disease Section Compare with the Healthy Individual Tissue | p-value: 2.64E-132; Fold-change: 1.98E+00; Z-score: 2.26E+00 | |
|
Molecule expression in the diseased tissue of patients
Molecule expression in the normal tissue of healthy individuals
|
||
| Disease-specific Molecule Abundances |
|
Click to View the Clearer Original Diagram |
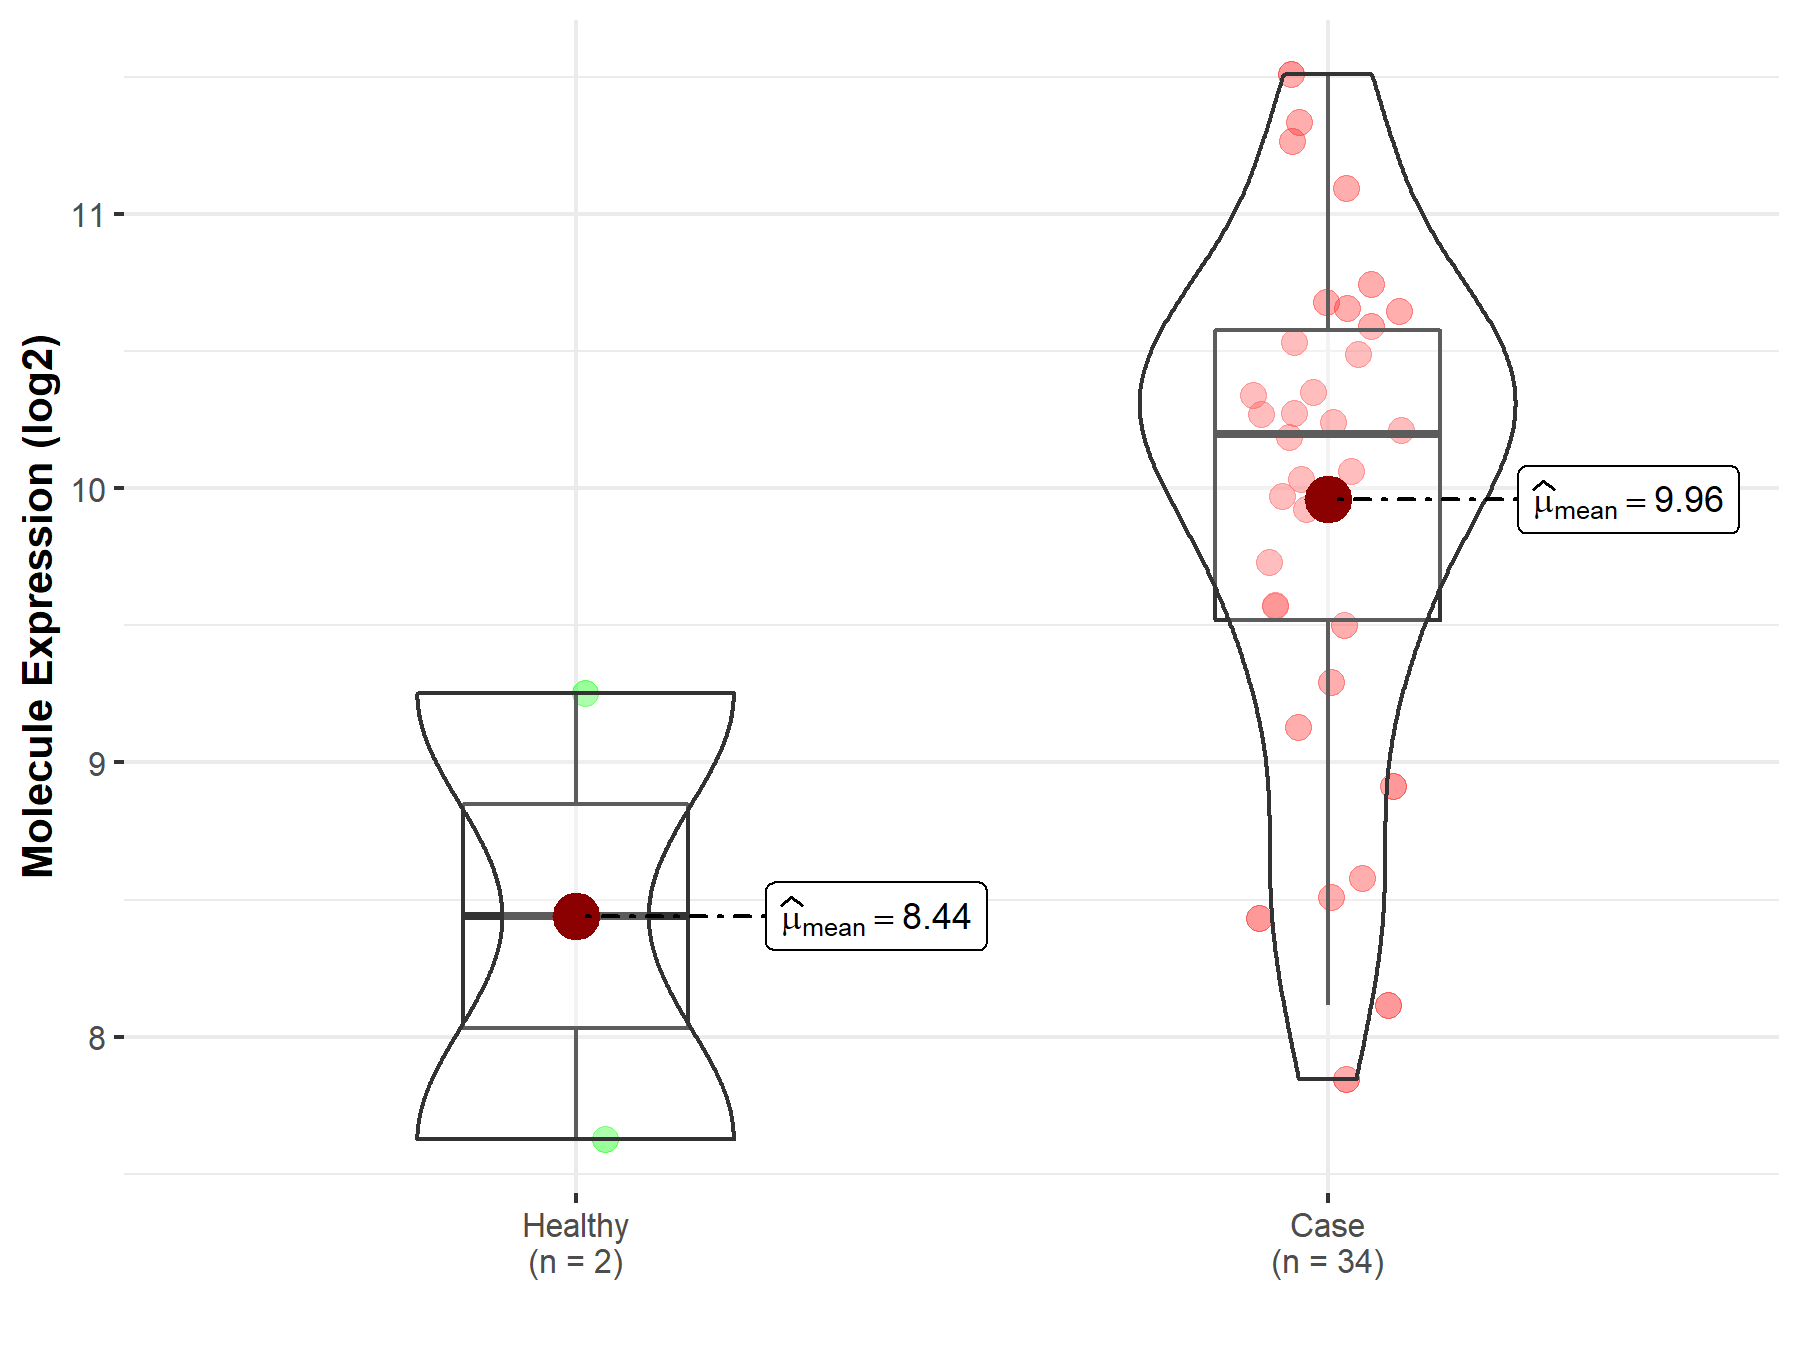
| The Studied Tissue | Brainstem tissue | |
| The Specified Disease | Glioma | |
| The Expression Level of Disease Section Compare with the Healthy Individual Tissue | p-value: 3.04E-01; Fold-change: 1.76E+00; Z-score: 1.53E+00 | |
|
Molecule expression in the diseased tissue of patients
Molecule expression in the normal tissue of healthy individuals
|
||
| Disease-specific Molecule Abundances |
|
Click to View the Clearer Original Diagram |
| The Studied Tissue | White matter | |
| The Specified Disease | Glioma | |
| The Expression Level of Disease Section Compare with the Healthy Individual Tissue | p-value: 9.96E-03; Fold-change: 7.19E-01; Z-score: 8.69E-01 | |
|
Molecule expression in the diseased tissue of patients
Molecule expression in the normal tissue of healthy individuals
|
||
| Disease-specific Molecule Abundances |

|
Click to View the Clearer Original Diagram |
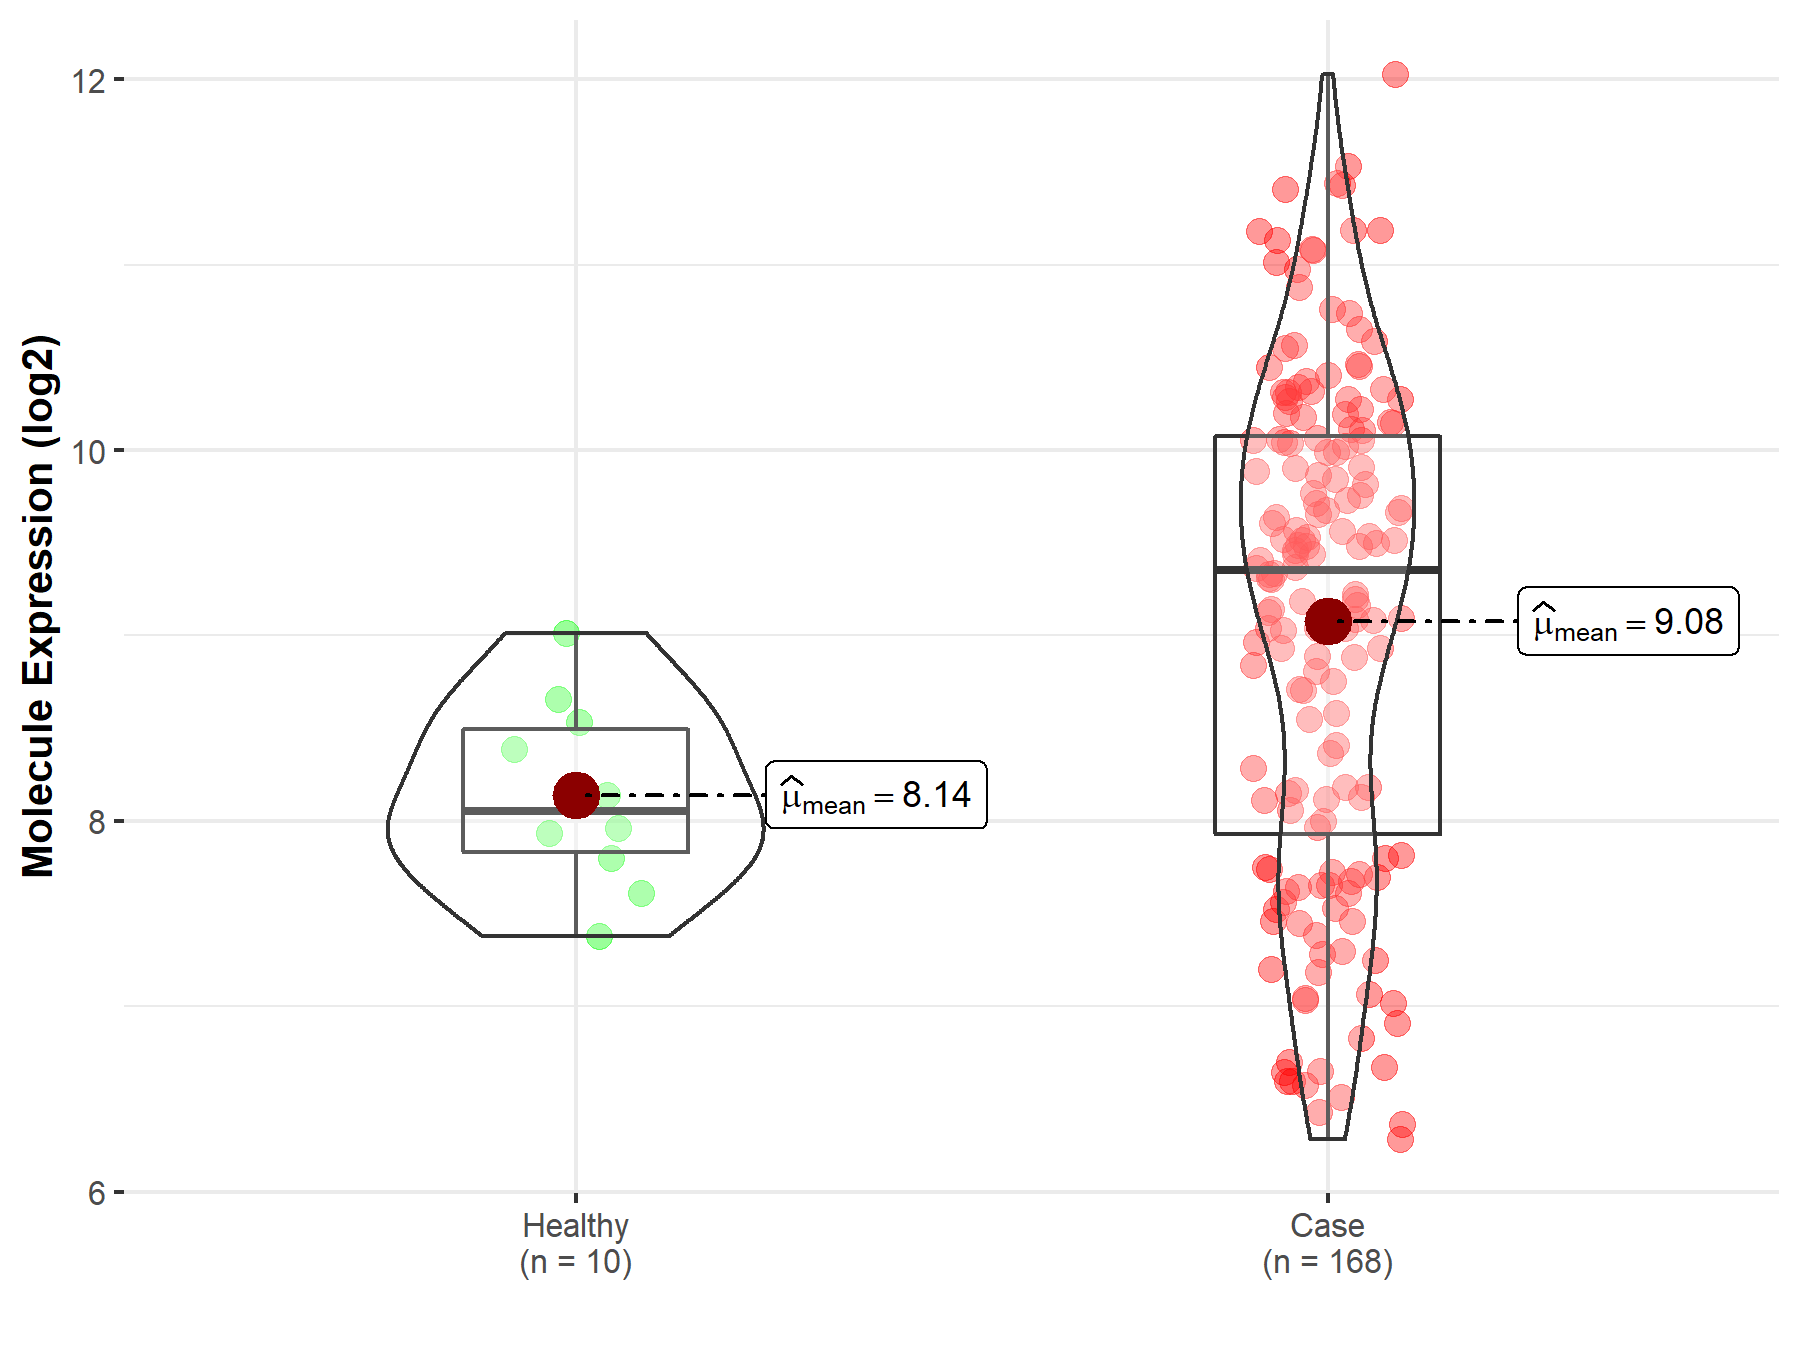
| The Studied Tissue | Brainstem tissue | |
| The Specified Disease | Neuroectodermal tumor | |
| The Expression Level of Disease Section Compare with the Healthy Individual Tissue | p-value: 1.10E-04; Fold-change: 1.30E+00; Z-score: 2.57E+00 | |
|
Molecule expression in the diseased tissue of patients
Molecule expression in the normal tissue of healthy individuals
|
||
| Disease-specific Molecule Abundances |
|
Click to View the Clearer Original Diagram |
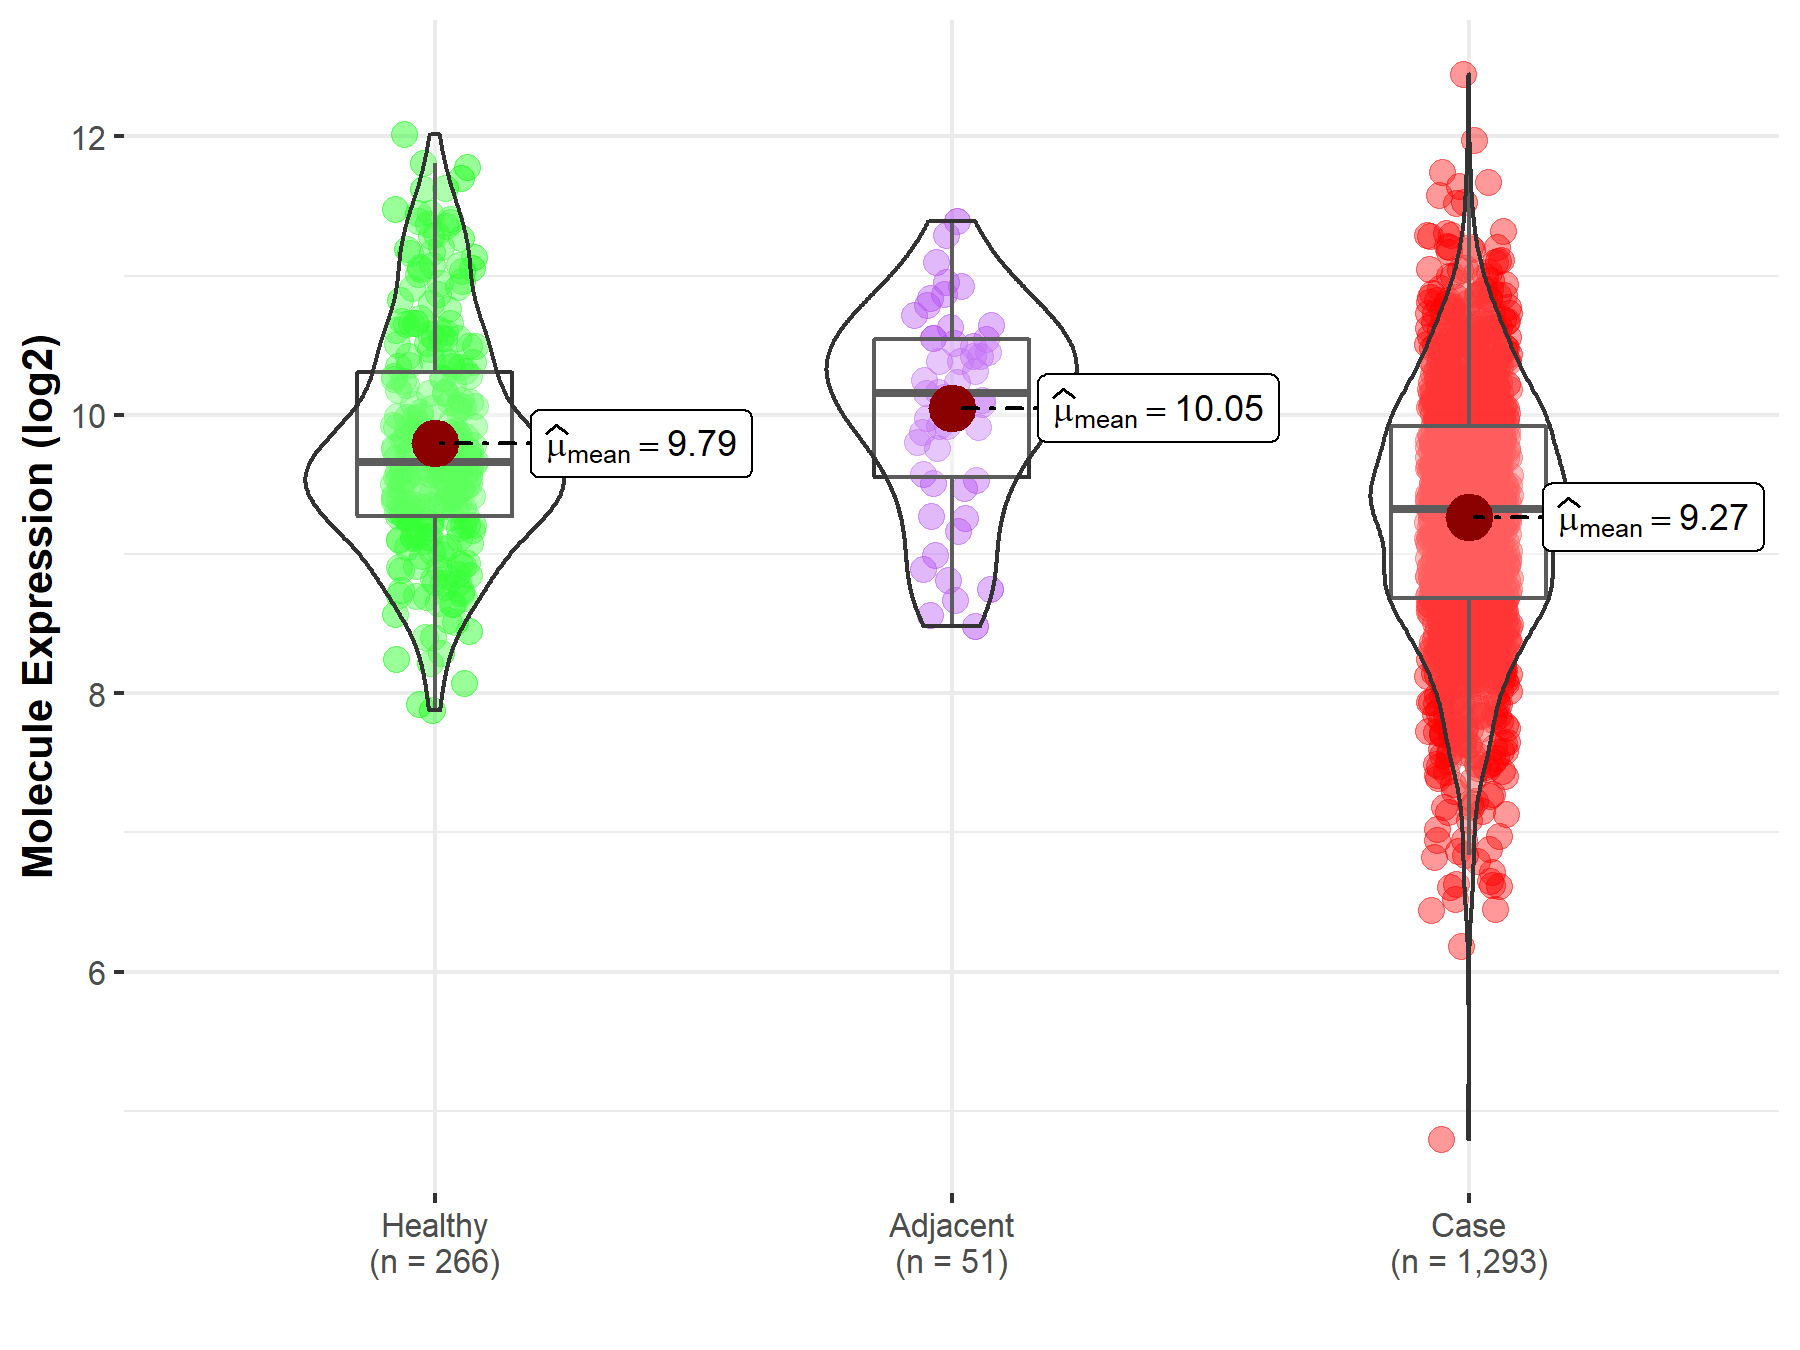
| Differential expression of molecule in resistant diseases | ||
| The Studied Tissue | Breast tissue | |
| The Specified Disease | Breast cancer | |
| The Expression Level of Disease Section Compare with the Healthy Individual Tissue | p-value: 2.24E-19; Fold-change: -3.39E-01; Z-score: -4.19E-01 | |
| The Expression Level of Disease Section Compare with the Adjacent Tissue | p-value: 6.35E-10; Fold-change: -8.32E-01; Z-score: -1.14E+00 | |
|
Molecule expression in the normal tissue adjacent to the diseased tissue of patients
Molecule expression in the diseased tissue of patients
Molecule expression in the normal tissue of healthy individuals
|
||
| Disease-specific Molecule Abundances |
|
Click to View the Clearer Original Diagram |
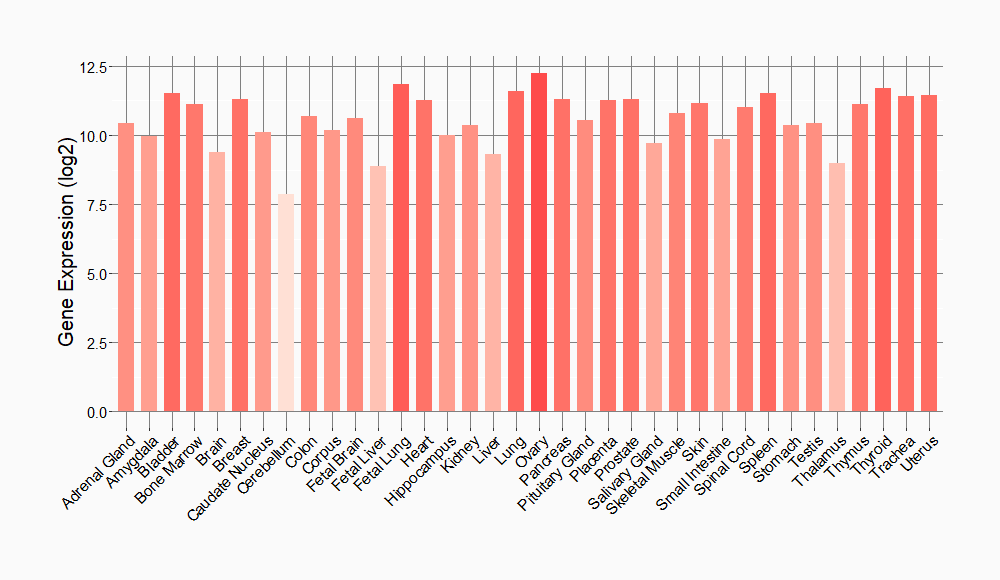
Tissue-specific Molecule Abundances in Healthy Individuals

|
||
References
If you find any error in data or bug in web service, please kindly report it to Dr. Sun and Dr. Yu.
