Molecule Information
General Information of the Molecule (ID: Mol00681)
| Name |
DNA topoisomerase 1 (TOP1)
,Homo sapiens
|
||||
|---|---|---|---|---|---|
| Synonyms |
DNA topoisomerase I
Click to Show/Hide
|
||||
| Molecule Type |
Protein
|
||||
| Gene Name |
TOP1
|
||||
| Gene ID | |||||
| Location |
chr20:41028822-41124487[+]
|
||||
| Sequence |
MSGDHLHNDSQIEADFRLNDSHKHKDKHKDREHRHKEHKKEKDREKSKHSNSEHKDSEKK
HKEKEKTKHKDGSSEKHKDKHKDRDKEKRKEEKVRASGDAKIKKEKENGFSSPPQIKDEP EDDGYFVPPKEDIKPLKRPRDEDDADYKPKKIKTEDTKKEKKRKLEEEEDGKLKKPKNKD KDKKVPEPDNKKKKPKKEEEQKWKWWEEERYPEGIKWKFLEHKGPVFAPPYEPLPENVKF YYDGKVMKLSPKAEEVATFFAKMLDHEYTTKEIFRKNFFKDWRKEMTNEEKNIITNLSKC DFTQMSQYFKAQTEARKQMSKEEKLKIKEENEKLLKEYGFCIMDNHKERIANFKIEPPGL FRGRGNHPKMGMLKRRIMPEDIIINCSKDAKVPSPPPGHKWKEVRHDNKVTWLVSWTENI QGSIKYIMLNPSSRIKGEKDWQKYETARRLKKCVDKIRNQYREDWKSKEMKVRQRAVALY FIDKLALRAGNEKEEGETADTVGCCSLRVEHINLHPELDGQEYVVEFDFLGKDSIRYYNK VPVEKRVFKNLQLFMENKQPEDDLFDRLNTGILNKHLQDLMEGLTAKVFRTYNASITLQQ QLKELTAPDENIPAKILSYNRANRAVAILCNHQRAPPKTFEKSMMNLQTKIDAKKEQLAD ARRDLKSAKADAKVMKDAKTKKVVESKKKAVQRLEEQLMKLEVQATDREENKQIALGTSK LNYLDPRITVAWCKKWGVPIEKIYNKTQREKFAWAIDMADEDYEF Click to Show/Hide
|
||||
| 3D-structure |
|
||||
| Function |
Releases the supercoiling and torsional tension of DNA introduced during the DNA replication and transcription by transiently cleaving and rejoining one strand of the DNA duplex. Introduces a single-strand break via transesterification at a target site in duplex DNA. The scissile phosphodiester is attacked by the catalytic tyrosine of the enzyme, resulting in the formation of a DNA-(3'-phosphotyrosyl)-enzyme intermediate and the expulsion of a 5'-OH DNA strand. The free DNA strand then rotates around the intact phosphodiester bond on the opposing strand, thus removing DNA supercoils. Finally, in the religation step, the DNA 5'-OH attacks the covalent intermediate to expel the active-site tyrosine and restore the DNA phosphodiester backbone (By similarity). Regulates the alternative splicing of tissue factor (F3) pre-mRNA in endothelial cells. Involved in the circadian transcription of the core circadian clock component ARNTL/BMAL1 by altering the chromatin structure around the ROR response elements (ROREs) on the ARNTL/BMAL1 promoter.
Click to Show/Hide
|
||||
| Uniprot ID | |||||
| Ensembl ID | |||||
| HGNC ID | |||||
| Click to Show/Hide the Complete Species Lineage | |||||
Type(s) of Resistant Mechanism of This Molecule
Drug Resistance Data Categorized by Drug
Approved Drug(s)
1 drug(s) in total
| Drug Sensitivity Data Categorized by Their Corresponding Mechanisms | ||||
|
|
||||
| Disease Class: Hepatocellular carcinoma [ICD-11: 2C12.2] | [1] | |||
| Sensitive Disease | Hepatocellular carcinoma [ICD-11: 2C12.2] | |||
| Sensitive Drug | Etoposide | |||
| Molecule Alteration | Expression | Down-regulation |
||
| Experimental Note | Revealed Based on the Cell Line Data | |||
| Cell Pathway Regulation | Cell apoptosis | Activation | hsa04210 | |
| Cell proliferation | Inhibition | hsa05200 | ||
| In Vitro Model | HepG2 cells | Liver | Homo sapiens (Human) | CVCL_0027 |
| MHCC97-L cells | Liver | Homo sapiens (Human) | CVCL_4973 | |
| In Vivo Model | BALB/c nude mouse xenograft model | Mus musculus | ||
| Experiment for Molecule Alteration |
Luciferase assay | |||
| Experiment for Drug Resistance |
MTT assay | |||
| Mechanism Description | Overexpression of miR-23a could significantly potentiate the in vitro and in vivo anti-tumor effect of etoposide; miR-23a could directly bind to 3'untranslated region of TOP1 mRNA, and suppress the corresponding protein expression and inhibition of miR-23a further arguments the expression of TOP1. Suppression of TOP1 expression by miR-23a results in reduction of overall intracellular topoisomerase activity when the cells are exposed to etoposide, which in consequence enhances drug response of HCC cells. | |||
Disease- and Tissue-specific Abundances of This Molecule
ICD Disease Classification 02

| Differential expression of molecule in resistant diseases | ||
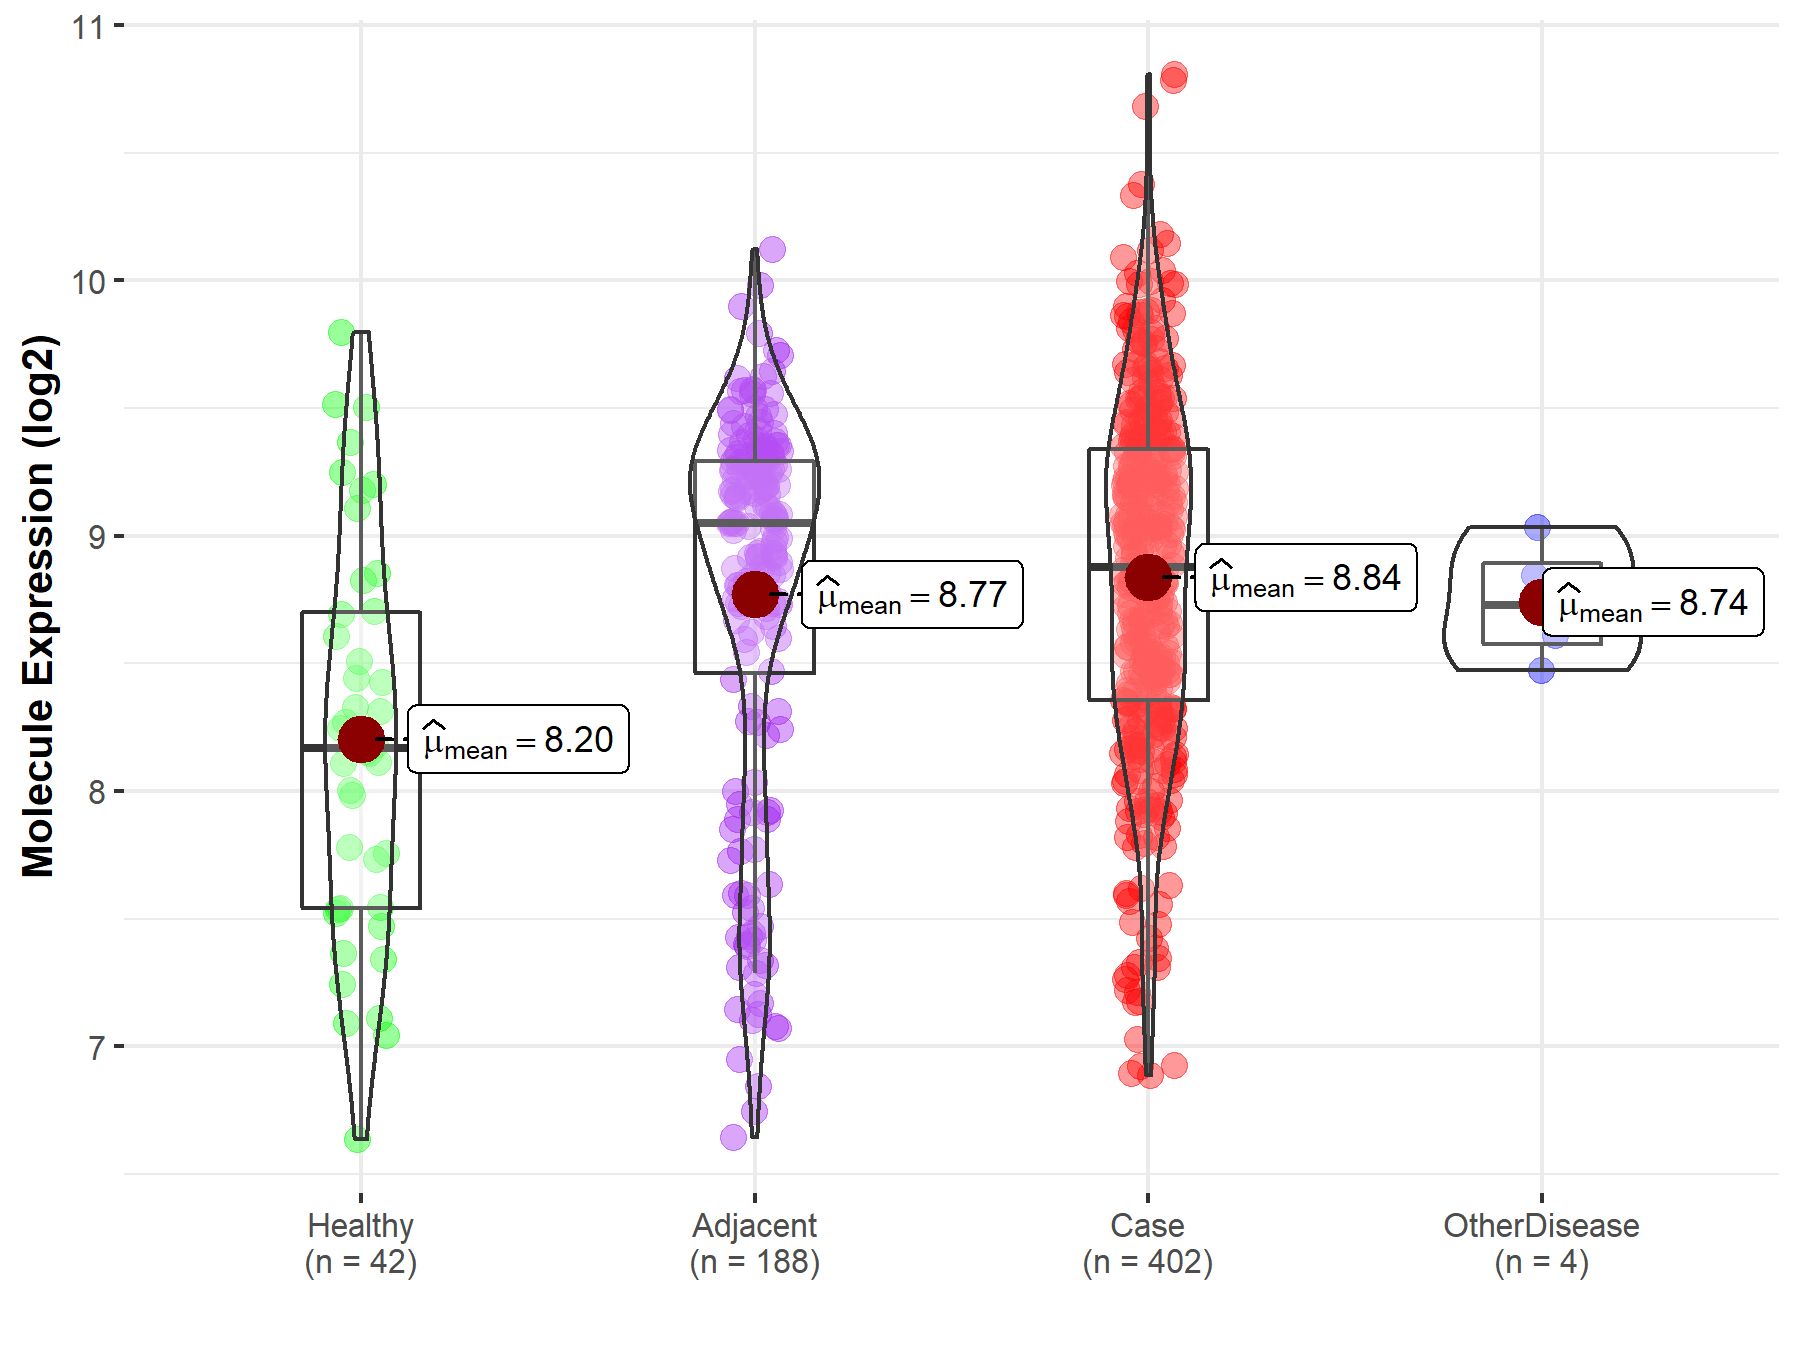
| The Studied Tissue | Liver | |
| The Specified Disease | Liver cancer | |
| The Expression Level of Disease Section Compare with the Healthy Individual Tissue | p-value: 5.84E-06; Fold-change: 7.08E-01; Z-score: 9.16E-01 | |
| The Expression Level of Disease Section Compare with the Adjacent Tissue | p-value: 3.13E-01; Fold-change: -1.74E-01; Z-score: -2.27E-01 | |
| The Expression Level of Disease Section Compare with the Other Disease Section | p-value: 5.03E-01; Fold-change: 1.48E-01; Z-score: 5.94E-01 | |
|
Molecule expression in the normal tissue adjacent to the diseased tissue of patients
Molecule expression in the diseased tissue of patients
Molecule expression in the normal tissue of healthy individuals
Molecule expression in tissue other than the diseased tissue of patients
|
||
| Disease-specific Molecule Abundances |

|
Click to View the Clearer Original Diagram |
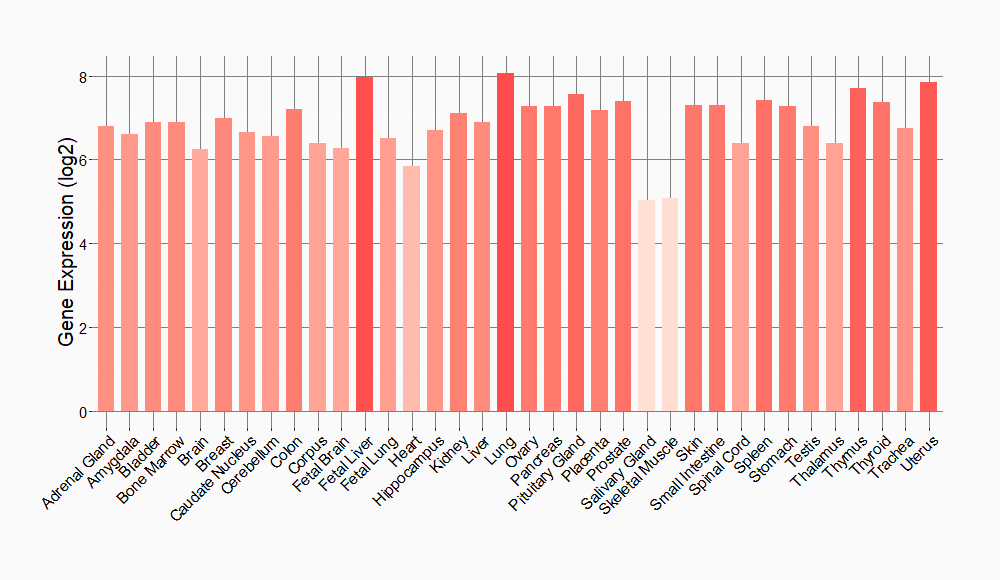
Tissue-specific Molecule Abundances in Healthy Individuals


|
||
References
If you find any error in data or bug in web service, please kindly report it to Dr. Sun and Dr. Yu.
