Molecule Information
General Information of the Molecule (ID: Mol00672)
| Name |
Metalloproteinase inhibitor 1 (TIMP1)
,Homo sapiens
|
||||
|---|---|---|---|---|---|
| Synonyms |
Erythroid-potentiating activity; EPA; Fibroblast collagenase inhibitor; Collagenase inhibitor; Tissue inhibitor of metalloproteinases 1; TIMP-1; CLGI; TIMP
Click to Show/Hide
|
||||
| Molecule Type |
Protein
|
||||
| Gene Name |
TIMP1
|
||||
| Gene ID | |||||
| Location |
chrX:47582408-47586789[+]
|
||||
| Sequence |
MAPFEPLASGILLLLWLIAPSRACTCVPPHPQTAFCNSDLVIRAKFVGTPEVNQTTLYQR
YEIKMTKMYKGFQALGDAADIRFVYTPAMESVCGYFHRSHNRSEEFLIAGKLQDGLLHIT TCSFVAPWNSLSLAQRRGFTKTYTVGCEECTVFPCLSIPCKLQSGTHCLWTDQLLQGSEK GFQSRHLACLPREPGLCTWQSLRSQIA Click to Show/Hide
|
||||
| 3D-structure |
|
||||
| Function |
Metalloproteinase inhibitor that functions by forming one to one complexes with target metalloproteinases, such as collagenases, and irreversibly inactivates them by binding to their catalytic zinc cofactor. Acts on MMP1, MMP2, MMP3, MMP7, MMP8, MMP9, MMP10, MMP11, MMP12, MMP13 and MMP16. Does not act on MMP14. Also functions as a growth factor that regulates cell differentiation, migration and cell death and activates cellular signaling cascades via CD63 and ITGB1. Plays a role in integrin signaling. Mediates erythropoiesis in vitro; but, unlike IL3, it is species-specific, stimulating the growth and differentiation of only human and murine erythroid progenitors.
Click to Show/Hide
|
||||
| Uniprot ID | |||||
| Ensembl ID | |||||
| HGNC ID | |||||
| Click to Show/Hide the Complete Species Lineage | |||||
Type(s) of Resistant Mechanism of This Molecule
Drug Resistance Data Categorized by Drug
Approved Drug(s)
2 drug(s) in total
| Drug Sensitivity Data Categorized by Their Corresponding Mechanisms | ||||
|
|
||||
| Disease Class: Ovarian cancer [ICD-11: 2C73.0] | [1] | |||
| Sensitive Disease | Ovarian cancer [ICD-11: 2C73.0] | |||
| Sensitive Drug | Docetaxel | |||
| Molecule Alteration | Expression | Up-regulation |
||
| Differential expression of the molecule in resistant disease | ||||
| Classification of Disease | Ovarian cancer [ICD-11: 2C73] | |||
| The Specified Disease | Ovarian cancer | |||
| The Studied Tissue | Blood | |||
| The Expression Level of Disease Section Compare with the Healthy Individual Tissue | p-value: 1.62E-21 Fold-change: 5.18E-01 Z-score: 1.09E+01 |
|||
| Experimental Note | Revealed Based on the Cell Line Data | |||
| Cell Pathway Regulation | Cell proliferation | Inhibition | hsa05200 | |
| In Vitro Model | 3AO cells | Ovary | Homo sapiens (Human) | N.A. |
| Experiment for Molecule Alteration |
Western blot analysis | |||
| Experiment for Drug Resistance |
CCK8 assay | |||
| Mechanism Description | LncRNA PVT1 boost the expression of p53 and TIMP 1 to enhance ovarian cancer cells chemosensitivity for carboplatin and docetaxel. | |||
| Drug Sensitivity Data Categorized by Their Corresponding Mechanisms | ||||
|
|
||||
| Disease Class: Ovarian cancer [ICD-11: 2C73.0] | [1] | |||
| Sensitive Disease | Ovarian cancer [ICD-11: 2C73.0] | |||
| Sensitive Drug | Carboplatin | |||
| Molecule Alteration | Expression | Up-regulation |
||
| Differential expression of the molecule in resistant disease | ||||
| Classification of Disease | Ovarian cancer [ICD-11: 2C73] | |||
| The Specified Disease | Ovarian cancer | |||
| The Studied Tissue | Blood | |||
| The Expression Level of Disease Section Compare with the Healthy Individual Tissue | p-value: 1.62E-21 Fold-change: 5.18E-01 Z-score: 1.09E+01 |
|||
| Experimental Note | Revealed Based on the Cell Line Data | |||
| Cell Pathway Regulation | Cell proliferation | Inhibition | hsa05200 | |
| In Vitro Model | 3AO cells | Ovary | Homo sapiens (Human) | N.A. |
| Experiment for Molecule Alteration |
Western blot analysis | |||
| Experiment for Drug Resistance |
CCK8 assay | |||
| Mechanism Description | LncRNA PVT1 boost the expression of p53 and TIMP 1 to enhance ovarian cancer cells chemosensitivity for carboplatin and docetaxel. | |||
Disease- and Tissue-specific Abundances of This Molecule
ICD Disease Classification 02

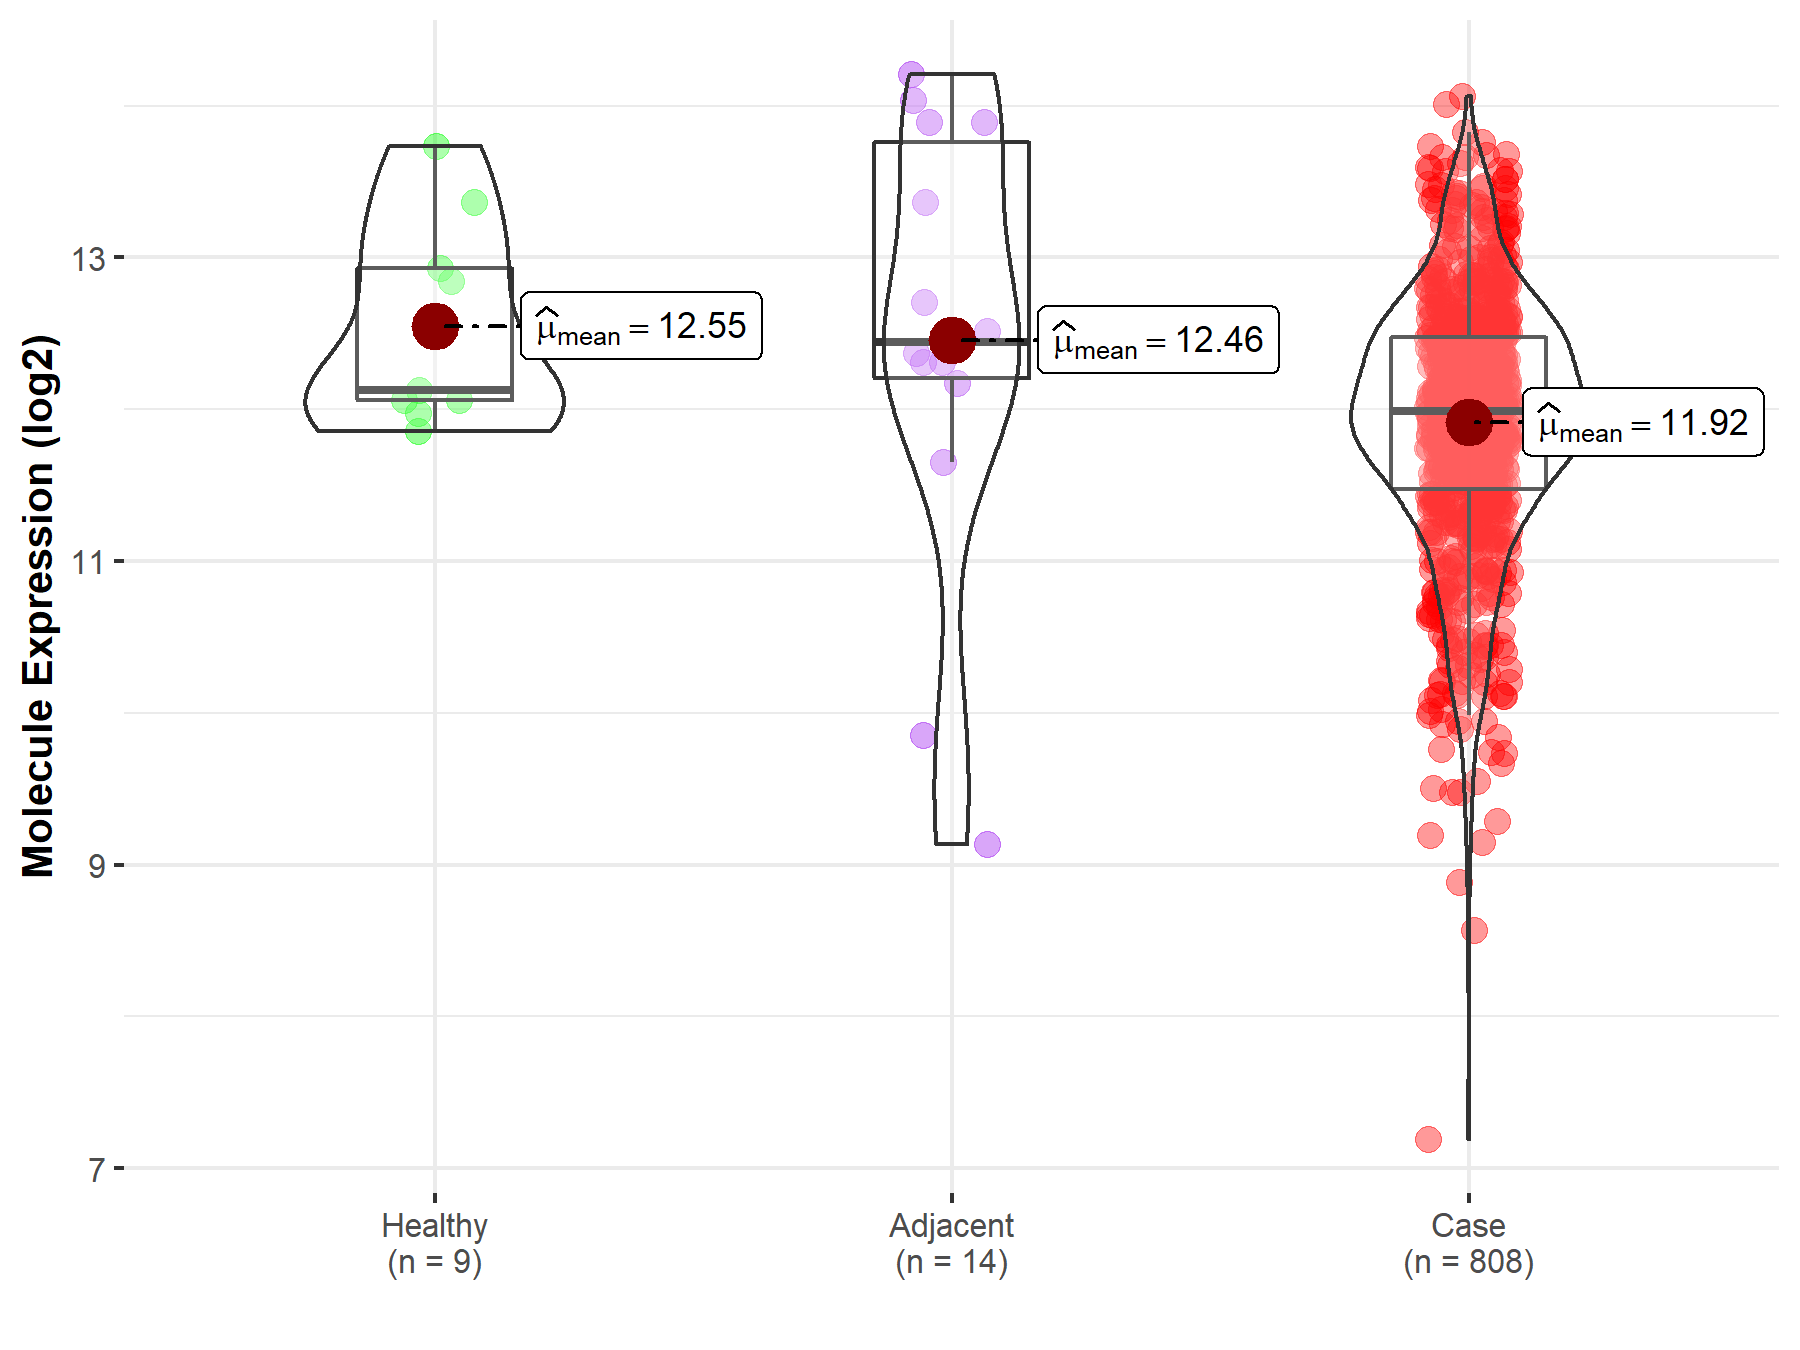
| Differential expression of molecule in resistant diseases | ||
| The Studied Tissue | Ovary | |
| The Specified Disease | Ovarian cancer | |
| The Expression Level of Disease Section Compare with the Healthy Individual Tissue | p-value: 2.43E-02; Fold-change: -1.38E-01; Z-score: -2.02E-01 | |
| The Expression Level of Disease Section Compare with the Adjacent Tissue | p-value: 2.00E-01; Fold-change: -4.51E-01; Z-score: -3.01E-01 | |
|
Molecule expression in the normal tissue adjacent to the diseased tissue of patients
Molecule expression in the diseased tissue of patients
Molecule expression in the normal tissue of healthy individuals
|
||
| Disease-specific Molecule Abundances |

|
Click to View the Clearer Original Diagram |
Tissue-specific Molecule Abundances in Healthy Individuals


|
||
References
If you find any error in data or bug in web service, please kindly report it to Dr. Sun and Dr. Yu.
