Molecule Information
General Information of the Molecule (ID: Mol00642)
| Name |
Superoxide dismutase Mn (SODM)
,Homo sapiens
|
||||
|---|---|---|---|---|---|
| Molecule Type |
Protein
|
||||
| Gene Name |
SOD2
|
||||
| Gene ID | |||||
| Location |
chr6:159669069-159762529[-]
|
||||
| Sequence |
MLSRAVCGTSRQLAPVLGYLGSRQKHSLPDLPYDYGALEPHINAQIMQLHHSKHHAAYVN
NLNVTEEKYQEALAKGDVTAQIALQPALKFNGGGHINHSIFWTNLSPNGGGEPKGELLEA IKRDFGSFDKFKEKLTAASVGVQGSGWGWLGFNKERGHLQIAACPNQDPLQGTTGLIPLL GIDVWEHAYYLQYKNVRPDYLKAIWNVINWENVTERYMACKK Click to Show/Hide
|
||||
| 3D-structure |
|
||||
| Function |
Destroys superoxide anion radicals which are normally produced within the cells and which are toxic to biological systems.
Click to Show/Hide
|
||||
| Uniprot ID | |||||
| Ensembl ID | |||||
| HGNC ID | |||||
| Click to Show/Hide the Complete Species Lineage | |||||
Type(s) of Resistant Mechanism of This Molecule
Drug Resistance Data Categorized by Drug
Approved Drug(s)
1 drug(s) in total
| Drug Sensitivity Data Categorized by Their Corresponding Mechanisms | ||||
|
|
||||
| Disease Class: Ovarian cancer [ICD-11: 2C73.0] | [1] | |||
| Sensitive Disease | Ovarian cancer [ICD-11: 2C73.0] | |||
| Sensitive Drug | Paclitaxel | |||
| Molecule Alteration | Expression | Down-regulation |
||
| Differential expression of the molecule in resistant disease | ||||
| Classification of Disease | Ovarian cancer [ICD-11: 2C73] | |||
| The Specified Disease | Ovarian cancer | |||
| The Studied Tissue | Ovarian tissue | |||
| The Expression Level of Disease Section Compare with the Healthy Individual Tissue | p-value: 1.62E-01 Fold-change: -1.14E-01 Z-score: -1.54E+00 |
|||
| Experimental Note | Revealed Based on the Cell Line Data | |||
| Cell Pathway Regulation | miR146a/SOD2/ROS signaling pathway | Regulation | N.A. | |
| In Vitro Model | HEY cells | Ovary | Homo sapiens (Human) | CVCL_0297 |
| OVCAR3 cells | Ovary | Homo sapiens (Human) | CVCL_0465 | |
| CAOV3 cells | Ovary | Homo sapiens (Human) | CVCL_0201 | |
| Experiment for Molecule Alteration |
Western blot analysis | |||
| Experiment for Drug Resistance |
CCK8 assay; TUNEL Assay | |||
| Mechanism Description | miR146a downregulates the expression of SOD2 and enhances ROS generation, leading to increased apoptosis, inhibition of proliferation, and enhanced sensitivity to chemotherapy. | |||
| Disease Class: Epithelial ovarian cancer [ICD-11: 2B5D.0] | [1] | |||
| Sensitive Disease | Epithelial ovarian cancer [ICD-11: 2B5D.0] | |||
| Sensitive Drug | Paclitaxel | |||
| Molecule Alteration | Expression | Down-regulation |
||
| Experimental Note | Revealed Based on the Cell Line Data | |||
| Cell Pathway Regulation | Cell apoptosis | Activation | hsa04210 | |
| Cell proliferation | Inhibition | hsa05200 | ||
| miR146a/SOD2/ROS signaling pathway | Regulation | N.A. | ||
| In Vitro Model | Huh-7 cells | Liver | Homo sapiens (Human) | CVCL_0336 |
| HepG2 cells | Liver | Homo sapiens (Human) | CVCL_0027 | |
| Hep3B cells | Liver | Homo sapiens (Human) | CVCL_0326 | |
| PLC cells | Liver | Homo sapiens (Human) | CVCL_0485 | |
| Experiment for Molecule Alteration |
Western blot analysis | |||
| Experiment for Drug Resistance |
MTT assay; CCK8 assay | |||
| Mechanism Description | miR-146a as a potential tumor suppressor in patients with EOC. miR-146a downregulates expression of SOD2 and enhances ROS generation, leading to increased apoptosis, inhibition of proliferation, and (+) sensitivity to chemotherapy. | |||
Clinical Trial Drug(s)
1 drug(s) in total
| Drug Resistance Data Categorized by Their Corresponding Mechanisms | ||||
|
|
||||
| Disease Class: Hepatocellular carcinoma [ICD-11: 2C12.2] | [2] | |||
| Resistant Disease | Hepatocellular carcinoma [ICD-11: 2C12.2] | |||
| Resistant Drug | Betulinic acid | |||
| Molecule Alteration | Expression | Down-regulation |
||
| Differential expression of the molecule in resistant disease | ||||
| Classification of Disease | Liver cancer [ICD-11: 2C12] | |||
| The Specified Disease | Liver cancer | |||
| The Studied Tissue | Liver tissue | |||
| The Expression Level of Disease Section Compare with the Healthy Individual Tissue | p-value: 7.96E-07 Fold-change: -1.28E-01 Z-score: -5.52E+00 |
|||
| Experimental Note | Revealed Based on the Cell Line Data | |||
| Cell Pathway Regulation | Cell apoptosis | Activation | hsa04210 | |
| Cell proliferation | Inhibition | hsa05200 | ||
| p53/p66shc/miR21-Sod2 signaling pathway | Regulation | N.A. | ||
| In Vitro Model | Huh-7 cells | Liver | Homo sapiens (Human) | CVCL_0336 |
| HepG2 cells | Liver | Homo sapiens (Human) | CVCL_0027 | |
| SMMC7721 cells | Uterus | Homo sapiens (Human) | CVCL_0534 | |
| Experiment for Molecule Alteration |
Western blot analysis | |||
| Experiment for Drug Resistance |
MTT assay; TUNEL assay; Promega | |||
| Mechanism Description | p53 is responsible for the anti-tumor effect of betulinic acid through up-regulation of p66(shc) and miR-21 and down-regulation of Sod2 expression, leading to mitochondrial ROS accumulation and apoptosis. | |||
Investigative Drug(s)
1 drug(s) in total
| Drug Sensitivity Data Categorized by Their Corresponding Mechanisms | ||||
|
|
||||
| Disease Class: Uveal melanoma [ICD-11: 2D0Y.0] | [3] | |||
| Sensitive Disease | Uveal melanoma [ICD-11: 2D0Y.0] | |||
| Sensitive Drug | PLX51107 | |||
| Molecule Alteration | Expression | Up-regulation |
||
| Experimental Note | Revealed Based on the Cell Line Data | |||
| Cell Pathway Regulation | NF-kappaB signaling pathway | Inhibition | hsa04064 | |
| In Vitro Model | Omm1.3 cells | Skin | Homo sapiens (Human) | N.A. |
| 92.1 cells | Peripheral blood | Homo sapiens (Human) | N.A. | |
| UM004 cells | Skin | Homo sapiens (Human) | N.A. | |
| Omm1 cells | Kidney | Homo sapiens (Human) | CVCL_6939 | |
| In Vivo Model | Athymic nu/nu mouse xenograft model | Mus musculus | ||
| Experiment for Molecule Alteration |
qRT-PCR; Western blotting assay | |||
| Experiment for Drug Resistance |
CCK8 assay | |||
| Mechanism Description | Both assays showed higher expression of these genes(REL, RELB, CEBPD, SOD2) at the mRNA and protein level in the resistant cells compared with their parental counterpart. Furthermore, NF-kappa-B activity was increased in the resistant cells compared with parental, and it could be inhibited by PTL.Inhibition of NF-kappa-B-dependent signaling enhances sensitivity and overcomes resistance to BET inhibition in uveal melanoma. | |||
Disease- and Tissue-specific Abundances of This Molecule
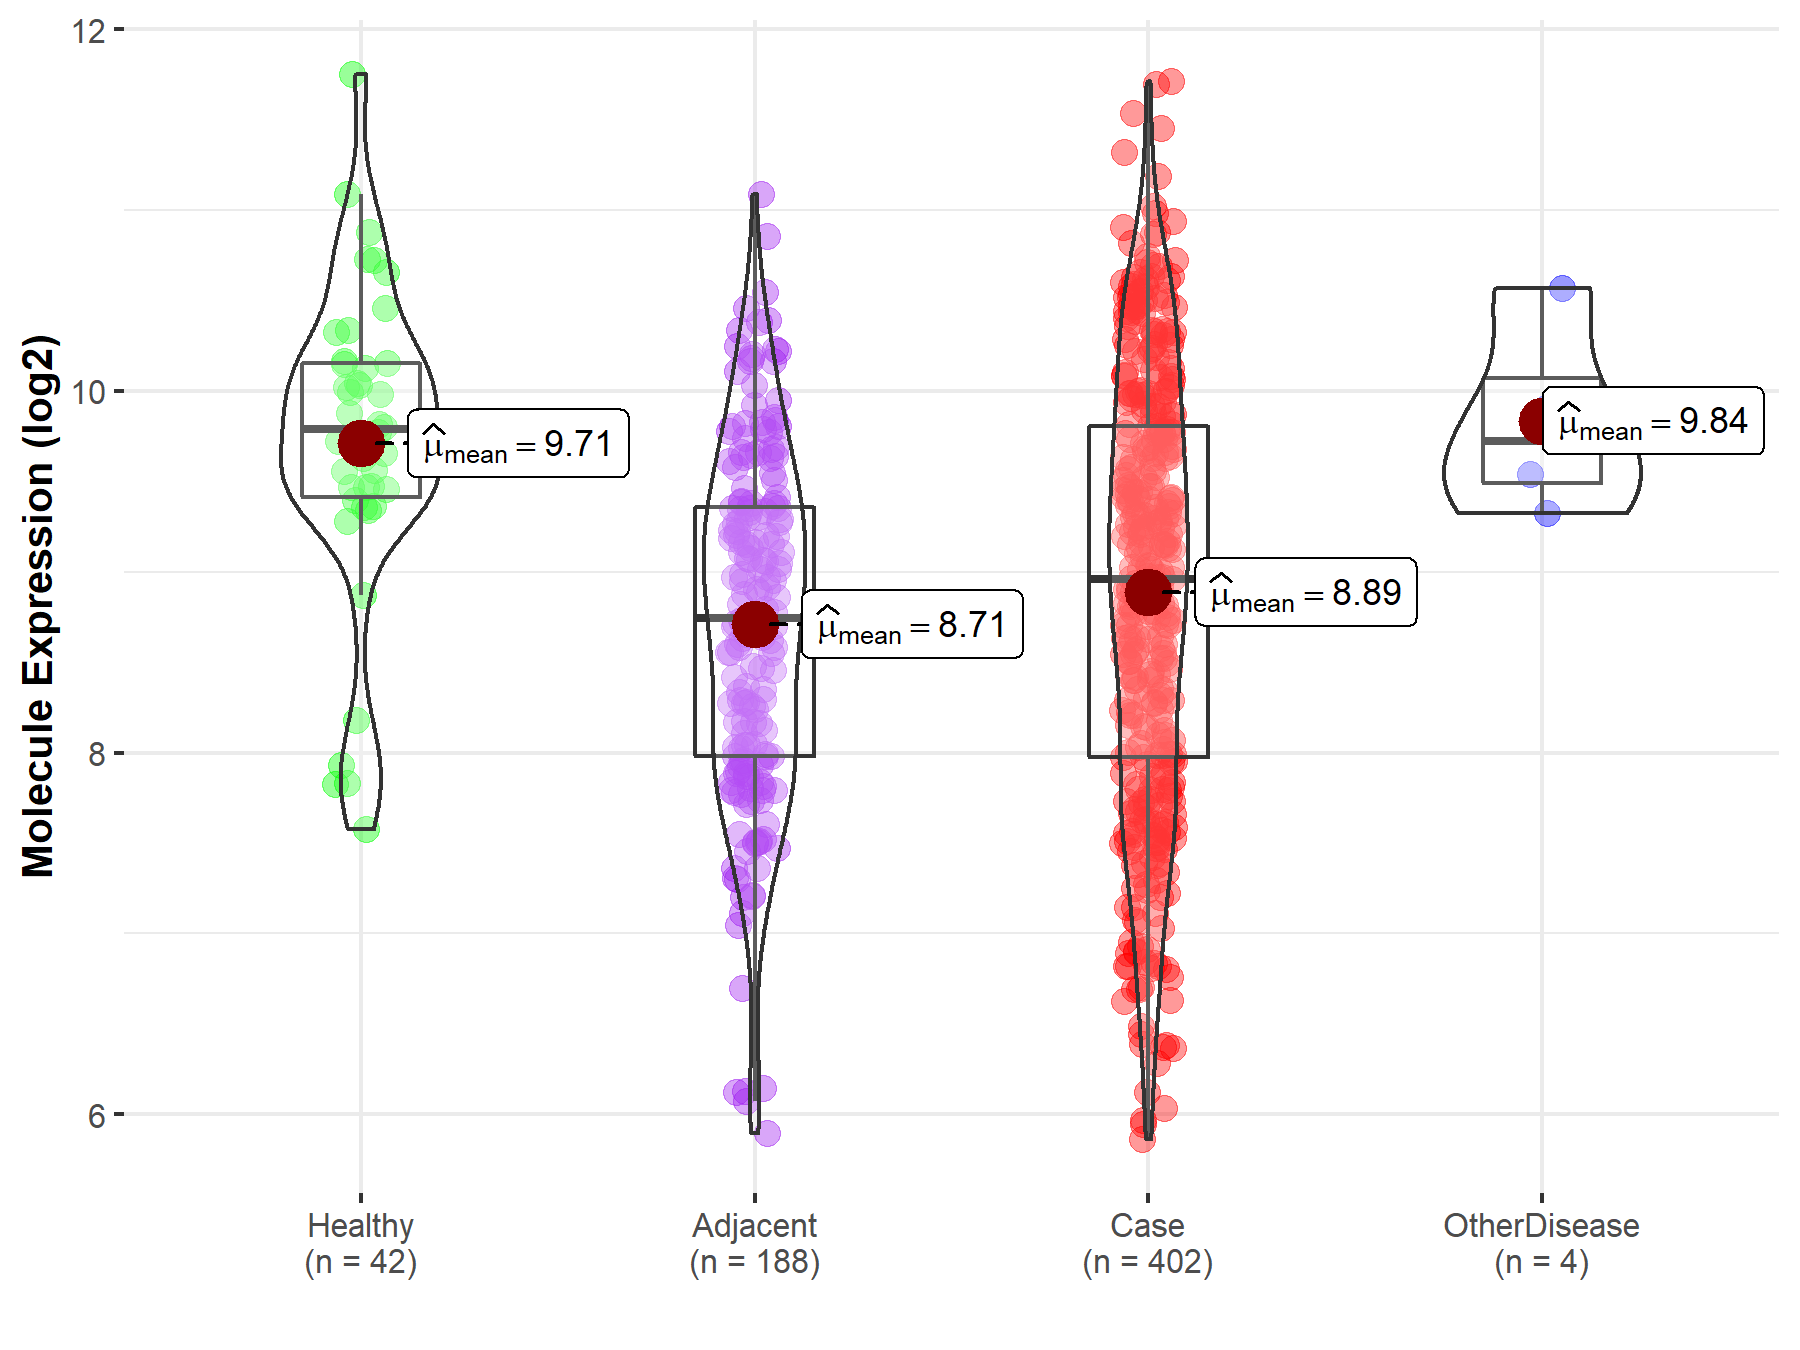
ICD Disease Classification 02

| Differential expression of molecule in resistant diseases | ||
| The Studied Tissue | Liver | |
| The Specified Disease | Liver cancer | |
| The Expression Level of Disease Section Compare with the Healthy Individual Tissue | p-value: 7.96E-07; Fold-change: -8.27E-01; Z-score: -9.39E-01 | |
| The Expression Level of Disease Section Compare with the Adjacent Tissue | p-value: 5.74E-02; Fold-change: 2.15E-01; Z-score: 2.21E-01 | |
| The Expression Level of Disease Section Compare with the Other Disease Section | p-value: 3.71E-02; Fold-change: -7.64E-01; Z-score: -1.40E+00 | |
|
Molecule expression in the normal tissue adjacent to the diseased tissue of patients
Molecule expression in the diseased tissue of patients
Molecule expression in the normal tissue of healthy individuals
Molecule expression in tissue other than the diseased tissue of patients
|
||
| Disease-specific Molecule Abundances |

|
Click to View the Clearer Original Diagram |
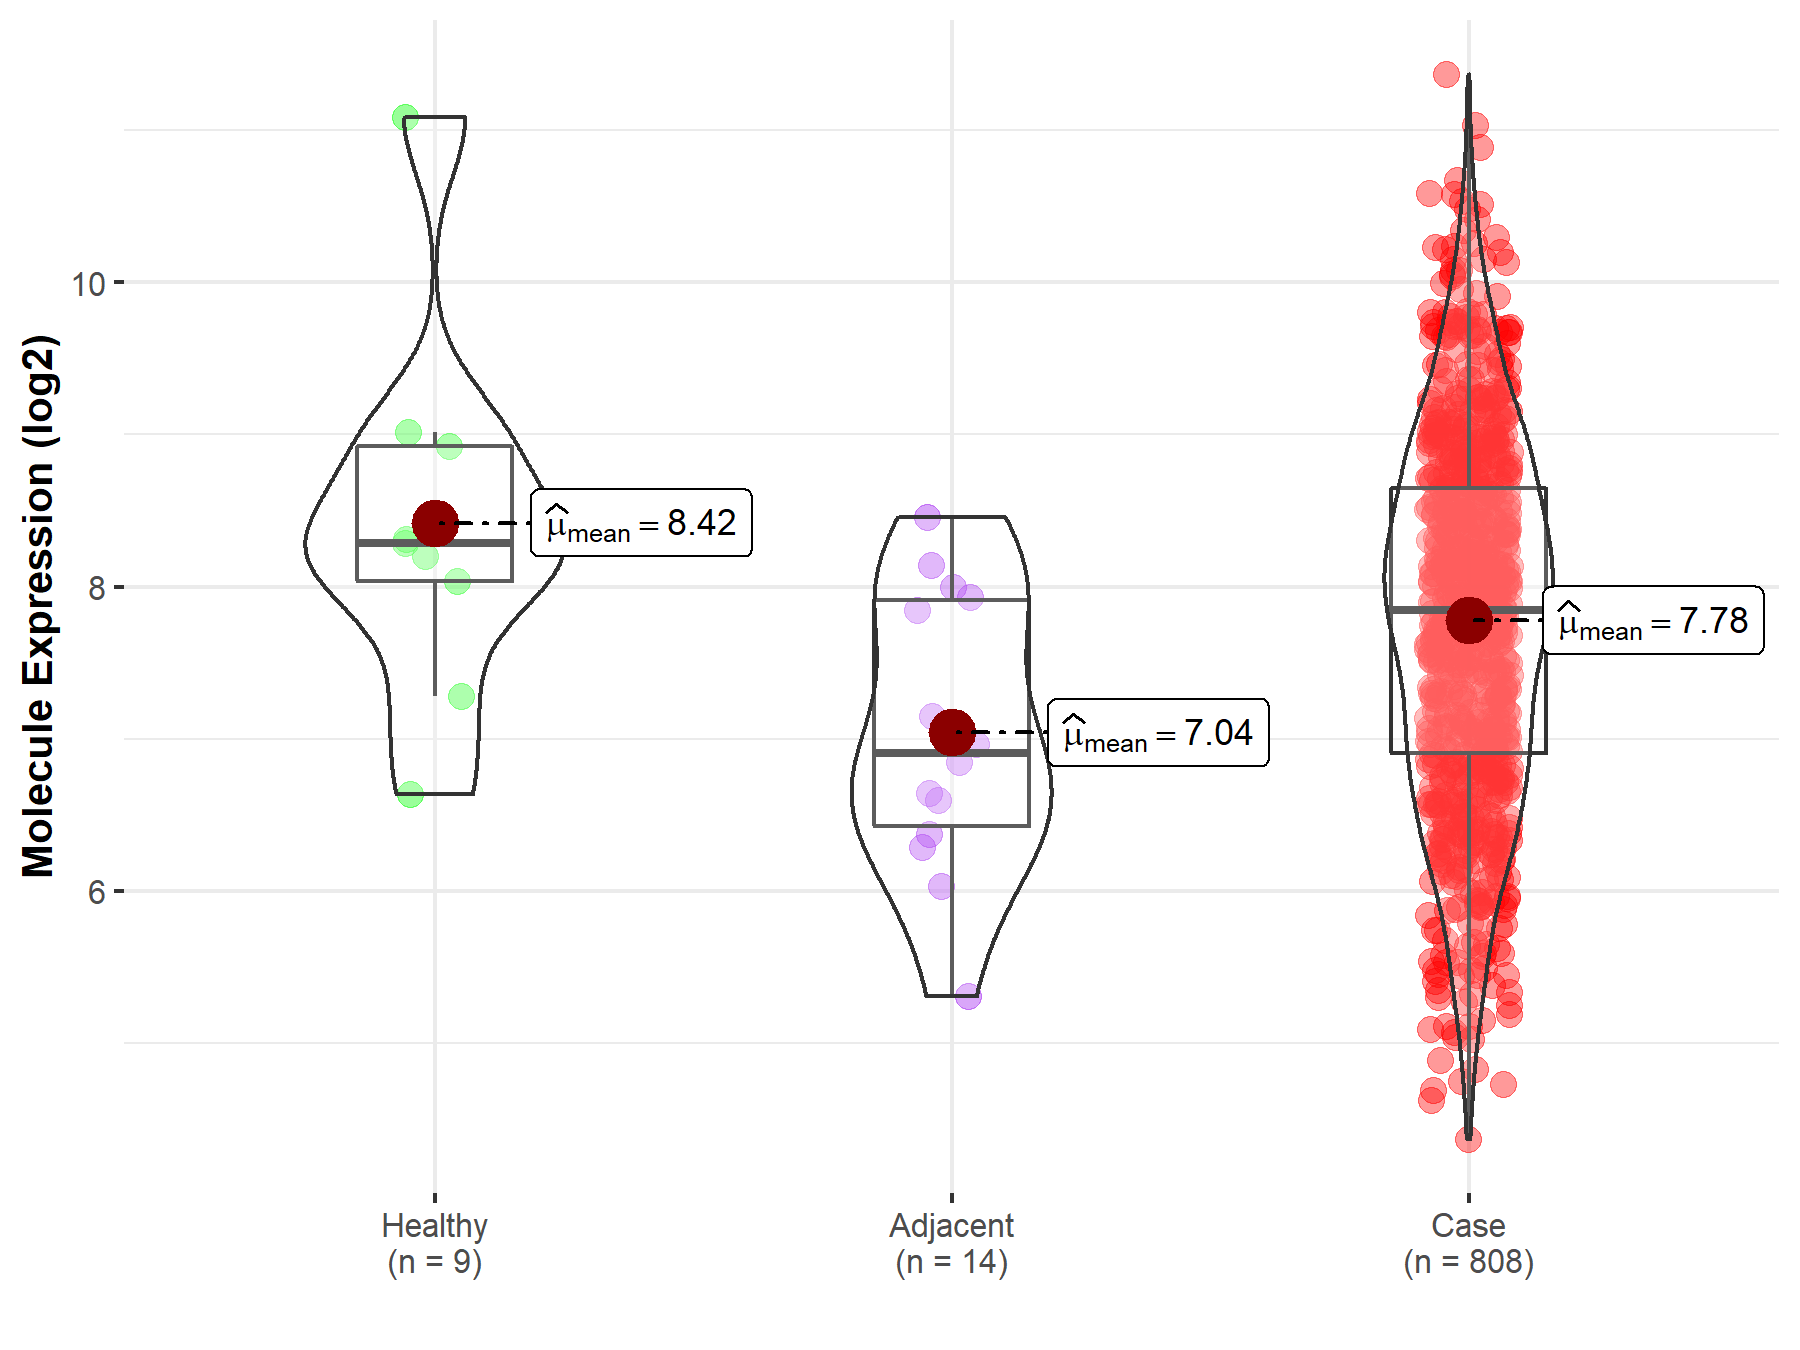
| Differential expression of molecule in resistant diseases | ||
| The Studied Tissue | Ovary | |
| The Specified Disease | Ovarian cancer | |
| The Expression Level of Disease Section Compare with the Healthy Individual Tissue | p-value: 1.62E-01; Fold-change: -4.39E-01; Z-score: -3.52E-01 | |
| The Expression Level of Disease Section Compare with the Adjacent Tissue | p-value: 1.07E-02; Fold-change: 9.42E-01; Z-score: 1.02E+00 | |
|
Molecule expression in the normal tissue adjacent to the diseased tissue of patients
Molecule expression in the diseased tissue of patients
Molecule expression in the normal tissue of healthy individuals
|
||
| Disease-specific Molecule Abundances |

|
Click to View the Clearer Original Diagram |
References
If you find any error in data or bug in web service, please kindly report it to Dr. Sun and Dr. Yu.
