Molecule Information
General Information of the Molecule (ID: Mol00628)
| Name |
E3 ubiquitin-protein ligase SIAH2 (SIAH2)
,Homo sapiens
|
||||
|---|---|---|---|---|---|
| Synonyms |
RING-type E3 ubiquitin transferase SIAH2; Seven in absentia homolog 2; Siah-2; hSiah2
Click to Show/Hide
|
||||
| Molecule Type |
Protein
|
||||
| Gene Name |
SIAH2
|
||||
| Gene ID | |||||
| Location |
chr3:150741125-150763477[-]
|
||||
| Sequence |
MSRPSSTGPSANKPCSKQPPPQPQHTPSPAAPPAAATISAAGPGSSAVPAAAAVISGPGG
GGGAGPVSPQHHELTSLFECPVCFDYVLPPILQCQAGHLVCNQCRQKLSCCPTCRGALTP SIRNLAMEKVASAVLFPCKYATTGCSLTLHHTEKPEHEDICEYRPYSCPCPGASCKWQGS LEAVMSHLMHAHKSITTLQGEDIVFLATDINLPGAVDWVMMQSCFGHHFMLVLEKQEKYE GHQQFFAIVLLIGTRKQAENFAYRLELNGNRRRLTWEATPRSIHDGVAAAIMNSDCLVFD TAIAHLFADNGNLGINVTISTCCP Click to Show/Hide
|
||||
| 3D-structure |
|
||||
| Function |
E3 ubiquitin-protein ligase that mediates ubiquitination and subsequent proteasomal degradation of target proteins. E3 ubiquitin ligases accept ubiquitin from an E2 ubiquitin-conjugating enzyme in the form of a thioester and then directly transfers the ubiquitin to targeted substrates. Mediates E3 ubiquitin ligase activity either through direct binding to substrates or by functioning as the essential RING domain subunit of larger E3 complexes. Triggers the ubiquitin-mediated degradation of many substrates, including proteins involved in transcription regulation (GPS2, POU2AF1, PML, NCOR1), a cell surface receptor (DCC), an antiapoptotic protein (BAG1), and a protein involved in synaptic vesicle function in neurons (SYP). Mediates ubiquitination and proteasomal degradation of DYRK2 in response to hypoxia. It is thereby involved in apoptosis, tumor suppression, cell cycle, transcription and signaling processes. Has some overlapping function with SIAH1. Triggers the ubiquitin-mediated degradation of TRAF2, whereas SIAH1 does not. Promotes monoubiquitination of SNCA. Regulates cellular clock function via ubiquitination of the circadian transcriptional repressors NR1D1 and NR1D2 leading to their proteasomal degradation. Plays an important role in mediating the rhythmic degradation/clearance of NR1D1 and NR1D2 contributing to their circadian profile of protein abundance. Mediates ubiquitination and degradation of EGLN2 and EGLN3 in response to the unfolded protein response (UPR), leading to their degradation and subsequent stabilization of ATF4.
Click to Show/Hide
|
||||
| Uniprot ID | |||||
| Ensembl ID | |||||
| HGNC ID | |||||
| Click to Show/Hide the Complete Species Lineage | |||||
Type(s) of Resistant Mechanism of This Molecule
Drug Resistance Data Categorized by Drug
Approved Drug(s)
2 drug(s) in total
| Drug Sensitivity Data Categorized by Their Corresponding Mechanisms | ||||
|
|
||||
| Disease Class: Melanoma [ICD-11: 2C30.0] | [1] | |||
| Sensitive Disease | Melanoma [ICD-11: 2C30.0] | |||
| Sensitive Drug | Paclitaxel | |||
| Molecule Alteration | Expression | Down-regulation |
||
| Experimental Note | Revealed Based on the Cell Line Data | |||
| Cell Pathway Regulation | Cell invasion | Inhibition | hsa05200 | |
| Cell migration | Inhibition | hsa04670 | ||
| Cell proliferation | Inhibition | hsa05200 | ||
| miR335/SIAH2/HDAC3 signaling pathway | Regulation | N.A. | ||
| In Vitro Model | Malme3M cells | Skin | Homo sapiens (Human) | CVCL_1438 |
| Experiment for Molecule Alteration |
Western blot analysis | |||
| Experiment for Drug Resistance |
Trypan blue exclusion assay; Transwell assay | |||
| Mechanism Description | miR-335-mediated increased sensitivity to anti-cancer drugs was associated with its effect on HDAC3 and SIAH2 expression. miR-335 exerted apoptotic effects and inhibited ubiquitination of HDAC3 in anti-cancer drug-resistant cancer cell lines. miR-335 negatively regulated the invasion, migration, and growth rate of cancer cells. The mouse xenograft model showed that miR-335 negatively regulated the tumorigenic potential of cancer cells. The down-regulation of SIAH2 conferred sensitivity to anti-cancer drugs. The results of the study indicated that the miR-335/SIAH2/HDAC3 axis regulates the response to anti-cancer drugs. | |||
| Disease Class: Hepatocellular carcinoma [ICD-11: 2C12.2] | [1] | |||
| Sensitive Disease | Hepatocellular carcinoma [ICD-11: 2C12.2] | |||
| Sensitive Drug | Paclitaxel | |||
| Molecule Alteration | Expression | Down-regulation |
||
| Experimental Note | Revealed Based on the Cell Line Data | |||
| Cell Pathway Regulation | Cell invasion | Inhibition | hsa05200 | |
| Cell migration | Inhibition | hsa04670 | ||
| Cell proliferation | Inhibition | hsa05200 | ||
| miR335/SIAH2/HDAC3 signaling pathway | Regulation | N.A. | ||
| In Vitro Model | SNU387 cells | Liver | Homo sapiens (Human) | CVCL_0250 |
| Experiment for Molecule Alteration |
Western blot analysis | |||
| Experiment for Drug Resistance |
Trypan blue exclusion assay; Transwell assay | |||
| Mechanism Description | miR-335-mediated increased sensitivity to anti-cancer drugs was associated with its effect on HDAC3 and SIAH2 expression. miR-335 exerted apoptotic effects and inhibited ubiquitination of HDAC3 in anti-cancer drug-resistant cancer cell lines. miR-335 negatively regulated the invasion, migration, and growth rate of cancer cells. The mouse xenograft model showed that miR-335 negatively regulated the tumorigenic potential of cancer cells. The down-regulation of SIAH2 conferred sensitivity to anti-cancer drugs. The results of the study indicated that the miR-335/SIAH2/HDAC3 axis regulates the response to anti-cancer drugs. | |||
| Drug Sensitivity Data Categorized by Their Corresponding Mechanisms | ||||
|
|
||||
| Disease Class: Hepatocellular carcinoma [ICD-11: 2C12.2] | [1] | |||
| Sensitive Disease | Hepatocellular carcinoma [ICD-11: 2C12.2] | |||
| Sensitive Drug | Vinblastine | |||
| Molecule Alteration | Expression | Down-regulation |
||
| Experimental Note | Revealed Based on the Cell Line Data | |||
| Cell Pathway Regulation | Cell invasion | Inhibition | hsa05200 | |
| Cell migration | Inhibition | hsa04670 | ||
| Cell proliferation | Inhibition | hsa05200 | ||
| miR335/SIAH2/HDAC3 signaling pathway | Regulation | N.A. | ||
| In Vitro Model | SNU387 cells | Liver | Homo sapiens (Human) | CVCL_0250 |
| Experiment for Molecule Alteration |
Western blot analysis | |||
| Experiment for Drug Resistance |
Trypan blue exclusion assay; Transwell assay | |||
| Mechanism Description | miR-335-mediated increased sensitivity to anti-cancer drugs was associated with its effect on HDAC3 and SIAH2 expression. miR-335 exerted apoptotic effects and inhibited ubiquitination of HDAC3 in anti-cancer drug-resistant cancer cell lines. miR-335 negatively regulated the invasion, migration, and growth rate of cancer cells. The mouse xenograft model showed that miR-335 negatively regulated the tumorigenic potential of cancer cells. The down-regulation of SIAH2 conferred sensitivity to anti-cancer drugs. The results of the study indicated that the miR-335/SIAH2/HDAC3 axis regulates the response to anti-cancer drugs. | |||
Disease- and Tissue-specific Abundances of This Molecule
ICD Disease Classification 02

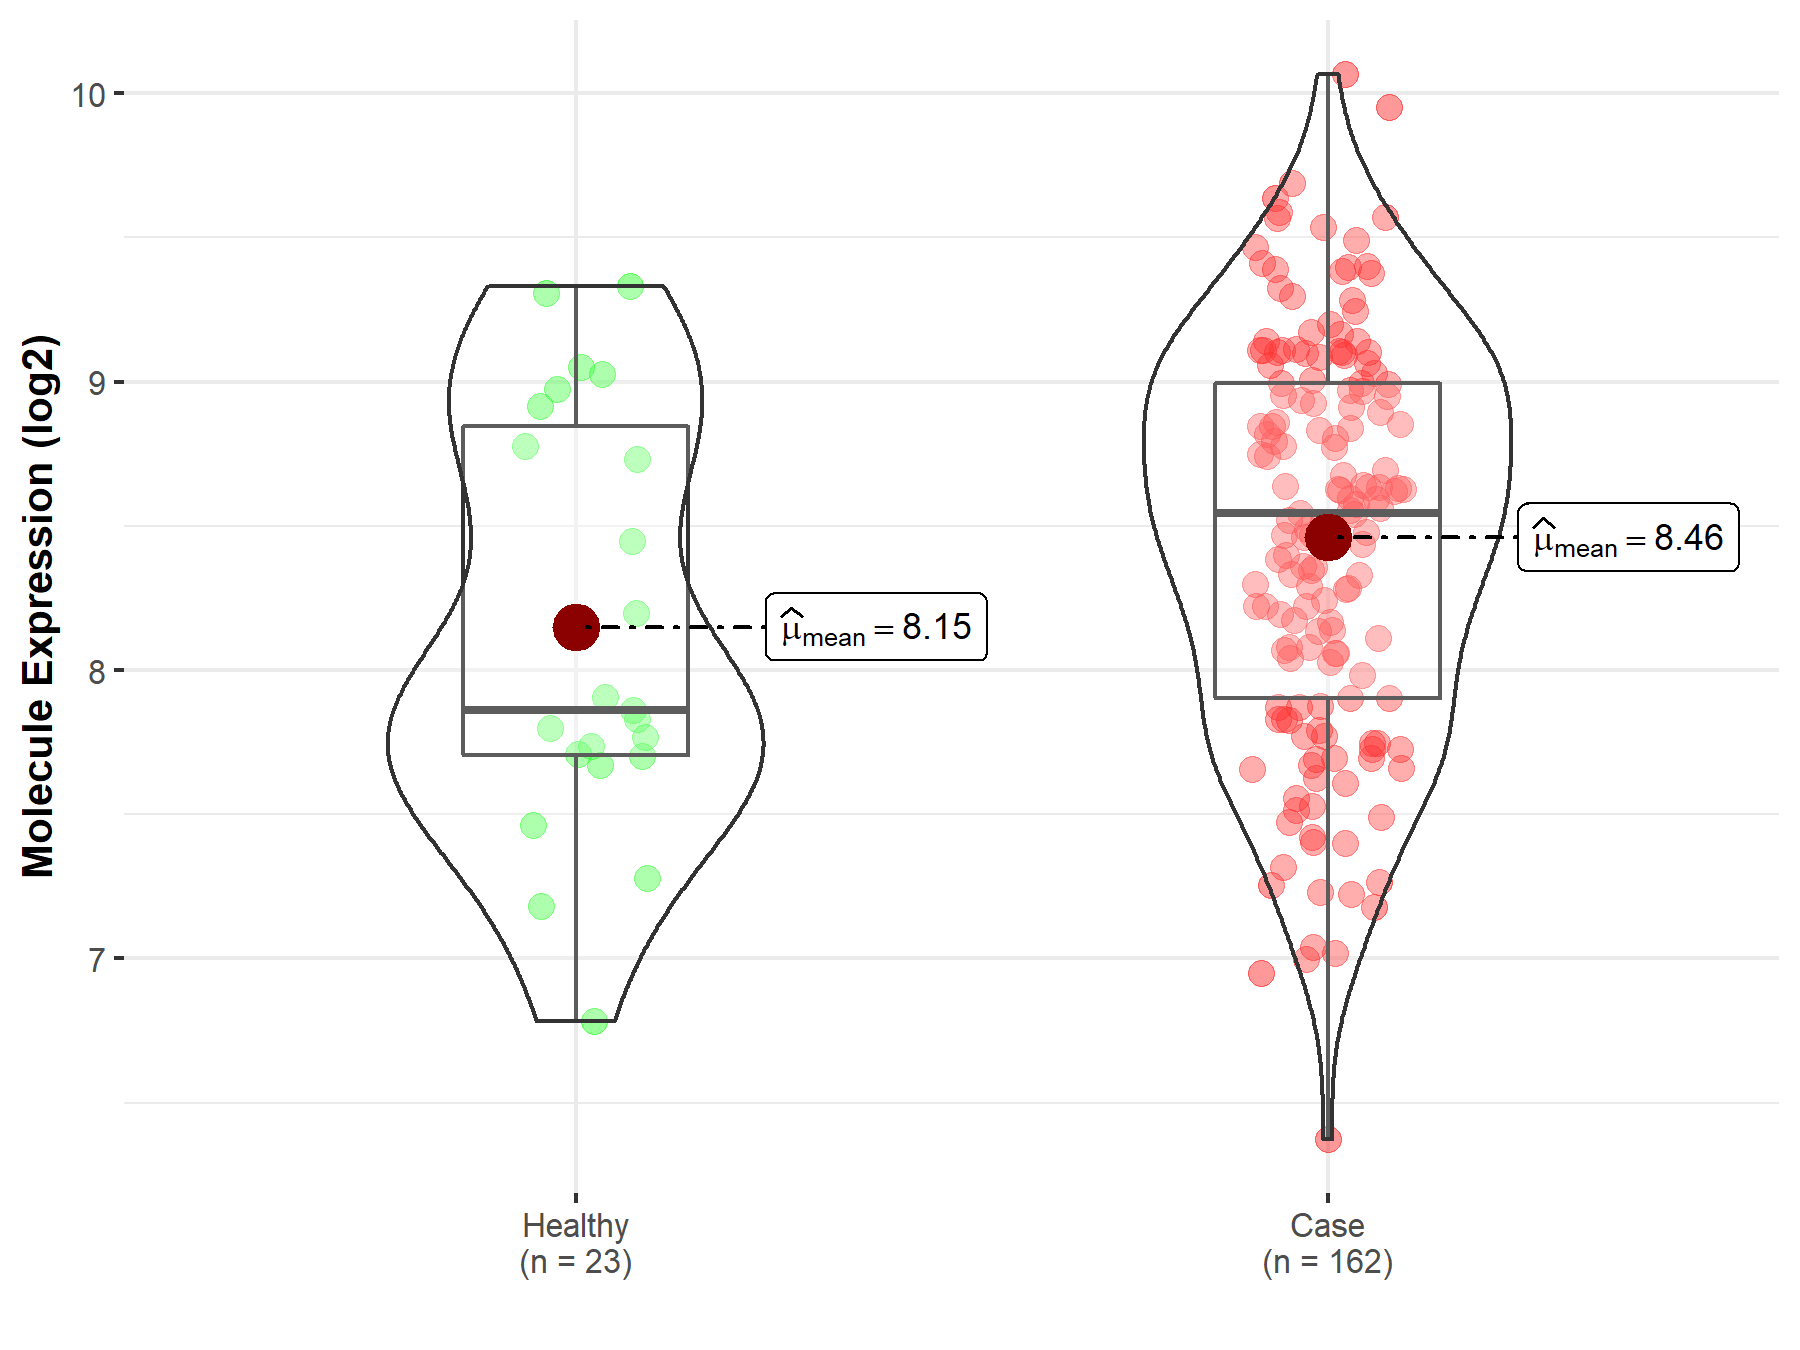
| Differential expression of molecule in resistant diseases | ||
| The Studied Tissue | Liver | |
| The Specified Disease | Liver cancer | |
| The Expression Level of Disease Section Compare with the Healthy Individual Tissue | p-value: 4.46E-01; Fold-change: 6.61E-02; Z-score: 9.92E-02 | |
| The Expression Level of Disease Section Compare with the Adjacent Tissue | p-value: 4.99E-03; Fold-change: 9.00E-02; Z-score: 1.43E-01 | |
| The Expression Level of Disease Section Compare with the Other Disease Section | p-value: 6.62E-01; Fold-change: -6.55E-02; Z-score: -1.59E-01 | |
|
Molecule expression in the normal tissue adjacent to the diseased tissue of patients
Molecule expression in the diseased tissue of patients
Molecule expression in the normal tissue of healthy individuals
Molecule expression in tissue other than the diseased tissue of patients
|
||
| Disease-specific Molecule Abundances |

|
Click to View the Clearer Original Diagram |
| Differential expression of molecule in resistant diseases | ||
| The Studied Tissue | Skin | |
| The Specified Disease | Melanoma | |
| The Expression Level of Disease Section Compare with the Healthy Individual Tissue | p-value: 6.57E-02; Fold-change: 6.83E-01; Z-score: 9.34E-01 | |
|
Molecule expression in the diseased tissue of patients
Molecule expression in the normal tissue of healthy individuals
|
||
| Disease-specific Molecule Abundances |

|
Click to View the Clearer Original Diagram |
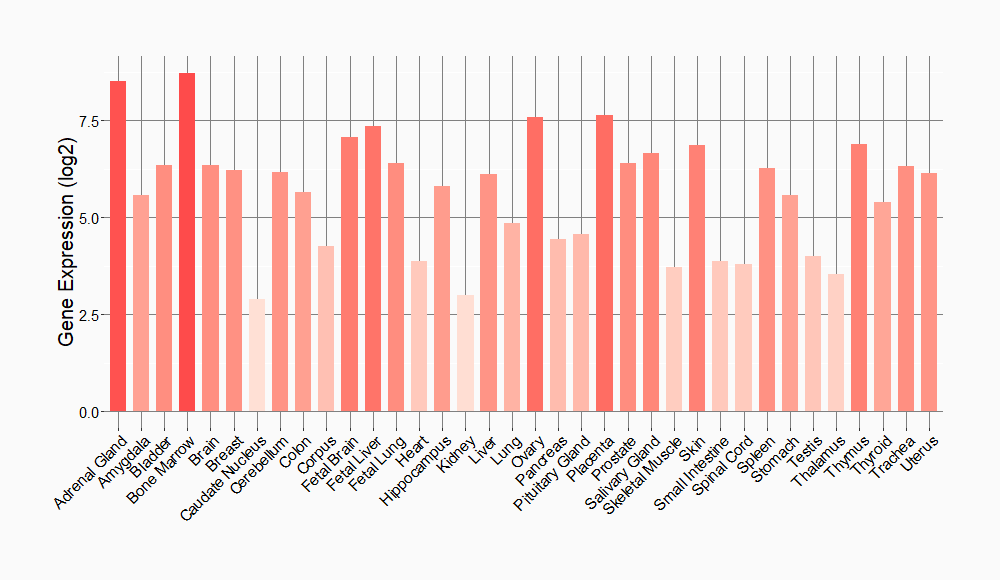
Tissue-specific Molecule Abundances in Healthy Individuals


|
||
References
If you find any error in data or bug in web service, please kindly report it to Dr. Sun and Dr. Yu.
